
ROS has a good number of tools that allow the user and the developer to visualize and debug the code in order to detect and solve issues with both hardware and software. This comprises a message logging system similar to log4cxx, diagnostic messages and also visualization and inspection tools that show which nodes are running and how are they connected.
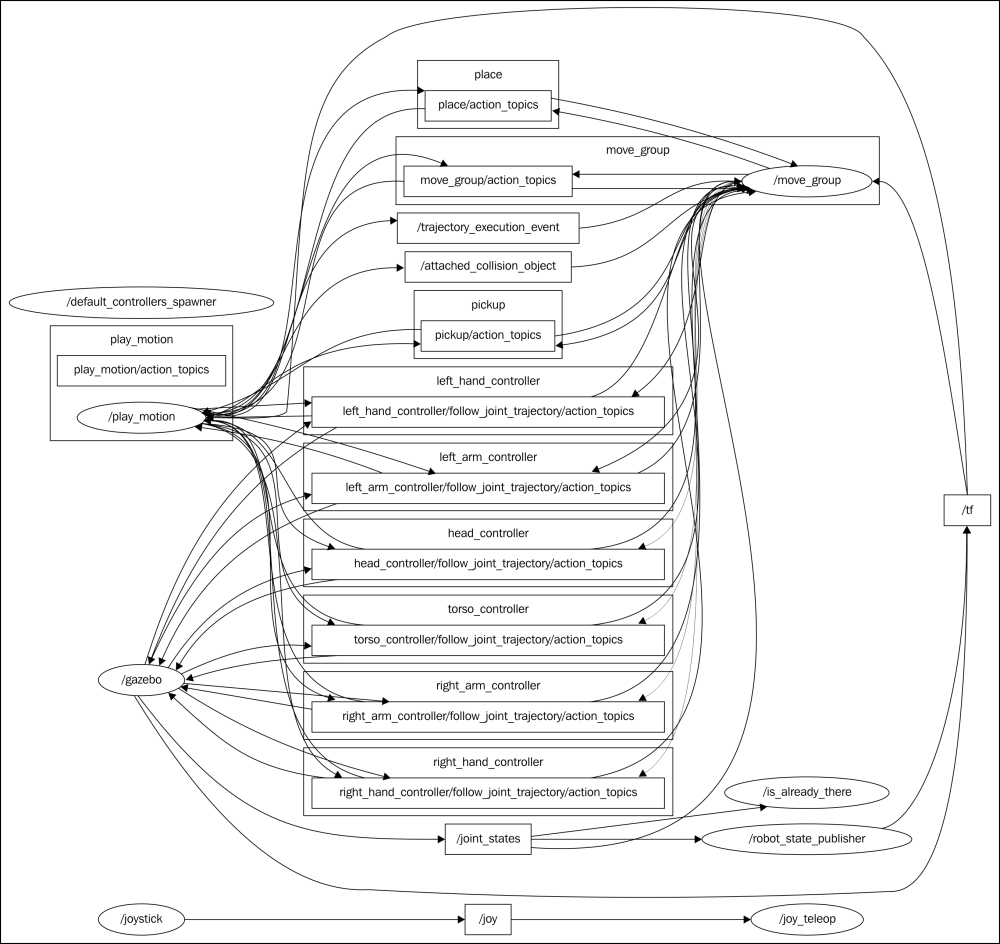
In this chapter, we will also show you how to debug an ROS node with the GDB debugger. The message logging API will be explained, and advice will be given on how to choose the logging level. Then, we will explain the set of ROS tools that are meant to inspect which processes are running and what information is communicated among them. For instance, the following figure shows a tool that visualizes the graph of the system, where the nodes are the processes running and the edges represent the data workflow through communication topics. This tool is rqt_graph, and in this case, it show the nodes and topics for the REEM robot running on a Gazebo simulation.
You can see multiple controllers for the arms, torso, head, MoveIt! move_group node, pick and place action servers, and play_motion node for pre-recorded movements. Other nodes publish joint_states, spawn the robot controllers, and control the joystick to move the mobile base.
Similarly, this chapter will show you how to plot scalar data in a time series, visualize images from a video stream, and represent different types of data in a 3D representation using (the widely known) rviz (or rqt_rviz) shown in the following screenshot:
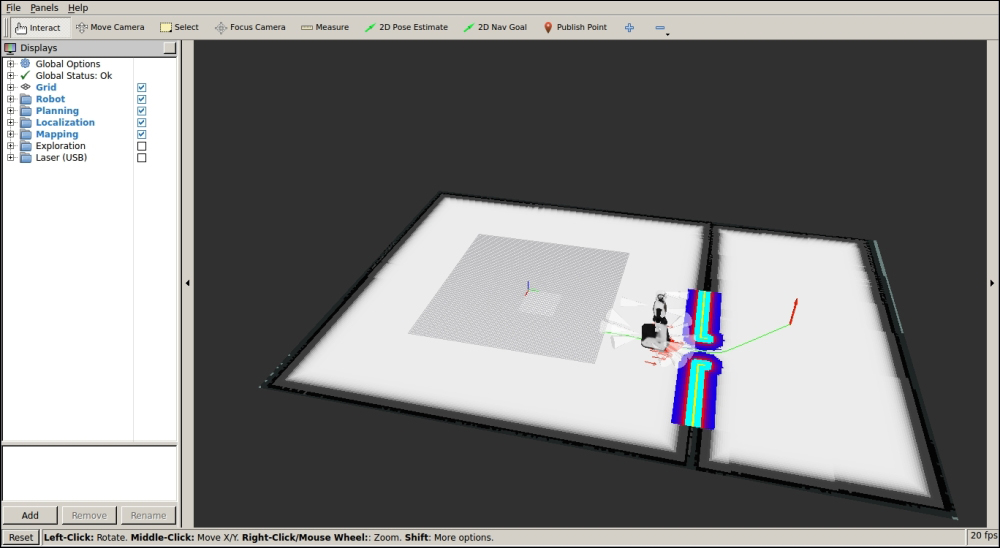
The preceding screenshot shows the REEM robot, which can be run in simulation with the following command:
$ roslaunch reem_2dnav_gazebo reem_navigation.launch
Tip
Downloading the example code
You can download the example code files from your account at http://www.packtpub.com for all the Packt Publishing books you have purchased. If you purchased this book elsewhere, you can visit http://www.packtpub.com/support and register to have the files e-mailed directly to you. You can also download these code files from https://github.com/AaronMR/ROS_Book_Hydro.
Note that, before you install it, you follow the instructions provided at http://wiki.ros.org/Robots/REEM.
In the next sections, we will do the following:
- We will look at how to debug our code in ROS.
- We will look at how to use logging messages in our code, with different severity levels, names, conditions, and throttling options. Here, we will explain the
rqt_logger_levelandrqt_consoleinterfaces, which allow setting the severity level of a node and visualizing the message, respectively. - We will look at how to inspect the state of the ROS system by listing the nodes running, the topics, services, and actions they use to transfer messages among them, and the parameters declared in the ROS master server. We will explain
rqt_graph, which shows nodes and topics in a directed graph representation, andrqt_reconfigure, which allows changing dynamic parameters. - We will look at how to visualize diagnostics information using the
runtime_monitorandrobot_monitorinterfaces. - We will look at how to plot scalar data from messages using
rqt_plot. For nonscalar data, we will explain otherrqttools available in ROS, such asrqt_image_viewto visualize images andrqt_rvizto show multiple data in a 3D representation. We also show how to visualize markers and interactive markers. - We will explain what frames are and how they are integrated into ROS messages and visualization tools. We also explain how to use
rqt_tf_treeto visualize the Transform Frame (tf) tree. - We will look at how to save messages and replay them for simulation or evaluation purposes. We also explain the
rqt_baginterface. - Finally, other
rqt_guiinterfaces are explained as well as how to arrange them in a single GUI.
Most of the rqt tools can be run by simply putting their name in the terminal, such as rqt_console, but in some cases, this does not work and we must use rosrun rqt_reconfigure rqt_reconfigure, which always works; note that the name seems to be repeated but it is actually the package name and the node name one after the other.
ROS nodes can be debugged as regular programs. They run as a process in the operative system and have a PID. Therefore, you can debug them as with any program using standard tools, such as gdb. Similarly, you can check for memory leaks with valgrind or profile the performance of your algorithm with callgrind. However, remember that in order to run a node, you must run the following command:
$ rosrun chapter3_tutorials example1
Unfortunately, you cannot run the command in the following way:
$ gdb rosrun chapter3_tutorials example1
In the next sections, we will explain how to call these tools for an ROS node to overcome this issue. Later, we will see how to add a logging message to our code in order to make it simple to diagnose problems that, in practice, helps to diagnose basic problems even without debugging the binaries. Similar, later on, we will discuss ROS introspection tools that allow detecting broken connections between nodes easily. Therefore, although here we will show you a bottom-up overview, in practice, we follow a top-down approach to diagnose issues.
In order to debug a C/C++ node with the gdb debugger, all we have to know is the location of the node executable. With the ROS hydro and catkin packages, the node executable is placed inside the devel/lib/<package> folder within the workspace. For example, in order to run the example1 node from the chapter3_tutorials package in gdb, we have to proceed as follows, starting from the workspace folder (~/dev/catkin_ws):
$ cd devel/lib/chapter3_tutorials
If you have run catkin_make install, you can also navigate to the install/lib/chapter3_tutorials directory using the following code:
$ cd install/lib/chapter3_tutorials
Now we can run the node executable inside gdb with the following command:
$ gdb example1
Once roscore is running, you can start your node in gdb by pressing the R key (and Enter), and you can also list the associated source code with the L key as well as setting breakpoints or any of the functionalities that gdb comes with. If everything is correct, you should see the following output in the gdb terminal after running the node:
(gdb) r
Starting program: ~/dev/catkin_ws/devel/lib/chapter3_tutorials /example1
[Thread debugging using libthread_db enabled]
Using host libthread_db library "/lib/x86_64-linux-gnu/libthread_db.so.1".
[New Thread 0x7ffff2664700 (LWP 3204)]
[New Thread 0x7ffff1e63700 (LWP 3205)]
[New Thread 0x7ffff1662700 (LWP 3206)]
[New Thread 0x7ffff0e61700 (LWP 3211)]
[DEBUG] [1356342615.325647326]: This is a simple DEBUG message!
[DEBUG] [1356342615.326124607]: This is a DEBUG message with an argument: 3.140000
[DEBUG] [1356342615.326254667]: This is DEBUG stream message with an argument: 3.14
[Thread 0x7ffff0e61700 (LWP 3211) exited]
[Thread 0x7ffff1662700 (LWP 3206) exited]
[Thread 0x7ffff2664700 (LWP 3204) exited]
[Thread 0x7ffff1e63700 (LWP 3205) exited]
[Inferior 1 (process 3200) exited normally]
We might get a launch file that starts the node, as in this example:
<launch>
  <node pkg="chapter3_tutorials" type="example1" name="example1"/>
</launch>
In order to attach it to gdb, we must add launch-prefix="xterm -e gdb --args" as follows:
<launch>
<node pkg="chapter3_tutorials" type="example1" name="example1"
  launch-prefix="xterm -e gdb --args"/>
</launch>
Similarly, you can also add output="screen" to make the node output appear on the terminal. With this launch prefix, a new xterm terminal will be created with the node attached to gdb. Set breakpoints if needed, and then press the C or R key to run the node and debug it. For example, this is useful to obtain a backtrace (bt) if the node crashes.
Additionally, we can use the same attribute to attach the node to diagnosis tools. For example, we can run valgrind (see http://valgrind.org for further information) on our program to detect memory leaks and perform profiling analysis. Contrary to attaching to gdb, now we do not need to start xterm anew:
<launch>
<node pkg="chapter3_tutorials" type="example1"
  name="example1" output="screen"
  launch-prefix="valgrind"/>
</launch>
Although ROS nodes are actually regular executables, there is a tricky point to enable core dumps, which can later be used in a gdb session. First of all, we have to set an unlimited core size; the current value can be checked with ulimit -a. Note that this is also required for any executable and not just ROS nodes:
$ ulimit -c unlimited
Then, to allow core dumps to be created, we must set the core filename to use the pid process by default. Otherwise, they will not be created because at $ROS_HOME, there is already a core directory to prevent core dumps. Therefore, in order to create core dumps with the name and path $ROS_HOME/core.PID, we must run the following command:
$ echo 1 | sudo tee /proc/sys/kernel/core_uses_pid