
Case study from Ordnance Survey: social networking and the transfer of knowledge within supply chain management
As Great Britain’s national mapping agency, Ordnance Survey® is responsible for the maintenance of Great Britain’s national map archive. It is widely regarded as a world leader in the production, maintenance and marketing of a wide range of maps and topographic data products for commercial business, leisure, education and public sector administration. OS MasterMap® lies at the heart of Ordnance Survey’s business strategy; it is a massive database and online service. It includes data that is delivered online in themes such as roads, buildings, address data and imagery. Customers can also access change-only updates, cutting down the amount of data they have to manage. OS MasterMap is updated on a daily basis by field surveyors using hand-held computers to survey and digitise ground information. Map data files of the survey area are called down from the central database on to the hand-held computers and changes are made on the spot. This revised data is sent back to the main Southampton database and processed overnight so the new information can be accessed by customers the day after surveying.
The following chapter was written by Graeme C.M. Smith, Associate Lecturer in Marketing, Southampton Solent University. Graeme had responsibility for the development of the sales and marketing balanced scorecard that defines group performance; the development of strategy performance monitors; and the introduction of customer experience management at corporate level. Graeme has 15 years’ experience in business process improvement in the sales and marketing environment serving customers across the public and private sector, either directly or through third parties in both commercial and consumer markets.
Introduction
For the purpose of this chapter, supply chain management is the process of planning, implementing and controlling the operations as efficiently as possible within the sales and marketing environment. The supply chain spans the tracking of all transactions from the identification of prospective customers, through quote to order conversion, fulfilment and on to postsales support. As an intensive human activity, customer supply chains are wholly dependent on knowledge and require social network activity to transfer that knowledge to the point of need in order to reduce process variation.
This chapter builds upon work undertaken previously by the author, who developed an organisational model of the social interactions affecting knowledge transfer within organisations (Smith et al., 2003). This chapter also discusses the problems of knowledge location, the ability (as well as willingness) to share, the prevention of knowledge attrition through a programme of knowledge definition (codification), knowledge retention and knowledge transfer across the customer interface.
The argument is made that while much information is being shared, the knowledge that makes such information useful must also be transferred, or else new desired outcomes will not emerge. In order to share such knowledge, lessons were learned from three major studies that were carried out in 2004, 2006 and 2007 to determine the extent of failure to transfer knowledge within the sales and marketing supply chain at Ordnance Survey.
As a result of these studies, a programme of work was introduced to identify knowledge silos acting as centres of excellence in the supply chain and putting in place a project to preserve and transfer knowledge from these silos to facilitate learning and reduce knowledge attrition.
This chapter focuses on empirical evidence from these studies and the impact that this knowledge management project has had on the efficacy of the supply chain to deliver the desired outcomes.
For the purposes of this chapter, the focus is on customer orientation, the interface across the customer/supplier dyad and the transfer of knowledge through people, processes and systems. The methods of business process improvement as a means of changing culture are also reviewed. The overall aim of this chapter is to discuss the role of social networks in the successful sharing of knowledge within organisations.
What was the problem?
Sales and marketing management knew for some time that account managers and order processing staff were being distracted from the real focus of their roles and responsibilities towards dealing with growing customer demand that was the result of process non-conformance within the customer supply chain. At the same time there were a number of widely held assumptions regarding the nature of non-conformance and what was needed to reduce it. However, senior management was persuaded that a new way of thinking was needed to address the complexity of the problem. This new approach would consider the application of systemic thinking for human systems and processes, the methods of creating, organising and using information, and the transfer and application of knowledge. Internalising this systems view and the consequential impact on social networks should, it was felt, lead to practical and effective systemic action and process improvement.
Silos
There was growing anecdotal evidence that each iteration of management restructuring was driving knowledge into silos throughout the customer interface. There was also evidence that individual ‘experts’ were acting as knowledge hubs and exerting undue influence on the efficacy of the supply chain.
Enterprise-wide technical and management systems are needed for the efficient sharing and dissemination of information. However, creating these processes is not in itself enough to set the process in motion, since there are a number of individual and cultural barriers to sharing information. These barriers may coincide with functional or hierarchical barriers that can lead to the splintering of organisational information and its acquisition and dissemination, and management structures sometimes do not facilitate the collection and dissemination of information. Management and organisational culture has a large part to play in eliminating these barriers and the difficulty in reversing this process should not be underestimated (Probst et al., 1999).
Assumptions
Assumption 1: System implementation changes processes and behaviour
From discussions within sales and marketing it was clear that senior management felt that by changing the work processes within the organisation as part of an IT solution to facilitate a sharing of knowledge, new behaviours would emerge as a direct result. Thus the new knowledge that was accessible to all would encourage learning and new behaviour.
Assumption 2: Systems are mechanistic in nature
In discussions with employees (especially managers), there was a mechanistic view of the organisation as a machine, with the employees as cogs working within it. The focus within the company upon business process re-engineering and the way it is described supports this view of the organisation as a machine that can be rebuilt, fixed and have new parts fitted.
McAdam and McCreedy (1999) indicate that many knowledge management models reflect this old managerial paradigm and do not recognise the importance of the individual within the system (see Figure 10.1, where black arrows indicate expected behaviour and white arrows represent actual behaviour).

Figure 10.1 Demarest’s knowledge management model
Demerest 1997
Assumption 3: Organisational systems will be rational
Operational managers within the Ordnance Survey knew that there were key processes within the system that were increasingly reliant on ‘experts’ in the back office and that these experts were being used by front-office staff such as account managers to help them resolve customer issues. This flow of knowledge from the front to back office was increasingly beginning to impact on the workload of these experts and their immediate workplace colleagues. This raised a number of concerns for senior managers, such as: where was this demand coming from, what was the root cause and what knowledge in the back office was being valued and exploited by the front office? McAdam and McCreedy (1999) go on to show that to ignore the social nature of knowledge development is to oversimplify the behaviour and to underestimate what needs to be done to develop knowledge management systems. Figure 10.2 shows this increased level of complexity.

Figure 10.2 McAdam and McCreedy’s knowledge management model
McAdam and McCreedy 1999
It was logical, therefore, that if there is to be the requisite organisational learning required to develop new behaviours, there must be recognition of the constructed nature of knowledge within the new system.
Methodology
Determining knowledge transfer within the process
There was a growing realisation within the business that in order to change the culture from rigid command and control to a more customer-orientated culture required a completely new approach. To determine this system view of the customer interface Ordnance Survey set up a small team of business analysts (service improvement team) who specialised in systems thinking and process engineering. The objective of the team was to define the sales pipeline (supply chain) that provided value to the customer.
The service improvement team facilitated a series of workshops with staff over a three-month period to codify processes (see Figure 10.3), business rules and local work instructions. To provide structure, prioritise work and feedback outputs from the workshops through to the systems architects, the service improvement team defined the sales pipeline as a logical series of steps through which customers travel in order to obtain data products or licences.

This new end-to-end view helped staff to understand better the activities they were responsible for and the part they played in adding customer value. The sales pipeline was then defined as seven key stages that would help to define particular process problems (see Figure 10.4).

The identification stage of the pipeline includes the identification of new markets, new prospects within existing markets and the production of marketing collateral aimed at stimulating market growth. New leads are then qualified by sales managers and pre-sales technical consultants and, for those that are passed as genuine opportunities, proposals are presented through negotiations with the clients. Once acceptance of these proposals had been reached, an order would be raised, fulfilled and invoiced. The final stage of the process involved post-sales activity, ranging from dealing with enquiries and complaints through to post-sales technical consultancy.
Demand audit
Having defined the people, process and IT systems extant within the sales pipeline, the next objective was to audit volume within the pipeline in terms of customer demand and the amount of human resource required to manage this demand. The scope of the audits was the whole of sales and marketing and included teams outside of sales and marketing, such as credit control (finance) and data supply (product management), which managed key stages in the end-to-end process. To date there have been three audits – 2004, 2006 and 2007 – covering some 200 staff.
Staff were asked to record time for a calendar month against a list of activities within the sales pipeline. Resource was measured in terms of hours spent serving the customer and getting it right first time (value add), as well as the amount of effort required to rework activity for the customer as non-conformance (process failure) – in other words process variation from the process standards set. The hours recorded by each member of staff were converted to salary cost plus expenditure and then annualised to provide the total annual costs of all staff involved in the audits.
Findings – 2004 audit
The study population included some 200 staff responsible for delivering marketing collateral, account management, customer service and pre- and post-sales activity. The response rate was 90 per cent.
Demand audit output
At the end of the audit the data were aggregated, analysed and profiled against the sales pipeline. This method of statistical analysis was delivered back to the teams involved and assumptions on the results clearly stated. Staff were then asked to participate in workshops to verify the data results and challenge the assumptions made. Initial workshops were process-based, including staff from various teams across the supply chain. A second series of workshops was conducted on a team-by-team basis. The reason for this was to try and capture the root cause of non-conformance from the process perspective and the business (team) perspective. This resulted in a more balanced view of the root cause of failure and each workshop acted as a ‘sanity check’ on the quantitative and qualitative data collected so far. The data analysis and workshop output were then presented to the senior management board to gain buy-in on the findings, conclusions, recommendations and the action plan required to prioritise and address process non-conformance.
The first audit took place in July 2004. Results were analysed through August and September, with the results and recommendations presented to the senior management board in October.
The 2004 audit presented a number of challenges to the senior management and service improvement teams. First, the volume of data and its comprehensive nature required an agreed structure (the sales pipeline) to analyse and report the audit findings. Second, there was the scale and complexity of non-conformance. Nobody had hitherto been able to present such a comprehensive picture regarding failure in both social network activity and IT systems. And third, there was the need to gain consensus and agreement on the data findings and to agree a programme to prioritise work for improving the customer experience. To address these challenges, the audit data was rigorously analysed and the findings aligned to the sales pipeline framework. This view made it easier to communicate the findings back to participants in a process view that they could easily recognise and understand.
The results confirmed management’s view that account managers were spending too much time on post-sales activity rather than stimulating sales and new business. The audit results also gave management a great deal of detail on this resource imbalance, as the construct of the audit and subsequent data analysis brought into sharp relief the process activity that lay at the root cause of generating process non-conformance. The 2004 audit identified £1.05 million of process non-conformance, which equated to 21 per cent of the total salary bill for sales and marketing activity. As a result of the 2004 audit, a programme of process and service improvement was recommended and accepted by the senior management team.
Implementation
The consensus view was that a lot of the issues raised by the audit were widely known. What had not been appreciated was the nature and extent to which these issues had an impact all the way up and down the sales pipeline and the attendant cost. It was this new perspective that galvanised management and staff alike to clearly articulate the root cause and put forward business cases for process and IT improvements, underpinned by the costs of non-conformance derived from the demand audit data.
Knowledge experts
One of the more surprising results was the high levels of failure demand that some members of staff were having to deal with. Some were facing levels of non-conformance that were as high as 80 per cent of their total effort employed. Closer inspection of the data and workplace analysis of activities measured, revealed the nature and extent of the role these individuals were playing within the social network.
The most revealing aspect of their role was the fact that the rest of the organisation was using them as knowledge experts. They were being exploited for their knowledge, the position they held in the value chain, their propensity to help others solve customer problems and, to a certain extent, by their own management, who left them alone simply because they ‘got things done’ and helped the team achieve their key performance indicators. As a result of staff movements and retirements, these individuals were having to deal with increased demand and were becoming a scarce resource and a growing risk to the business. Their own lack of capacity to create and innovate change in the process due to volume pressures was reducing their ability to transfer knowledge to others. Of immediate concern to management was the high degree of risk that this built into the process. Individuals leaving their role would see a collapse of the social network previously dependent upon their knowledge.
Knowledge transfer
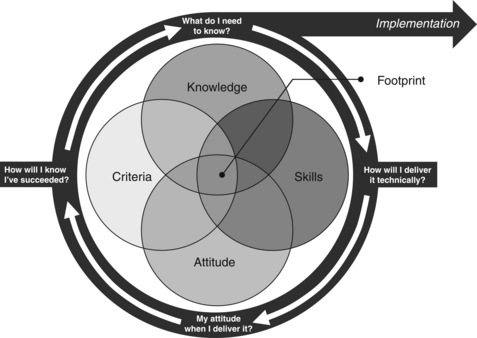
To address the known risk of knowledge hubs, the service improvement team identified the key players within the various processes. A series of workshops were conducted to establish the extent of the expertise that these individuals had in order to define exactly the range of skills and competencies employed. At the same time social network analysis was used to map the knowledge ‘footprint’ of each knowledge hub and their area of influence across the business, as well as the input to and output from each knowledge hub (knowledge flow and volume). The human system was dealt with as a matter of priority in order to substantially reduce this risk. The business analysts completely remapped the processes around the knowledge hubs and identified the knowledge requirement at activity level as they went along. The process mapping was used to codify tacit knowledge for future transfer and define roles and responsibilities.
Process definition
Apart from the work previously done on a pricing and licensing model, there was almost a complete absence of any clearly defined end-to-end process. The most that existed within the sales pipeline were local work instructions at team and an individual level. The lack of clearly defined process maps showing process hand-offs between teams and individuals had a huge impact on the amount of resource that was not aligned to the sales pipeline, leading to high levels of failure demand. This lack of definition was a major source of discussion at subsequent workshops. The absence of process maps led to job creep, as individual responsibilities were allowed to grow at the expense of neighbouring roles and responsibilities. In some instances this led to job overlaps. These overlaps caused severe problems as staff were transferred on promotion or personal development or exited the business. Managers recruited to backfill these vacancies discovered, often too late, that the job description bore no relationship to the scope of the role the previous incumbent actually fulfilled. Additionally, subsequent recruitment created gaps in the process hand-off that took some time to fill due to unplanned training and job role reconciliation with neighbouring staff in the process.
Once the process mapping stage was complete, the knowledge gathered was rolled into a knowledge and learning programme (see Figure 10.5) to transfer knowledge, skills and competencies. Skills matrices were defined for each member of staff, first to measure individual capacity to fulfil the requirements of the role and, second, to monitor personal performance as a basis for establishing future training needs.
IT systems
The root cause of sales managers spending too much effort on post-sales activity rather than generating sales was finally identified. The audit reported the problem as one related to order processing and the clarity of invoicing. The quote-to-order conversion process was not as smooth as it should have been, due to a number of previous IT improvements having been de-scoped. The result was that manual workarounds in the order processing areas were allowing order errors to creep into the IT system. Subsequent invoices sent to customers with information based upon these orders were increasingly being queried by customers and sales managers were spending increasing amounts of time trying to resolve these queries. At the same time, call volumes in the contact centre were beginning to overwhelm service desk agents. Prior to the audit there were a number of stalled IT improvements and requests for change (RFC) that had been scheduled to resolve quote-to-order problems and invoice accuracy. These IT improvements attempted to automate the business rules that govern pricing and licensing.
As the Ordnance Survey is a licensing authority, these business rules are complex and not easily replicated in IT systems. The demand audit identified process and knowledge gaps where changing business rules had not been replicated through RFCs in the IT systems, as they were waiting for IT system architect resource. This meant staff having to create manual workarounds without necessarily codifying what these were. Additionally, RFCs had no cost metrics to help prioritise the work required to implement these changes. Process non-conformance costs from the demand audit were aligned to the RFC schedule to prioritise this work.
Findings – 2006 audit
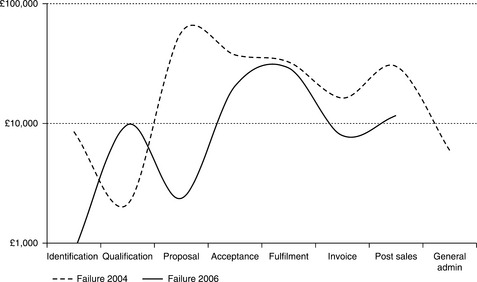
As a consequence of the work done after the 2004 audit, it was decided to benchmark improvements with a second audit in 2006. The 2006 audit was structured along the same lines as the 2004 audit, with some improvements to clarify activity and to align results from both audits. The 2006 audit (Figure 10.6) showed that failure demand had fallen from 21 per cent of total cost in 2004 to 14 per cent in 2006. This was the equivalent of stripping out £0.4 million worth of process non-conformance on an annual basis. This released process capacity (£3.3 million, 46 per cent of total cost) to transfer resource to selling activity in the pre-sales part of the pipeline.

Figure 10.6 Total sales pipeline resource 2004–2006
Note: The Y axis is on a logarithmic scale to help clarify the data; the data shows the annualised costs to serve through the sales pipeline
Total demand profile
The 2006 audit highlighted some significant movements in the demand profile. Further detailed analyses of the data at a team and individual level told us the direction and total value of this movement. Some of this movement was partly due to the elimination of non-conformance in the sales pipeline. It was this reduction that allowed senior management to realign resource towards demand generation in the pre-sales part of the pipeline. This movement could take place as a result of process improvements on proposal, invoice and post-sales activity, leading to a corresponding increase in identification, qualification and fulfilment (see Figure 10.6).
Total non-conformance profile
The cost of non-conformance fell by £0.4 million over an 18-month period between the two audits, the most significant reductions being in the proposal to post-sales parts of the sales pipeline (see Figure 10.7). These savings were largely due to facilitating the transfer of knowledge through the knowledge and learning programme (see Figure 10.5).

Team non-conformance
The impact of this reduction in non-conformance at a team level is illustrated in Figure 10.8. The data supply team is responsible for quote-to-order conversion of data requests and dispatching them to customers. The 2004 level of non-conformance was particularly high in the pre-sales part of the pipeline up to acceptance and in the post-sales part of the pipeline after fulfilment. The drop in non-conformance recorded in 2006 was due to process automation brought about by the results of the 2004 audit and to increasing the accuracy of order processing and that of invoices, leading to reducing the volume of customer enquiries.
The impact of this process improvement can be seen in Figure 10.9. This shows the total cost of resource employed by the data supply team along the sales pipeline and the realignment of team resource (worth £424,000) between the two audits.

Findings – 2007 audit
Concomitant to the realignment of the cost to serve in data supply shown in 2006 (see Figure 10.9), an additional £130,000 worth of resource was redeployed (Figure 10.10) to other parts of the business due to an overall drop in demand, driven by increased process efficiencies.

Overall findings of the 2007 audit
The total number of respondents in 2007 was the same as that for 2006; 89 per cent of the population completed the 2007 audit. Over the three audits, non-conformance in 2006 fell by 35 per cent against the benchmark of 2004, and fell again by 34 per cent in 2007 against the previous audit in 2006.
Figure 10.11 shows a sustainable realignment of total resource in the sales pipeline. The effort in fulfilment dropped as a result of continuing introduction of automation in order processing. Costs to serve are continuing to be maximised as resource in general administration continues to show an audit-by-audit rise over the three audits. This has had the effect of reducing overall cost to serve on account support activity, as support effort moves from high-value resource (sales managers) in terms of cost to low-level resource cost in administration. This is highlighted by the rise in demand generation activity (see Figure 10.4) between the 2006 and 2007 audits as sales staff start to increase activity in demand generation and post-sales support parts of the pipeline.

Was the problem due to ignoring social architecture?
It was the idea of social architecture affecting interpersonal relationships, structures, leadership, communication and, therefore, the successful passing on (or not) of knowledge that led to the publication of a series of papers from 2001 to 2003 and was of particular interest to the service improvement team. The work of the service improvement team established that the real challenge to knowledge transfer was one of communication. All communications models show filtering and ‘background noise’ as key elements in the success (or not) of the message and understanding transfer. By rethinking learning as being framed by the social architecture, it was seen that this background noise was acting as a filtering system. For example, emotions at work have always been acknowledged to have an impact but it is increasingly seen as having a serious effect on the efficiency of the outputs of any system (Clutterbuck and Megginson, 1999; Weisinger, 2000). They will always affect the potential receiver and will change over time.
Personal character traits
The degree with which staff are prepared to transfer knowledge depends on their dominant character trait at the time. The dominant character trait will depend upon the emotional state of the individual governed by current stimuli and/or past experience. The service improvement team found evidence that the rate and quality of knowledge transfer were being conditioned by personality and the environment that prevailed leading up to and between the first two audits. Between the first two demand audits of 2004 and 2006, the organisation conducted a staff opinion survey on a wide range of issues. Detailed workshops with a focus group from the customer service centre (some 35 per cent of the 2004 demand audit population) suggested staff were unwilling to participate in process creativity and innovation to improve service delivery. The main issues were management and leadership, lack of trust due to ‘a blame culture’ and the lack of defined boundaries between roles and responsibilities. Once these issues were seen by staff as being addressed, there was a noticeable improvement in the rate of creativity and innovation. Basically staff were simply ‘keeping their heads down’ until such time as a more enlightened management was in place and when they trusted the new regime.
Knowledge transfer
As the service improvement team began to close off remedial actions identified through demand audits, knowledge experts in the system and the lack of knowledge transfer, levels of non-conformance began to fall (see Figure 10.12).

The introduction of the knowledge and learning pack in 2006 (Figure 10.5) was designed to capture the tacit knowledge of the experts in the system and, through a programme of codifying and retraining, knowledge transfer could take place. Figure 10.13 highlights the impact that this programme had on the number of staff dealing with levels of non-conformance greater than 15 per cent of their total effort. In 2004 the total number of staff was 60; by 2006, 53 were dealing with less non-conformance – a drop of 88 per cent; in 2006 the number of staff was 69 and by 2007, 58 were dealing with reduced levels of non-conformance – a drop of 84 per cent.

Space
Creativity is not an event, it is a process. During the workshops between the first two audits it was an often expressed perception that staff did not have the time to change the way they do things. Some of the mapped processes were running to near capacity in relation to the number of people employed on them. There was a lack of ‘thinking space’ that negated staff’s ability to be creative and to initiate change through successive approximations of the desired end result. It was soon realised that the service improvement team were in fact fulfilling this requirement.
Creativity involves a shift in the focus of attention and mode of thinking as we attend to what is working and what is not working. It can be individual or shared and can involve instant judgement or long-term testing. In most cases there are many shifts between these two modes of thought (Robinson, 2003). People don’t have enough time to learn when processes are running to, or just above, capacity. An exclusive focus on efficiency can discourage learning. Managers who overemphasise results can subtly discourage technologies, skills or practices that make new approaches viable (Edmondson, 2008). In a customer service environment, staff have to have space to encourage the sharing of analysing insights, questions and problems.
Reward systems
Currently the organisation is implementing a new performance-related pay system based on behaviours, skills and competencies, which hopefully will act as a major incentive within the organisation. However, unless the employees see process key performance indicators directly relating to the new performance-related pay system, such a reward scheme will fail to support the successful implementation of new behaviour. At present there is no evidence that the new reward scheme will encourage process creativity and innovation. In fact, should reward be received without effective processes, as hoped, this will reconfirm old behaviours and make successful implementation of changes to process innovation even less likely.
Power
By definition, intentional networks have at their centre a knowledge hub actor who is a gatekeeper for the creation and transfer of knowledge. The focus of process demand on these players is predicated on their ability to expedite the creation, acquisition and transfer of knowledge required. This can create positions of power within the network, where the player may exercise a dominion over others in the network according to social conditions and personal character traits exerted at the time of exchange. Intentional networks are ‘egocentric’ networks that arise from individuals and their communication and workplace activity (Nardi et al., 2000).
These networks are personal. In contrast to communities of practice where workers inhabit a shared cultural space, intentional networks are the creation of individuals. Joint activity is accomplished by the assembling of sets of individuals derived from overlapping constellations of personal networks. These individuals have to create sufficient shared understanding to get work done, but such understanding must be collectively constructed rather than existing historically in an ongoing community or organisation. An intentional network is often much more distributed than a community of practice.1 Workers are not thrown together in situation-dependent ways or assembled through outside forces. Instead, work activities are accomplished through the deliberate activation of workers’ personal networks.
Conclusion
This chapter has shown that many knowledge management implementation problems are about the way the processes and systems for knowledge-creation are being developed in isolation from the social systems of the organisation. Rather than being a process problem, poor knowledge emergence from a new system is more likely to be a communication and learning problem, where there is a failure to engage with the individuals who are within the system.
However, at present many of these issues do not seem to be taken as seriously as they need to be within the organisations themselves. Organisations do not spend enough time diagnosing the root cause of failure to transfer knowledge within the process. Social networks exist for a reason, either to make an existing process work or, alternatively, to bypass the codified process due to failure in people who may be wedded to the security of known relationships and are refusing to change. Merely codifying the process as maps and local work instructions is vital but is nowhere near enough to anticipating entropy in the process as customer demand begins to drift away from the capability of a process to deliver the need of that demand. In many businesses it is this gap that increases in size due to management nescience as they focus on process output (by which time it is too late) rather than process input (knowledge transfer through social networks). It is this unconscious focus on outputs that costs organisations so much. By spending more time on organisational diagnosis of knowledge, how it is created and ultimately transferred (or not as the case may be), that benefit will accrue sooner, money will be saved and the pain outlined in this case study avoided.
Knowledge management caters to the critical issues of organisational adaptation, survival and competence in an increasingly discontinuous environment. Essentially, it embodies organisational processes that seek to maximise the combination of data and information processing capacity of information technologies and the creativity and innovation of the people who work in it. Up until now the maxim seems to have been that investment in new technology somehow results in improved business performance. Rather, managers should ask themselves whether success gained so far was due to an era of competitive advantage based upon the management of information as opposed to one based upon knowledge-creation in a learning organisation.
Enterprise-wide knowledge management systems are not a panacea for solving the problems of sharing knowledge in a company that aspires to be a learning organisation. Important though such systems are, it is the successful management of business processes as well as the cultural issues that relate to the way people are prepared and are able to share information that is of fundamental importance. The best practitioners have long realised that it is people that matter and that it is the human aspects of knowledge-creation that are critical for facilitating an enquiring mind and sustaining the learning organisation.
References
Clutterbuck, D., Megginson, D. Emotional intelligence in executive mentoring. Plenary Paper at 6th European Mentoring Conference, 25–26 November. Cambridge University, 1999.
Demarest, M. Understanding knowledge management. Long Range Planning. 1997; 30(3):374–384.
Edmondson, A., The competitive imperative of learning. Harvard Business Review. 2008. [July/August].
Goleman, D. Social Intelligence. London: Hutchison; 2006.
McAdam, R., McCreedy, S. A critical review of knowledge management methods. The Learning Organization. 1999; 6(3):91–100.
Nardi, B., Whittaker, S., Schwarz, H., It’s not what you know, it’s who you know: work in the information age. First Monday. 2000 May;5(5). http://firstmonday.org/issues/issue5_5/nardi/index.html
Probst, G., Raub, S., Ramhardt, K.Managing Knowledge: Building blocks for success. Chichester: Wiley, 1999.
Robinson, K.Out of Our Minds – Learning to be creative. Oxford: Capstone, 2003.
Russell, B.History of Western Philosophy. London: Routledge, 1961.
Smith, G., Blackman, D., Good, B., Knowledge sharing and organisational learning facilitation through social architecture modeling. Journal of Knowledge Management Practice 2003; 4. http://www.tlainc.com/jkmpv4.htm
Weisinger, H.Emotional Intelligence at Work. San Francisco, CA: Jossey-Bass, 2000.
1.The editors would not necessarily agree with this. There are plenty of communities of practice that have been created ‘bottom-up’ by the individuals concerned and are often extremely widely distributed. However, we would agree that the most effective communities extend beyond the purely personal networks.