Development of Water Saving Techniques for Sugarcane (Saccharum officinarum L.) in the Arid Environment of Punjab, Pakistan
Abdul Gaffar Sagoo, Abdul Hannan, Muhammad Aslam, Ejaz Ahmed Khan, Amir Hussain, Imam Bakhsh, Muhammad Arif and Muhammad Waqas
The high aridity index of Pakistan coupled with rapidly decreasing surface water resources demand supplemental irrigation for profitable agricultural production. An inadequate irrigation water supply is one of the major bottlenecks in enhancing domestic cane production in Pakistan. To discover appropriate water conservation techniques to combat irrigation deficit in the country, a field experiment was conducted with autumn sugarcane cv. HSF 240 as a test crop at two sites: Location-I (silty clay) and Location-II (sandy loam soil) during 2003–2004 and 2004–2005. The experiment was laid out according to a randomized complete block design (RCBD) with factorial arrangement in four replications through a net plot size was of 24 m2. The available soil moisture depletion levels were ASMDL1 (20%), ASMDL2 (40%), ASMDL3 (60%), and ASMDL4 (80%), while planting patterns were G-60 (60 cm), G-75 (75 cm) spaced single row planting patterns, G-30/90 (30/90 cm), and G-30/120 (30/120 cm) spaced paired row strip planting patterns. The pooled data of both locations showed maximum performance in terms of stripped cane yield, sugar yield, sugar recovery percentage, and net field benefit at 40% ASMD level followed by 60, 20, and a minimum of 80%. So far as planting pattern was concerned, maximum output was noted with 30/90 cm spaced paired row strip planting pattern followed by 75, 60, and 30/120 cm. The interactive effects of ASMD levels and planting patterns on agro physiological traits of sugarcane were significant at both locations. The maximum response in terms of plant height, weight per stripped cane, individual stripped cane length, cane diameter, unstripped cane yield, stripped cane yield and sugar yield, leaf area index (LAI), leaf area duration (LAD), net assimilation rate (NAR), harvest index (HI), sugar recovery percentage, and net field benefit were recorded with 40% ASMDL×30/90 cm spaced paired row strip planting followed by 40% ASMDL×75 cm and 40% ASMDL×60 cm plots, respectively. Therefore, maximum economic benefit could be obtained from sugarcane crop by irrigating it at the 40% ASMD level and sowing at 30/90 cm spaced paired row strips under arid conditions on silty clay and sandy loam soils.
Keywords
soil moisture depletion; planting pattern; irrigation; economic benefit; root zone; sugar yield; planting geometry; net field benefit
21.1 Introduction
Sugarcane, one of the most important cash crops, plays a vital role in the national economy of Pakistan. It is an important source of income and employment for farmers, particularly during the winter season. The challenge of increasing sugar from sugarcane has been erratic, and there has been insufficient rainfall distribution to support the entire crop cycle (Pires et al., 2008; Cheavegatti-Gianotto et al., 2011). Sugarcane requires about 1200 mm of annual rainfall equally distributed throughout the entire growing period. The sugarcane crop requires 88–118 kg water/kg cane and 884–1157 kg water/kg sugar to produce plant and ratoon crops (Ashok et al., 2011). In Pakistan, it has been estimated that rain meets only 25% of the water needs of the crop; the remaining 75% of water is met through additional irrigation, but water is not always available in the desired quantities and crops frequently suffer from lack of available soil moisture. The prevalence of drought during the peak growth period of sugarcane results in a considerable reduction in its yield ability. Drought remains a research topic of high priority for agricultural scientists (Medici et al., 2014) causing reduction in growth and development of plants due to the cessation of cell expansion directly related to carbon assimilation and photosynthetic rates (Benesová et al., 2012; Zingaretti et al., 2012). In order to realize the full benefits of the land and environmental resources, it is necessary to place the plants in the field in such a pattern that there is the least competition among them for essential growth factors.
Proper orientation of plants in the field plays a significant role in the development and functioning of vital plant organs. Planting geometry provides the right direction of plants in the field in the form of multi-row strips, which facilitate efficient and expeditious intercultural operations, conserve irrigation water with saving in labor, and permit systematic planting and handling of intercrops. Plant spacing accordingly affects the number of plants, plant height, plant health, and plant canopy, which are directly associated with plant yield. The present study, therefore, was designed to investigate the impact of soil moisture depletion and planting geometry on the yield and quality of sugar cane under arid climatic conditions in Pakistan on two soils: silty clay and sandy loam.
21.2 Methodology
Sugarcane (Saccharum officinarum L.) is a tropical crop of long duration and requires abundant water. Increasing urban growth and environmental concerns are limiting the amount of water available for agricultural use. In Pakistan, especially in Punjab and Kyber Pakhtunkhwa, the sugarcane lies in areas where its successful growth needs artificial irrigation. Water is not always available in desired quantities during the long growth period of the crop and drought conditions result in considerable loss of yield. To overcome drought stress against the sugarcane crop, a factorial arrangement was laid out in randomized complete block design (RCBD) with four replications. The net plot size was 6×4 m2. Each year the crop was planted during the first week of September and harvested in the first week of December the following year. The seed was used at the rate of 70,000 double-budded setts ha−1. A cane cultivar, “HSF 240,” was used as test variety. Chemical fertilizer was applied at the rate of 200, 200, and 100 kg NPK ha−1 on the farm of urea, P2O5, and K2O, respectively. All the phosphorus, potassium, and one-quarter of total nitrogen were applied at the time of sowing while the remaining nitrogen was applied in two equal splits each at completion of germination at the end of February and at the start of cane formation at the end of March. The crop was kept free of weeds. All agronomic practices were kept normal and uniform for all the treatments. The experiment comprised the treatments shown in Table 21.1. Water was applied to the respective plots as soon as the desired available soil moisture depletion level was reached in the soil within the crop root zone.
Table 21.1
Treatment Undertaken in the Experiment
| Available Soil Moisture Depletion Levels (ASMDL) | Planting Geometries | ||
| ASMDL1 | 20% | G-60 | 60 cm spaced single row strips |
| ASMDL2 | 40% | G-75 | 75 cm spaced single row strips |
| ASMDL3 | 60% | G-30/90 | 30/90 cm spaced paired row strips |
| ASMDL4 | 80% | G-30/120 | 30/120 cm spaced paired row strips |

21.2.1 Soil sampling and determination of moisture content
The gravimetric procedure of direct soil water measurement was applied to determine the water contents in the soil. Soil sampling for soil moisture measurement was carried out regularly on alternate days keeping in view the weather conditions from the first week of May to the last week of September. Composite soil samples at depth intervals of 30 cm up to 150 cm were taken from randomly located sites per plot for moisture determination. The soil samples were dried in an oven at 105–110°C for 24 hours.
21.2.2 Moisture percentage on volume basis
The moisture content percentage on volume basis was computed with the following details:
(21.1)
The bulk density of soil was calculated as below:
(21.2)
(21.3)
(21.4)
AW and RAW are defined as under:
(21.5)
where:
(21.6)
where Oc=critical soil water content in percent by volume.
By combining Eqs. 21.4, 21.5, and 21.6 we get critical soil water contents in percent by volume for different ASMD levels. Critical soil water contents in percent by volume basis (Oc) were calculated by the above-mentioned formulae and are given in Table 21.2.
Table 21.2
Critical Soil Water Contents in Percent by Volume for Different ASMD levels
| Available Soil Moisture Depletion Levels (ASMDL) | Critical Soil Water Contents Percent by Volume Basis (Oc) Calculated by Above Formulae | |||
| Location-I | Location-II | |||
| 2003–2004 | 2004–2005 | 2003–2004 | 2004–2005 | |
| ASMDL1=20% | 21.4 | 21.8 | 14.0 | 16.0 |
| ASMDL2=40% | 18.9 | 19.3 | 12.3 | 14.1 |
| ASMDL3=60% | 16.5 | 16.8 | 10.6 | 12.2 |
| ASMDL4=80% | 14.0 | 14.3 | 8.9 | 10.3 |

Irrigation was applied to respective plots as soon as the desired available soil moisture depletion level reached in the soil in the crop root zone.
21.2.3 Measurement of depth of irrigation water applied
The irrigation requirements of each plot were predetermined on the basis of soil sampling, and irrigation was applied at four different ASMD levels, being 20, 40, 60, and 80% depletion of available moisture in the root zone to bring back the soil moisture to field capacity (Fc); a measured quantity of water was applied to each treatment. A cut throat flume (3′×8″) was installed in the water course at the field entrance to measure irrigation water applied to each plot. Water was allowed to flow up to 10 minutes in the non-experimental area to maintain constant flow of water. The depth of irrigation water applied to each plot (Table 21.3) was calculated from the pre-irrigation soil moisture content in the root zone by using the following relationships:
where:
dw=depth of water to be applied in mm
Fc=field capacity in percent by volume
Oi=soil moisture content before irrigation in percent by volume
Table 21.3
Water Applied to Different Treatments During Both Years at Both Locations
| Available Soil Moisture Depletion Levels (ASMDL) | Location-I (Silty Clay Soil) 2003–2004 | Location-II (Sandy Loam Soil) 2003–2004 | ||||
| Total Number of Irrigations Applied | Depth of Irrigation (mm) | Irrigation + Rainfall (mm) | Total Number of Irrigations Applied | Depth of Irrigation (mm) | Irrigation + Rainfall (mm) | |
| ASMDL1=20% | 55 | 36.93 | 2359.15 | 93 | 25.71 | 2820.76 |
| ASMDL2=40% | 16 | 73.86 | 1509.76 | 28 | 51.42 | 1869.49 |
| ASMDL3=60% | 15 | 110.80 | 1990 | 22 | 77.13 | 2126.59 |
| ASMDL4=80% | 12 | 147.72 | 2100.64 | 16 | 102.84 | 2075.17 |
| Total rainfall received=328.00 mm | Total rainfall received=373.23mm | |||||
| Location-I 2004–2005 | Location-II 2004–2005 | |||||
| ASMDL1=20% | 50 | 37.17 | 2442.5 | 87 | 28.92 | 2896.28 |
| ASMDL2=40% | 14 | 74.33 | 1624.62 | 25 | 57.84 | 1826.24 |
| ASMDL3=60% | 13 | 111.50 | 2033.5 | 20 | 86.76 | 2115.44 |
| ASMDL4=80% | 11 | 148.65 | 2219.15 | 14 | 115.68 | 1999.76 |
| Total rainfall received=584.00 mm | Total rainfall received=380.24 mm | |||||

The time required to supply the required depth of irrigation water to each plot was calculated with the help of following equation:
In a well-leveled field, a border strip irrigation system was adopted to check conveyance losses and conserve application and distribution efficiencies.
21.2.4 Soil analyses of experimental sites
Soil analyses of experimental sites were determined using procedures of all three experiments and are presented in Table 21.4.
Table 21.4
Physicochemical Characteristics of Soils at Experimental Sites
| Particular | Location-I | Location-II | |||
| Soil Texture | Unit | 2003–2004 | 2004–2005 | 2003–2004 | 2004–2005 |
| Silty Clay | Silty Clay | Sandy Loam | Sandy Loam | ||
| N | % | 0.03 | 0.04 | 0.044 | 0.049 |
| P | ppm | 8 | 8.5 | 3.55 | 4.75 |
| K | ppm | 80 | 92.5 | 55 | 60 |
| Field capacity | % by volume | 23.85 | 24.24 | 15.71 | 17.97 |
| Bulk density | g/cm−3 | 1.3 | 1.35 | 1.4 | 1.38 |
| Permanent wilting point | % by volume | 11.54 | 11.85 | 7.14 | 8.33 |
| pH (1:5) | 1–14 | 8 | 8.1 | 7.7 | 8 |
| EC | dS m−1 | 4.6 | 5.2 | 1 | 1 |

21.2.5 Observations
The following observations were recorded through standard procedures:
• Crop growth rate (g m−2 day−1)
• Total leaf area duration (days)
• Net assimilation rate (g m−2 day−1)
• Weight per stripped cane (kg)
• Mean stripped cane length (m)
• Unstrapped cane yield (t ha−1)
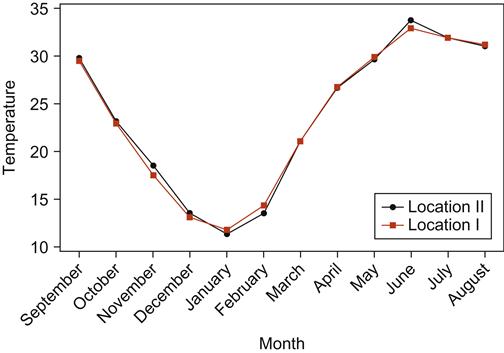
The weather data of two locations are shown in Figures 21.1–21.3.


21.2.6 Statistical analysis
The observations were recorded using standard procedures. The data were analyzed statistically using Fisher’s analysis of variance technique. A least significant difference (LSD) test at 0.05p was employed to compare the differences among the treatment means (Steel et al., 1997). In the tables of results, the test of significance is presented in the conventional way:
21.3 Results and discussion
21.3.1 Germination percentage
Germination data for 2 years were pooled for Location-I and Location-II and are presented in Table 21.5. The results showed that the effect of different ASMD levels and planting patterns were non-significant on germination percentage at both locations. All the depletion levels showed the same germination percentage, which can be attributed to the even supply of irrigation water until completion of germination. The subsequent irrigations that were applied according to soil moisture deficit levels showed the effects thereafter. Malik et al. (1992) stated that germination at various moisture regimes was found to be the same. They further revealed that for the study of the effect of different moisture regimes on the growth and development of sugarcane crop, optimum moisture should be applied until the completion of germination. Malik and Ali (1990) found slightly better germination at a closer spacing of 1.0 m than that at a wider spacing (1.5 m). They further advocated that the negative effect in wider spacing was due to more seed per unit area. Row spacing of 100 and 125 cm did not affect germination percentage (Ali et al., 1999). Interactive effects of ASMD levels and planting patterns (ASMDL×G) on germination percentage were non-significant. The same germination trend at both locations was due to similar environmental conditions of temperature and moisture during germination. Other stress aspects may be studied particularly at germination stage to quantify extent of factors (Dourado et al., 2013).
Table 21.5
Pooled Average Data of 2003–2004 and 2004–2005 Regarding Germination Percentage of Autumn Sugarcane Influenced by Different Available Soil Moisture Depletion Levels and Planting Patterns on soils of Location-II and Location-I Under Arid Conditions
| Location | Available Soil Moisture Depletion Levels (ASMDL) | Planting Patterns (G) | Means | |||
| G-60 | G-75 | G-30/90 | G-30/120 | |||
| Location-II | ASMDL1 (20%) | 47.78a | 48.00a | 48.43a | 47.16a | 47.84a |
| ASMDL2 (40%) | 48.67a | 48.78a | 50.02a | 47.73a | 48.80a | |
| ASMDL3 (60%) | 47.82a | 48.20a | 48.83a | 47.38a | 48.06a | |
| ASMDL4 (80%) | 47.54a | 47.54a | 48.00a | 47.01a | 47.52a | |
| Means | 47.95a | 48.13a | 48.82a | 47.32a | ||
| Location-I | ASMDL1 (20%) | 47.02a | 48.07a | 48.39a | 47.17a | 47.66a |
| ASMDL2 (40%) | 48.32a | 48.90a | 50.26a | 47.97a | 48.86a | |
| ASMDL3 (60%) | 48.12a | 48.17a | 49.29a | 47.67a | 48.31a | |
| ASMDL4 (80%) | 47.26a | 47.60a | 48.02a | 45.81a | 47.17a | |
| Means | 47.68a | 48.19a | 48.99a | 47.16a | ||
| Location-II | Location-I | |
| LSD0.05 ASMDL | 3.60 | 1.80 |
| LSD0.05 Planting patterns | 3.81 | 3.99 |
| LSD0.05 ASMDL×planting pattern | 7.20 | 1.80 |
| CV (%) | 22.41 | 10.52 |

Mean in the respective category does not differ significantly at 5% level of probability according to LSD test.
21.3.2 Number of shoots (m−2)
The pooled data of 2 years (Location-I and Location-II) on number of shoots m−2 is given in Table 21.6. The effects of ASMD levels and planting patterns on number of shoots m−2 were significant at both locations. Maximum number of shoots m−2 (30.19 and 34.22) were recorded at Location-II and Location-I, respectively, at the interaction of 40% ASMDL×30/90 cm and minimum of 13.31 and 13.15 were recorded by 80% ASMDL×30/120 cm. It was observed that 126.30 and 159.11% higher number of shoots m−2 at Location-II and Location-I, respectively, were recorded by the interaction of 40% ASMDL×30/90 cm compared to an 80% ASMDL×30/120 cm. This increase in number of shoots m−2 might be ascribed to the fact that optimum use of water increased nutrient availability, and the complementary effect of increased nutrient availability and improved air circulation and light interception with 40% ASMDL×30/90 cm spaced paired row strip planting pattern reduced shoot mortality. Malik et al. (1996) recorded significantly more shoots per plant at wider row spacing than at closer spacing. It was also noted that too big an increase in inter-strip spacing, as in 30/120 cm paired row strip planting pattern number of strips per plot, decreased and number of plants per unit area increased by decreasing plant-to-plant distance to maintain optimum plant population, due to inter-plant competition increasing and causing adverse effects on number of shoots m−2.
Table 21.6
Pooled Average Data of 2003–2004 and 2004–2005 Regarding Total Number of Shoots m−2 of Autumn Sugarcane Influenced by Different Available Soil Moisture Depletion Levels and Planting Patterns on soils of Location-II and Location-I Under Arid Conditions
| Location | Available Soil Moisture Depletion Levels (ASMDL) | Planting Patterns (G) | Means | |||
| G-60 | G-75 | G-30/90 | G-30/120 | |||
| Location-II | ASMDL1 (20%) | 21.76bcdef | 22.95bcdef | 25.83abcd | 16.52fg | 20.77c |
| ASMDL2 (40%) | 27.72abc | 28.61ab | 30.19a | 20.78cdef | 26.83a | |
| ASMDL3 (60%) | 24.94abcde | 26.13abcd | 27.42abc | 19.20defg | 23.42b | |
| ASMDL4 (80%) | 17.31fg | 18.10efg | 20.18defg | 13.31g | 17.23d | |
| Means | 19.93c | 22.95b | 25.91a | 17.45d | ||
| Location-I | ASMDL1 (20%) | 22.89ef | 23.99de | 27.23cd | 16.64ij | 22.69c |
| ASMDL2 (40%) | 29.73bc | 31.54ab | 34.22a | 22.65ef | 29.54a | |
| ASMDL3 (60%) | 27.22cd | 28.77bc | 29.90bc | 20.76efg | 26.66b | |
| ASMDL4 (80%) | 17.11hi | 18.32ghi | 20.38fgh | 13.15j | 17.24d | |
| Means | 24.24c | 25.66b | 27.93a | 18.3d | ||
| Location-II | Location-I | |
| LSD0.05 ASMDL | 3.6 | 1.8 |
| LSD0.05 Planting patterns | 3.8 | 3.9 |
| LSD0.05 ASMDL×planting pattern | 7.2 | 1.8 |
| CV (%) | 22.41 | 10.52 |

Mean in the respective category does not differ significantly at 5% level of probability according to LSD test.
21.3.3 Crop growth rate (g m−2 day−1)
Crop growth rate shown in Table 21.7 revealed that it was significantly dissimilar under different ASMD levels and planting patterns at both locations. The maximum CGR of 8.75 and 10.08 g m−2 day−1 was recorded at Location−II and Location-I, respectively, at 40% ASMD level. It was observed that a 25.86, 17.98, and 12.23% increase in CGR was recorded at Location-II and 35.48, 27.15, and 15.73% at Location-I with 40, 60, 20, and over 80% ASDM. The increase in CGR at 40% ASMD level might be ascribed to an increased nutrient availability which in turn improved the crop growth. Sheu et al. (1992) studied the effect of different moisture regimes on the growth rate of various sugarcane varieties and found that crop growth rate was reduced with moisture stress because of a reduction in translocation of photosynthates. Soares et al. (2004) and Wiedenfeld and Juan Enciso (2008) reported an increase in stalk growth rate with increase in water application during the grand growth period.
Table 21.7
Pooled Average Data of 2003–2004 and 2004–2005 Regarding Total Crop Growth Rate (g−2 day−1) of Autumn Sugarcane Influenced by Different Available Soil Moisture Depletion Levels and Planting Patterns on Soils of Location-II and Location-I Under Arid Conditions
| Location | Available Soil Moisture Depletion Levels (ASMDL) | Planting Patterns (G) | Means | |||
| G-60 | G-75 | G-30/90 | G-30/120 | |||
| Location-II | ASMDL1 (20%) | 7.80cdef | 8.02bcde | 8.56abc | 6.82fg | 7.80c |
| ASMDL2 (40%) | 8.91ab | 9.08a | 9.38a | 7.61cdef | 8.75a | |
| ASMDL3 (60%) | 8.39abcd | 8.62abc | 7.32ef | 7.32ef | 8.20b | |
| ASMDL4 (80%) | 6.96fg | 7.11efg | 7.50def | 6.21g | 6.95d | |
| Means | 7.92c | 8.11b | 8.58a | 6.99d | ||
| Location-I | ASMDL1 (20%) | 8.65cde | 8.90cd | 9.58bc | 7.30fg | 8.61c |
| ASMDL2 (40%) | 10.12ab | 10.51ab | 11.09a | 8.60cde | 10.08a | |
| ASMDL3 (60%) | 9.58bc | 9.92b | 10.16ab | 8.19def | 9.46b | |
| ASMDL4 (80%) | 7.41fg | 7.67ef | 8.12def | 6.56g | 7.44d | |
| Means | 8.84c | 9.15b | 9.74a | 7.66d | ||
| Location-II | Location-I | |
| LSD0.05 ASMDL | 1.13 | 0.51 |
| LSD0.05 Planting patterns | 0.55 | 0.59 |
| LSD0.05 ASMDL×planting pattern | 1.01 | 1.14 |
| CV (%) | 8.93 | 7.98 |

Mean in the respective category does not differ significantly at 5% level of probability according to LSD test.
Maximum CGR of 8.58 and 9.74 g m−2 day−1 at Location-II and Location-I, respectively, was recorded with a 30/90 cm spaced paired row strip planting pattern followed by a 75 and 60 cm spaced single row planting pattern. It was observed that an increase of 22.75, 16.02, and 13.30% and 27.15, 19.45, and 15.40% in CGR at Location-II and Location-I, respectively, was recorded with 30/90 cm paired row and 75 and 60 cm spaced single row planting patterns, respectively, compared to a 30/120 cm spaced paired row strip planting pattern. This increase in shoot dry weight with a 30/90 cm spaced paired row strip planting pattern might be due to more available space for air circulation and light interception, which increased photosynthetic efficiency and improved growth. Gill (1995) stated that a significant effect was observed on crop growth rate under various planting systems. The utmost CGR of 9.38 and 11.09 g m−2 day−1 at Location-II and Location-I, respectively, was recorded with a 40% ASMDL×30/90 cm spaced paired row strip planting pattern followed by a 40% ASMDL×75 cm, 40% ASMDL×60 cm, 40% ASMDL×30/120 cm spaced paired row strip planting pattern. The increase of 51.05 and 69.05% in CGR was recorded at Location-II and Location-I, respectively, with a 40% ASMDL×30/90 cm planting pattern compared to an 80% ASMDL×30/120 cm planting pattern. It was observed that an increase in CGR with a 40% ASMDL×30/90 cm planting pattern was due to the complementary effect of increased nutrient availability and improved air circulation and light interception, which enhanced photosynthetic efficiency.
21.3.4 Leaf area index
Leaf area index (LAI) is an indicator of the size of assimilatory surface of a crop. The analysis of 2 years of pooled data of both locations (Location-I and Location-II) regarding leaf area index given in Table 21.8 revealed that the cane LAI was significantly affected by different ASMD levels than by different planting patterns. The maximum LAI of 6.21 and 6.52 was recorded at Location-II and Location-I, respectively, at 40% ASMD level followed by 60 and 20%. It was observed that LAI increased by 55.72, 35.93, 20.55 and 71.35, 54.64, 31.61% at Location-II and Location-I, at 40, 60, 20, and 80%, respectively. Interactive effects of ASMD levels and planting patterns on LAI were also not significantly different.
Table 21.8
Pooled Average Data of 2003–2004 and 2004–2005 Regarding Maximum Leaf Area Index of Autumn Sugarcane Influenced by Different Available Soil Moisture Depletion Levels and Planting Patterns on Soils of Location-II and Location-I Under Arid Conditions
| Location | Available Soil Moisture Depletion Levels (ASMDL) | Planting Patterns (G) | Means | |||
| G-60 | G-75 | G-30/90 | G-30/120 | |||
| Location-II | ASMDL1 (20%) | 5.69a | 5.89a | 6.01a | 5.59a | 5.70c |
| ASMDL2 (40%) | 6.10a | 6.26a | 6.43a | 6.03a | 6.21a | |
| ASMDL3 (60%) | 6.01a | 6.12a | 6.33a | 5.93a | 6.00b | |
| ASMDL4 (80%) | 5.93a | 5.74a | 5.84a | 5.51a | 5.57d | |
| Means | 5.85a | 6.00a | 6.15a | 5.77a | ||
| Location-I | ASMDL1 (20%) | 5.95a | 6.22a | 6.29a | 5.85a | 5.98c |
| ASMDL2 (40%) | 6.37a | 6.66a | 6.81a | 6.24a | 6.52a | |
| ASMDL3 (60%) | 6.24a | 6.15a | 6.37a | 6.02a | 6.16b | |
| ASMDL4 (80%) | 5.87a | 6.01a | 6.12a | 5.78a | 5.80d | |
| Means | 6.06a | 6.32a | 6.43a | 5.95a | ||
| Location-II | Location-I | |
| LSD 0.05 ASMDL | 0.51 | 0.55 |
| LSD 0.05 Planting patterns | 0.58 | 0.59 |
| LSD 0.05 ASMDL×planting pattern | 1.01 | 1.08 |
| CV (%) | 11.95 | 11.47 |
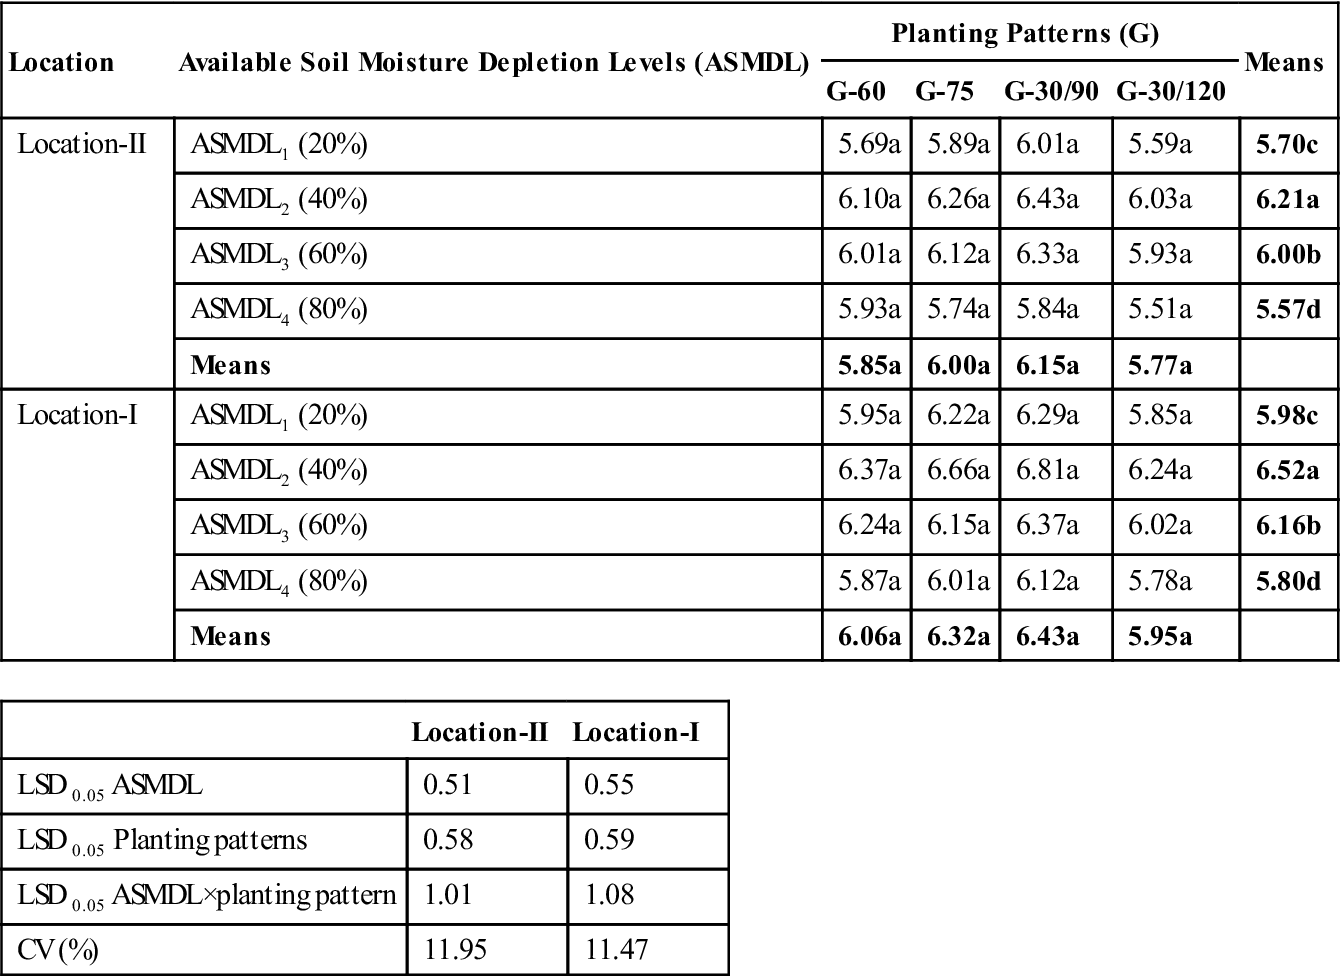
Mean in the respective category does not differ significantly at 5% level of probability according to LSD test.
21.3.5 Total leaf area duration (days)
As shown in Table 21.9, the greatest total leaf area duration (TLAD) of 847.41 and 980.92 days at Location-II and Location-I, respectively was recorded with a 40% ASMDL×30/90 cm spaced paired row strip planting pattern followed by a 40% ASMDL×75 cm, 40%×60 cm, 40%×30/120 cm planting pattern spaced. Minimum TLAD of 621.34 and 681.87days was recorded at Location-II and Location-I, respectively, in an 80% ASMDL×30/120 cm spaced paired row strip planting pattern. It was seen that a 36.38 and 43.86% increase in TLAD at Location-II and Location-I, respectively, was recorded with a 40% ASMDL×30/90 cm spaced paired row strip planting pattern compared to an 80% ASMDL×30/120 cm spaced paired row strip planting pattern. The increase in TLAD with a 40% ASMDL×30/90 cm spaced paired row strip planting pattern might be due to the complementary effect of increased nutrient availability and improved air circulation and light interception, which enhanced photosynthetic efficiency and ultimately TLAD.
Table 21.9
Pooled Average Data of 2003–2004 and 2004–2005 Regarding Total Leaf Area Duration (days) of Autumn Sugarcane Influenced by Different Available Soil Moisture Depletion Levels and Planting Patterns On Soils of Location-II and Location-I Under Arid Conditions
| Location | Available Soil Moisture Depletion Levels (ASMDL) | Planting Patterns (G) | Means | |||
| G-60 | G-75 | G-30/90 | G-30/120 | |||
| Location-II | ASMDL1 (20%) | 663.74gh | 718.38de | 738.98cd | 640.43hi | 690.38c |
| ASMDL2 (40%) | 761.16c | 803.68b | 847.41a | 744.43cd | 789.17a | |
| ASMDL3 (60%) | 740.28cd | 767.45c | 821.06ab | 719.74de | 762.13b | |
| ASMDL4 (80%) | 640.43hi | 674.19fg | 699.50ef | 621.34i | 658.87d | |
| Means | 701.40c | 740.92b | 776.74a | 681.49d | ||
| Location-I | ASMDL1 (20%) | 749.55ij | 819.42efg | 836.75de | 723.35jk | 782.27c |
| ASMDL2 (40%) | 859.02d | 938.55b | 980.92a | 824.08ef | 900.64a | |
| ASMDL3 (60%) | 800.16fg | 857.87d | 896.16c | 767.61hi | 830.45b | |
| ASMDL4 (80%) | 705.17kl | 765.05hi | 791.97gh | 681.87l | 736.01d | |
| Means | 778.48c | 845.22b | 876.45a | 749.23d | ||
| Location-II | Location-I | |
| LSD0.05 ASMDL | 15.17 | 15.27 |
| LSD0.05 Planting patterns | 15.19 | 15.25 |
| LSD0.05 ASMDL×planting pattern | 30.40 | 30.96 |
| CV (%) | 2.94 | 2.62 |

Mean in the respective category does not differ significantly at 5% level of probability according to LSD test.
21.3.6 Net assimilation rate (g m−2 day−1)
Both excessive and deficient irrigations for sugarcane crop are equally harmful. Due to frequent irrigation, soil remains continuously wet, while due to the arid climate at Location-I and Location-II, frequent wind storms in summer season caused lodging of crop during the growth period. The highest net assimilation rate (NAR) of 1.93 and 2.02 g m−2 day−1 at Location-II and Location-I, respectively, was recorded with a 40% ASMDL×30/90 cm planting pattern followed by a 40% ASMDL×75 cm, 40% ASMDL×60 cm, 40% ASMDL×30/120 cm spaced paired row strip planting pattern. NAR was minimum at 1.25 and 1.48 g−2 day−1 at Location-II and Location-I, respectively, with an 80% ASMDL×30/120 cm planting pattern. It was found that a 35.23 and 36.49% increase with a 40% ASMDL×30/90 cm planting pattern at Location-II and Location-I, respectively, was recorded compared to an 80% ASMDL×30/120 cm spaced paired row strip planting pattern. It was also observed that optimum NAR with a 40% ASMDL×G-30/90 was due to enhanced LAI, TLAD, and CGR attributes. These results are in agreement with those of Bashir (1997) and Ali (1999) who reported that planting patterns had a significant effect on NAR. The maximum NAR was recorded in pit planting system compared to the minimum from the crop sown with a 60 cm spaced single rows of sugarcane crop. It was also noted that too much of an increase in inter-strip spacing, as in a 30/120 cm spaced paired row strip planting pattern, decreased the number of strips per plot and the number of plants per unit area was increased to maintain equal plant population, due to increased inter-plant competition causing adverse effects on LAI, TLAD, and CGR (see Table 21.10).
Table 21.10
Pooled Average Data of 2003–2004 and 2004–2005 Regarding Net Assimilation Rate (g m−2 day−1) Planted Sugarcane Influenced by Different Available Soil Moisture Depletion Levels and Planting Patterns on Soils of Location-II and Location-I Under Arid Conditions
| Location | Available Soil Moisture Depletion Levels (ASMDL) | Planting Patterns (G) | Means | |||
| G-60 | G-75 | G-30/90 | G-30/120 | |||
| Location-II | ASMDL1 (20%) | 1.45efgh | 1.81abcd | 1.84abcd | 1.31gh | 1.50c |
| ASMDL2 (40%) | 1.72abcde | 1.91ab | 1.93a | 1.58cdefg | 1.79a | |
| ASMDL3 (60%) | 1.56defgh | 1.84abcd | 1.89abc | 1.40fgh | 1.57b | |
| ASMDL4 (80%) | 1.34fgh | 1.60bcdefg | 1.65abcdef | 1.25h | 1.46d | |
| Means | 1.42c | 1.69b | 1.83a | 1.29d | ||
| Location-I | ASMDL1 (20%) | 1.51de | 1.82abcd | 1.95abc | 1.51de | 1.64c |
| ASMDL2 (40%) | 1.92abc | 1.99a | 2.02a | 1.80abcd | 1.93a | |
| ASMDL3 (60%) | 1.80abcd | 1.95abc | 1.98ab | 1.66cde | 1.75b | |
| ASMDL4 (80%) | 1.59de | 1.73abcde | 1.81abcd | 1.48e | 1.55d | |
| Means | 1.65c | 1.77b | 1.94a | 1.51d | ||
| Location-II | Location-I | |
| LSD0.05 ASMDL | 0.28 | 0.30 |
| LSD0.05 Planting patterns | 0.16 | 0.19 |
| LSD0.05 ASMDL×planting pattern | 0.31 | 0.36 |
| CV (%) | 13.46 | 12.24 |

Mean in the respective category does not differ significantly at 5% level of probability according to LSD test.
21.3.7 Plant height (m)
A larger plant height of 4.07 and 4.46 m at Location-II and Location-I, respectively, was documented (Table 21.11) with a 40% AMSDL×30/90 cm planting pattern, and a minimum of 1.79 and 1.71 m at Location-II and Location-I, respectively, with interaction of 80% AMSDL×30/120 cm planting patterns. It was observed that a 127.37 and 160.82% higher plant height at Location-II and Location-I, respectively, was recorded in the interaction of a 40% AMSDL×30/90 cm planting pattern followed by 56.02 and 58.39% at Location-II and Location-I, respectively, in a 40% AMSDL×75 cm spaced planting pattern compared to the interaction of 80% AMSDL×30/120 cm planting patterns. The maximum plant height at 40%×30/90 cm planting pattern might be ascribed to better CGR. Pandian et al. (1992) concluded that cane height was taller at 1.1 IW/CPE than at 0.9 IW/CPE. Naik et al. (1993) observed the effect of moderate and severe water stress and evaluated that plant height was 117.3 and 105.7 cm at moderate and sever water stress, respectively, against control where a 148 cm plant height was found. Lal (1988) in India compared conventional planting at 90 cm row spacing with 60 cm clumps (also at 90 cm row spacing) and pit plantation (4167 pits ha−1) with up to 20 setts per pit and a row spacing of 2 m. He found that plant height increased with increase in space around the cane clumps. Domini and Plana (1989) reported that planting patterns had a significant effect on plant height. Nisachon et al. (2012) found that drought significantly reduced stalk diameter, but it did not significantly affect relative rate of height growth.
Table 21.11
Pooled Average Data of 2003–2004 and 2004–2005 Regarding Plant Height (m) of Autumn Sugarcane Influenced by Different Available Soil Moisture Depletion Levels and Planting Patterns on Soils of Location-II and Location-I Under Arid Conditions
| Location | Available Soil Moisture Depletionlevels (ASMDL) | Planting Patterns (G) | Means | |||
| G-60 | G-75 | G-30/90 | G-30/120 | |||
| Location-II | ASMDL1 (20%) | 2.93defgh | 3.09cdefg | 3.48abcde | 2.22ij | 2.93b |
| ASMDL2 (40%) | 3.73abc | 3.85ab | 4.07a | 2.80efghi | 3.61a | |
| ASMDL3 (60%) | 3.36bcdef | 3.52abcd | 2.59ghi | 2.59ghi | 3.29a | |
| ASMDL4 (80%) | 2.33hij | 2.44ghij | 2.72fghi | 1.79j | 2.32c | |
| Means | 3.09b | 3.23ab | 3.49a | 2.35c | ||
| Location-I | ASMDL1 (20%) | 2.98def | 3.13cde | 3.55bcd | 2.17gh | 2.96c |
| ASMDL2 (40%) | 3.88ab | 4.11ab | 4.46a | 2.95def | 3.85a | |
| ASMDL3 (60%) | 3.55bcd | 3.75bc | 3.75bc | 2.71efg | 3.48b | |
| ASMDL4 (80%) | 2.23gh | 2.39fgh | 2.66efg | 1.71h | 2.32c | |
| Means | 3.16b | 3.35ab | 3.64a | 2.39c | ||
| Location-II | Location-I | |
| LSD0.05 ASMDL | 0.35 | 0.39 |
| LSD0.05 Planting patterns | 0.38 | 0.37 |
| LSD0.05 ASMDL×planting pattern | 0.69 | 0.73 |
| CV (%) | 15.98 | 15.49 |
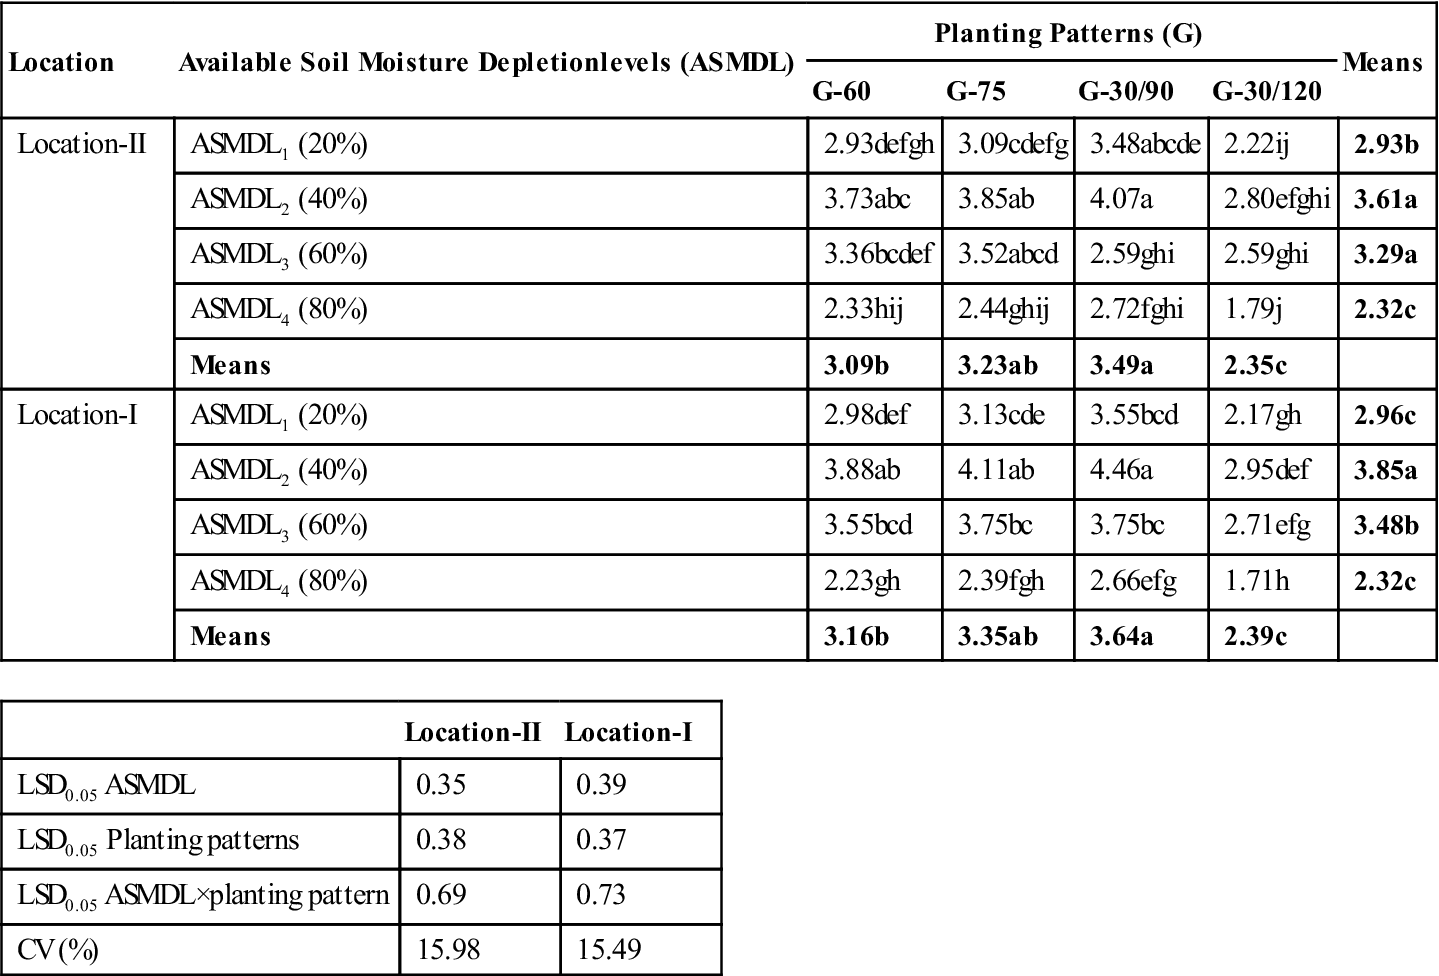
Mean in the respective category does not differ significantly at 5% level of probability according to LSD test.
21.3.8 Weight per stripped cane (kg)
The reciprocal effects of ASMD levels and planting patterns on weight per stripped cane were found significant at P=0.05 (Table 21.12). Maximum individual stripped cane weight of 0.95 and 1.22 kg at Location-II and Location-I, respectively, was recorded in the interaction of a 40% AMSDL×30/90 cm planting pattern. Minimum weight per stripped cane of 0.42 and 0.47 kg at Location-II and Location-I, respectively, was recorded with the interaction of an 80% AMSDL×30/120 cm planting pattern. It was further observed that a 126.19 and 159.57% increase in individual stripped cane weight at Location-II and Location-I, respectively, was traced by the interaction of a 40% AMSDL×30/90 cm planting pattern compared to the interaction of an 80% AMSDL×30/120 cm planting pattern.
Table 21.12
Pooled Average Data of 2003–2004 and 2004–2005 Regarding Individual Stripped Cane Weight (kg) of Autumn Sugarcane Influenced by Different Available Soil Moisture Depletion Levels and Planting Patterns on Soils of Location-II and Location-I Under Arid Conditions
| Location | Available soil moisture depletion levels (ASMDL) | Planting patterns (G) | Means | |||
| G-60 | G-75 | G-30/90 | G-30/120 | |||
| Location-II | ASMDL1 (20%) | 0.69bcdefg | 0.73abcdefg | 0.82abcde | 0.52gh | 0.69b |
| ASMDL2 (40%) | 0.88abc | 0.9ab | 0.95a | 0.66cdefg | 0.85a | |
| ASMDL3 (60%) | 0.79abcdef | 0.83abcde | 0.87abcd | 0.61efgh | 0.78ab | |
| ASMDL4 (80%) | 0.55gh | 0.57fgh | 0.64defgh | 0.42h | 0.55c | |
| Means | 0.63b | 0.76a | 0.82a | 0.50c | ||
| Location-I | ASMDL1 (20%) | 0.82defg | 0.86cdef | 0.97bcde | 0.59gh | 0.81b |
| ASMDL2 (40%) | 1.06abc | 1.13ab | 1.22 a | 0.81defg | 1.06a | |
| ASMDL3 (60%) | 0.97bcde | 1.03abcd | 1.07abc | 0.74efg | 0.95a | |
| ASMDL4 (80%) | 0.61gh | 0.65fgh | 0.73fg | 0.47h | 0.62c | |
| Means | 0.77b | 0.82a | 1.00a | 0.60c | ||
| Location-II | Location-I | |
| LSD0.05 ASMDL | 0.12 | 0.18 |
| LSD0.05 Planting patterns | 0.15 | 0.14 |
| LSD0.05 ASMDL×planting pattern | 0.23 | 0.28 |
| CV (%) | 22.77 | 18.96 |

Mean in the respective category does not differ significantly at 5% level of probability according to LSD test.
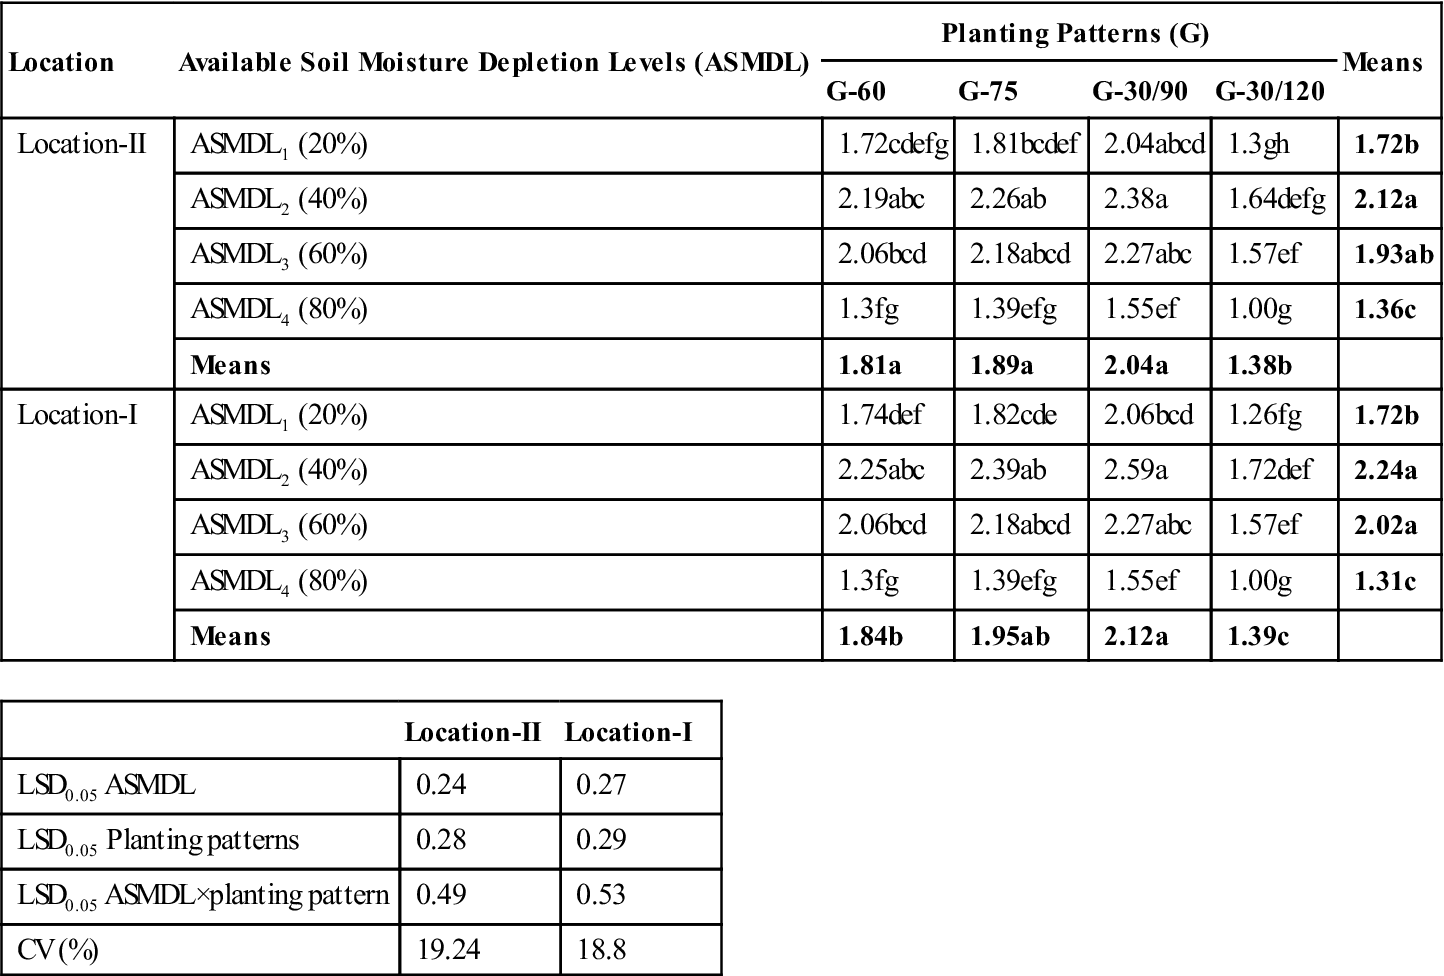
21.3.9 Stripped cane length (m)
Significant improvement was seen by mutual effects of ASMD levels and planting patterns on individual cane length (Table 21.13) at both locations and maximum individual cane length 2.38 and 2.59 m at Location-II and Location-I was recorded with a 40% AMSDL×30/90 cm planting pattern. Individual cane length was a minimum of 1.0 m at both locations with an 80% AMSDL×30/120 cm planting pattern. It was observed that a 138 and 159 % higher individual cane length at Location-II and Location-I, respectively, was achieved by a 40% AMSDL×30/90 cm planting pattern compared to an 80% AMSDL×30/120 cm planting pattern. Ingram (1986) also stated a 40 to 50% greater stalk length in 75 cm spaced rows than in 150 cm spaced rows.
Table 21.13
Pooled Average Data of 2003–2004 and 2004–2005 Regarding Mean Stripped Cane Length (m) of Autumn Sugarcane Influenced by Different Available Soil Moisture Depletion Levels and Planting Patterns on Soils of Location-II and Location-I Under Arid Conditions
| Location | Available Soil Moisture Depletion Levels (ASMDL) | Planting Patterns (G) | Means | |||
| G-60 | G-75 | G-30/90 | G-30/120 | |||
| Location-II | ASMDL1 (20%) | 1.72cdefg | 1.81bcdef | 2.04abcd | 1.3gh | 1.72b |
| ASMDL2 (40%) | 2.19abc | 2.26ab | 2.38a | 1.64defg | 2.12a | |
| ASMDL3 (60%) | 2.06bcd | 2.18abcd | 2.27abc | 1.57ef | 1.93ab | |
| ASMDL4 (80%) | 1.3fg | 1.39efg | 1.55ef | 1.00g | 1.36c | |
| Means | 1.81a | 1.89a | 2.04a | 1.38b | ||
| Location-I | ASMDL1 (20%) | 1.74def | 1.82cde | 2.06bcd | 1.26fg | 1.72b |
| ASMDL2 (40%) | 2.25abc | 2.39ab | 2.59a | 1.72def | 2.24a | |
| ASMDL3 (60%) | 2.06bcd | 2.18abcd | 2.27abc | 1.57ef | 2.02a | |
| ASMDL4 (80%) | 1.3fg | 1.39efg | 1.55ef | 1.00g | 1.31c | |
| Means | 1.84b | 1.95ab | 2.12a | 1.39c | ||
| Location-II | Location-I | |
| LSD0.05 ASMDL | 0.24 | 0.27 |
| LSD0.05 Planting patterns | 0.28 | 0.29 |
| LSD0.05 ASMDL×planting pattern | 0.49 | 0.53 |
| CV (%) | 19.24 | 18.8 |
Mean in the respective category does not differ significantly at 5% level of probability according to LSD test.
21.3.10 Cane diameter (cm)
A combination of ASMDL and planting pattern on individual cane diameter was identified by a 40% ASMDL×30/90 cm planting pattern, which resulted in individual cane diameter of 7.83 and 8.11 cm at Location-II and Location-I, respectively (Table 21.14). Lesser values of 3.46 and 3.13 cm at Location-II and Location-I, respectively, were noticed with an 80% ASMDL×30/120 cm planting pattern. An increase of up to 126.30 and 159.11% higher individual cane diameter was recorded in the interaction of a 40% ASMDL×30/90 cm planting pattern compared to an 80% ASMDL×30/120 cm planting pattern at Location-II and Location-I, respectively. Naidu and Venkataramana (1989) reported that cane girth was decreased as compared to 80% ASMD level, when the crop was subjected to water stress. Sharma and Gupta (1990) investigated the effect of different moisture regimes (0.75, 1.0, and 1.5 IW/CPE) and stated that a greater cane girth of 9.29 and 9.95 cm was obtained at 1.0 and 1.51 IW/CPE, respectively, as compared to 8.38 cm obtained from 0.75 IW/CPE.
Table 21.14
Pooled Average Data of 2003–2004 and 2004–2005 Regarding Mean Cane Diameter (cm) of Autumn Sugarcane Influenced by Different Available Soil Moisture Depletion Levels and Planting Patterns on Soils of Location-II and Location-I Under Arid Conditions
| Location | Available Soil Moisture Depletion Levels (ASMDL) | Planting patterns (G) | Means | |||
| G-60 | G-75 | G-30/90 | G-30/120 | |||
| Location-II | ASMDL1 (20%) | 5.66fg | 5.97ef | 6.70cd | 4.29i | 5.66c |
| ASMDL2 (40%) | 7.19abc | 7.42ab | 7.83a | 5.39fgh | 6.96a | |
| ASMDL3 (60%) | 6.48de | 6.78bcd | 7.11bcd | 4.98ghi | 6.34b | |
| ASMDL4 (80%) | 4.50i | 4.71hi | 5.25gh | 3.46j | 4.48d | |
| Means | 5.96b | 6.22b | 6.72a | 4.53c | ||
| Location-I | ASMDL1 (20%) | 5.44de | 5.71d | 6.46c | 3.94g | 5.39c |
| ASMDL2 (40%) | 7.05bc | 7.48ab | 8.11a | 5.38de | 7.01a | |
| ASMDL3 (60%) | 6.46c | 6.83bc | 7.09bc | 4.93ef | 6.33b | |
| ASMDL4 (80%) | 4.07g | 4.36fg | 4.85ef | 3.13h | 4.10d | |
| Means | 5.76b | 6.10b | 6.63a | 4.35c | ||
| Location-II | Location-I | |
| LSD0.05 ASMDL | 0.35 | 0.38 |
| LSD0.05 Planting patterns | 0.37 | 0.40 |
| LSD0.05 ASMDL×planting pattern | 0.69 | 0.73 |
| CV (%) | 8.29 | 8.51 |

Mean in the respective category does not differ significantly at 5% level of probability according to LSD test.
21.3.11 Unstripped cane yield (t ha−1)
Different ASMD levels exhibited different unstripped cane yield at both the locations (Table 21.15). The highest unstripped cane yield of 180.88 and 215.75 t ha−1 at Location-II and Location-I, respectively, was recorded in a 40% ASMDL followed by 60 and 20% ASMD levels. The lowest unstripped cane yield was 126 and 159.13 t ha−1 at Location-II and Location-I, respectively, in an 80% ASMD level. About 43.56, 34.92, 23.02% and 35.58, 28.83 and 12.25% higher unstripped cane yield was obtained at Location-II and Location-I in 40, 60, and 20% ASMDL over an 80% ASMD level, respectively. The increased unstripped cane yield at 40% ASMD level might be ascribed to increased nutrient availability, which resulted in greater number of stalks per square meter.
Table 21.15
Pooled Average Data of 2003–2004 and 2004–2005 Regarding Unstripped Cane Yield (t ha−1) of Autumn Sugarcane Influenced by Different Available Soil Moisture Depletion Levels and Planting Patterns on Soils of Location-II and Location-I Under Arid Conditions
| Location | Available Soil Moisture Depletion Levels (ASMDL) | Planting Patterns (G) | Means | |||
| G-60 | G-75 | G-30/90 | G-30/120 | |||
| Location-II | ASMDL1 (20%) | 157.50fg | 164.00ef | 177.50cde | 121.00j | 155.00c |
| ASMDL2 (40%) | 187.50abc | 192.50ab | 197.50a | 146.00gh | 180.88a | |
| ASMDL3 (60%) | 173.00de | 180.50bcd | 187.50abc | 144.00gh | 170.00b | |
| ASMDL4 (80%) | 127.50ij | 132.50hij | 144.00gh | 100.00k | 126.00d | |
| Means | 161.38b | 167.38b | 176.62a | 126.50c | ||
| Location-I | ASMDL1 (20%) | 182.50e | 186.50e | 205.50d | 140.00i | 178.63c |
| ASMDL2 (40%) | 221.00bc | 227.50ab | 238.00a | 176.50efg | 215.75a | |
| ASMDL3 (60%) | 210.50cd | 218.50bcd | 223.50bc | 167.50fgh | 205.00b | |
| ASMDL4 (80%) | 160.50h | 166.00gh | 181.50ef | 128.50i | 159.13d | |
| Means | 193.63b | 199.63b | 212.13a | 153.13c | ||
| Location-II | Location-I | |
| LSD0.05 ASMDL | 7.04 | 7.12 |
| LSD0.05 Planting patterns | 7.09 | 7.19 |
| LSD0.05 ASMDL×planting pattern | 14.08 | 14.15 |
| CV (%) | 6.26 | 5.21 |

Mean in the respective category does not differ significantly at 5% level of probability according to LSD test.
The highest unstripped cane yield of 176.62 and 212.13 t ha−1 at Location−II and Location-I, respectively, was recorded in 30/90 cm (G-30/90) followed by a 75 cm (G-75), 60 cm spaced single row planting pattern (G-60), and the lowest stripped cane yield of 126.50 and 153.13 t ha−1 at Location-II and Location-I, respectively, in 30/120 cm spaced paired row planting pattern (G-30/120). The increase was to the tune of 39.62, 32.32, 27.57% and 38.53, 30.37, and 26.45% at Location-II and Location-I, respectively, with G-30/90, G-75, and G-60 over G-30/120. It was observed that improvement in unstripped cane in the 30/90 cm spaced paired row planting pattern was due to accelerated CGR, more NAR, longer TLAD, and greater LAI attributes.
The ceiling of the unstripped cane yield of 197.50 and 238 t ha−1 at Location-II and Location-I, respectively, was obtained with 40% ASMDL×G-30/90 followed by 40% ASMDL×G-75 and 40% ASMDL×G-60, respectively. The minimum unstripped cane yield of 100 and 128.5 t ha−1 at Location-II and Location-I, respectively, was calculated in ASMDL4×G-30/120 treatment. It was noteworthy that 97.50 and 85.21% higher unstripped cane yield was recorded in the interaction of a 40% ASMDL×30/90 cm planting pattern compared to an 80% ASMDL×30/120 cm planting pattern at Location-II and Location-I, respectively. The optimum unstripped cane yield in 40% ASMDL×G-30/90 might be due to accelerated CGR, more NAR, longer TLAD, and greater LAI.
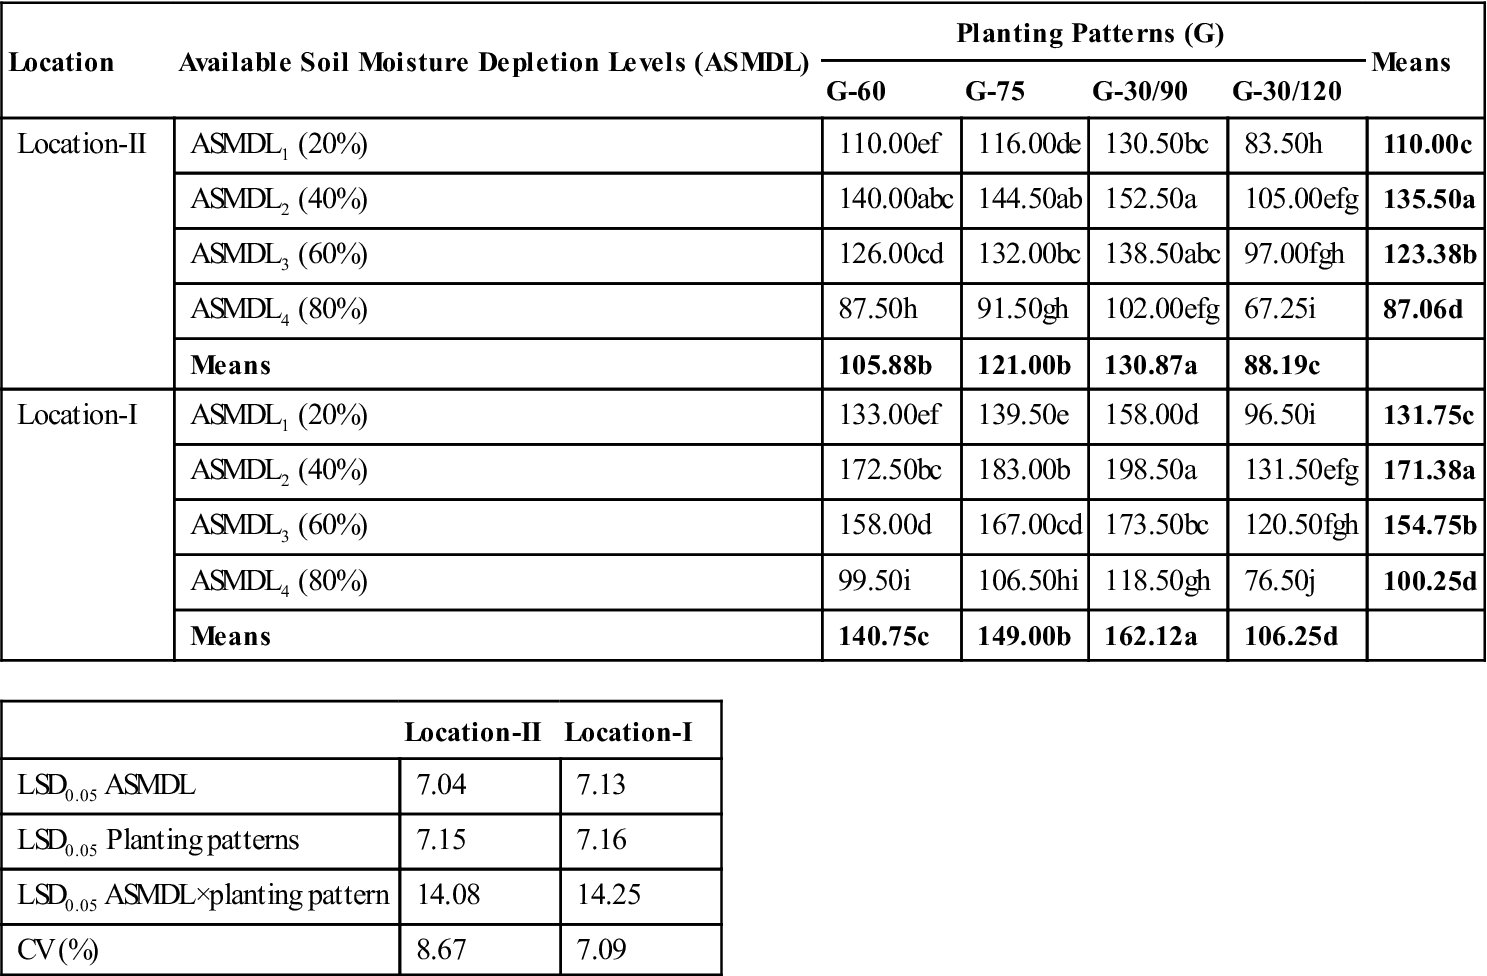
21.3.12 Stripped cane yield (t ha−1)
The challenges faced by the agricultural sector under the climate change scenarios are to provide food security for an increasing world population while protecting the environment and the functioning of its ecosystems (Rosenzweig et al., 2012). Sugarcane crop is one of those challenges. The highest stripped cane yield of 135.50 and 171.38 t ha−1at Location-II and Location-I, respectively, was taken with a 40% ASMD level followed by 60 and 20% ASMDL (Table 21.16), while the lowest cane yield of 87.06 and 100.25 t ha−1 was observed at Location-II and Location-I, respectively, with an 80% ASMD level. It was further observed that 55.64, 41.72, 26.35% at Location-II and 70.95, 54.36, and 31.42% higher stripped cane yield at Location-I, were recorded in 40, 60, and 20% ASMD levels, respectively, over an 80% ASMD level. The increased stripped cane yield at the 40% ASMD level was ascribed to greater weight per cane, cane length, and cane diameter. It was found that excess or deficient irrigation water was equally harmful for sugarcane crops in the case of irrigation at the 20% ASMD level (excess irrigation). Due to the longer intervals between successive irrigations the soil remained deficient in available soil moisture content and both of these conditions adversely affected the yield components and ultimately stripped cane yield of sugarcane crop at both locations. Similar results were also reported by Sharma and Gupta (1990), Pandian et al. (1992), Malik et al. (1992), and Ghugare et al.(1995), whereas Ali (1996) studied the effect of two moisture levels, i.e., 45% ASM (available soil moisture) and 15% ASM, and found no significant effect on cane yield at both the levels. Siddique et al. (2008) obtained the highest yield of sugarcane as well as cabbage as an inter-crop at a pan ratio of 1 with 450 mm irrigation water in addition to 176.43 mm of rainfall. Siddique et al. (2008) also reported in another study that varieties intolerant to water stress gave better response to optimum soil moisture than varieties tolerant to water stress.
Table 21.16
Pooled Average Data of 2003–2004 and 2004–2005 Regarding Stripped Cane Yield (t ha−1) of Autumn Sugarcane Influenced by Different Available Soil Moisture Depletion Levels and Planting Patterns on Soils of Location-II and Location-I Under Arid Conditions
| Location | Available Soil Moisture Depletion Levels (ASMDL) | Planting Patterns (G) | Means | |||
| G-60 | G-75 | G-30/90 | G-30/120 | |||
| Location-II | ASMDL1 (20%) | 110.00ef | 116.00de | 130.50bc | 83.50h | 110.00c |
| ASMDL2 (40%) | 140.00abc | 144.50ab | 152.50a | 105.00efg | 135.50a | |
| ASMDL3 (60%) | 126.00cd | 132.00bc | 138.50abc | 97.00fgh | 123.38b | |
| ASMDL4 (80%) | 87.50h | 91.50gh | 102.00efg | 67.25i | 87.06d | |
| Means | 105.88b | 121.00b | 130.87a | 88.19c | ||
| Location-I | ASMDL1 (20%) | 133.00ef | 139.50e | 158.00d | 96.50i | 131.75c |
| ASMDL2 (40%) | 172.50bc | 183.00b | 198.50a | 131.50efg | 171.38a | |
| ASMDL3 (60%) | 158.00d | 167.00cd | 173.50bc | 120.50fgh | 154.75b | |
| ASMDL4 (80%) | 99.50i | 106.50hi | 118.50gh | 76.50j | 100.25d | |
| Means | 140.75c | 149.00b | 162.12a | 106.25d | ||
| Location-II | Location-I | |
| LSD0.05 ASMDL | 7.04 | 7.13 |
| LSD0.05 Planting patterns | 7.15 | 7.16 |
| LSD0.05 ASMDL×planting pattern | 14.08 | 14.25 |
| CV (%) | 8.67 | 7.09 |
Mean in the respective category does not differ significantly at 5% level of probability according to LSD test.
The maximum stripped cane yield of 130.87 and 162.12 t ha−1 at Location-II and Location-I, respectively, was recorded in a 30/90 cm spaced paired row strip planting pattern, while the lowest stripped cane yield of 88.19 and 106.25 t ha−1 at Location-II and Location-I, respectively, was obtained in a 30/120 cm spaced paired row strip planting pattern. It was found that 48.40, 37.20, 20.06% as well as 52.58, 40.24, and 32.47 % higher stripped cane yield at Location-II and Location-I, respectively, was recorded in 30/90, 75, and 60 cm planting patterns over a 30/120 cm planting pattern. It was also noted that too much increase in inter-strip spacing, as in the 30/120 cm spaced paired row strip planting, decreased the number of strips per plot and the number of plants per unit area were increased (by decreasing plant-to-plant distance to maintain equal plant population in all the treatments) due to inter-plant increased competition causing adverse effects on yield components and ultimately on yield of sugarcane crop. Higher stripped cane yield in a 30/90 cm spaced paired row planting pattern was attributed to improved weight cane−1, and increased cane length, and accelerated CGR. The maximum stripped cane yield of 152.50 and 198.50 t ha−1 at Location-II and Location-I, respectively, could be seen with 40%×30/90 cm followed by 40%×75 cm, 40%×60 cm, and 40%×30/120 cm planting patterns. Minimum stripped cane yield of 67.25 and 76.50 t ha−1 at Location-II and Location-I, respectively, was entered with an 80% ASMDL×30/120 cm planting pattern. It was also observed that 126.77 and 159.48% higher stripped cane yield at Location-II and Location-I, respectively, was recorded in the interaction of a 40%×30/90 cm planting pattern compared to an 80%×30/120 cm planting pattern. Similar results were reported by El-Geddawy et al. (2002). Khan et al. (2004) reported that crop planted at an inter-row spacing of 0.72 m produced maximum stripped cane yield compared to wider inter-row spaces of 0.90 and 1.20 m. Whereas, Singh et al. (2006) reported significantly higher cane yield at 45 cm spacing followed by 60 and 75 cm in ratoon crop.
21.3.13 Harvest index percentage
The analysis of 2 years of pooled average data of Location-I and Location-II regarding harvest index (HI), shown in Table 21.17, revealed that HI was not significantly different under different ASMD levels at Location-II. Whereas at Location-I, a maximum HI of 79.08 was recorded at the 40% ASMD level, which was statistically similar to 60% ASMDL and 20% ASMDL. HI was a minimum of 62.56 at the 80% ASMD level. HI was not significantly affected by different planting patterns at Location-II. Whereas at Location-I the maximum (HI) of 75.76 was recorded in a 30/90 cm spaced paired row strip planting pattern followed by 75 and 60 cm spaced single row planting patterns. A minimum HI of 68.66 was calculated in a 30/120 cm spaced paired row strip planting pattern. The variation in HI values between the two sites might be due to the difference in local soil and climatic conditions. Interactive effects of ASMD levels and planting patterns regarding HI were not significantly different at Location-II, whereas a maximum HI of 83.38 was recorded in a 40% ASMDL×30/90 cm planting pattern followed by 40% ASMDL×75 cm, 40% ASMDL×60 cm, and 40% ASMDL×30/120 cm spaced paired row strip planting patterns, while a minimum of 59.36 at Location-I was recorded in an 80% ASMDL×30/120 cm planting pattern. The variation between HI values of the two sites might be due to the difference in soils and microclimate of both locations. A literature survey indicated straw yields of sugarcane in the range of 7.4–24.3 mg ha−1 (dry basis), and a straw-to-stalk ratio ranging from 9.7 to 29.5%. The averages were, respectively, 14.1 mg ha−1 and 18.2% (Hassuani et al., 2005).
Table 21.17
Pooled Average Data of 2003–2004 and 2004–2005 Regarding Harvest Index (%) of Autumn Sugarcane Influenced by Different Available Soil Moisture Depletion Levels and Planting Patterns on Soils of Location-II and Location-I Under Arid Conditions
| Location | Available Soil Moisture Depletion Levels (ASMDL) | Planting Patterns (G) | Means | |||
| G-60 | G-75 | G-30/90 | G-30/120 | |||
| Location-II | ASMDL1 (20%) | 69.79 | 70.67 | 72.47 | 68.99 | 70.48 |
| ASMDL2 (40%) | 74.67 | 75.06 | 77.21 | 71.90 | 74.71 | |
| ASMDL3 (60%) | 72.79 | 73.11 | 73.85 | 69.78 | 72.38 | |
| ASMDL4 (80%) | 68.63 | 68.99 | 70.83 | 67.32 | 68.943 | |
| Means | 71.47 | 71.96 | 73.59 | 69.50 | ||
| Location-I | ASMDL1 (20%) | 72.73abcde | 74.60abcd | 76.90abc | 68.93bcde | 73.29a |
| ASMDL2 (40%) | 78.04abc | 80.41ab | 83.38a | 74.47abcd | 79.08a | |
| ASMDL3 (60%) | 75.07abcd | 76.42abc | 77.68abc | 71.89abcde | 75.27a | |
| ASMDL4 (80%) | 61.79de | 63.99cde | 65.08cde | 59.36e | 62.56b | |
| Means | 71.91ab | 73.86ab | 75.76a | 68.66b | ||
| Location-II | Location-I | |
| LSD0.05 ASMDL | 7.04 | 7.11 |
| LSD0.05 Planting patterns | 4.10 | 7.16 |
| LSD0.05 ASMDL×planting pattern | 14.08 | 14.16 |
| CV (%) | 13.8 | 13.63 |

Mean in the respective category does not differ significantly at 5% level of probability according to LSD test.
21.3.14 Sugar recovery percentage
Although the quality components of sugarcane are mainly genetic characters, they are also influenced by various agronomic practices. The analysis of 2 years of pooled average data of Location-II and Location-I regarding sugar recovery percentage shown in Table 21.18 revealed that sugar recovery percentage was significantly affected by different ASMD levels at Location-I rather than at Location-II. Sugar recovery percentage was 9.60% higher at the 80% ASMD level as compared to 20% ASMDL. However, it was statistically similar in 40 and 60% ASMD levels with a minimum of 8.40% in the 20% ASMD level at Location-I. It was noted that higher sugar percentage recovery of 7.7, 4.88, and 2.71% and 14.29, 10.12, and 6.07% was recorded at Location-II and Location-I, respectively, in 80, 60, and 40% ASMD levels, respectively, over the 20% ASMD level. In India, Sharma and Gupta (1990) concluded that juice extraction was increased but juice purity, commercial cane sugar (CSS%), and sucrose content decreased drastically as moisture level increased from 0.75 to 1.5 IW/CPE. Ghugare et al. (1995) studied the effect of 50, 75, 100, and 125 CPE against canal rotation as control and found non-significant effects in sucrose content in juice as well as in purity percentage. Ali (1996) reported that irrigation applied at 15 and 45% ASM did not affect the CCS percentage.
Table 21.18
Pooled Average Data of 2003–2004 and 2004–2005 Regarding Sugar Recovery Percentage of Autumn Sugarcane Influenced by Different Available Soil Moisture Depletion Levels and Planting Patterns on Soils of Location-II and Location-I Under Arid Conditions
| Location | Available Soil Moisture Depletion Levels (ASMDL) | Planting Patterns (G) | Means | |||
| G-60 | G-75 | G-30/90 | G-30/120 | |||
| Location-II | ASMDL1 (20%) | 8.44d | 9.15bcd | 9.19bcd | 10.09abc | 9.22a |
| ASMDL2 (40%) | 8.73cd | 9.25abcd | 9.68abcd | 10.21abc | 9.47a | |
| ASMDL3 (60%) | 8.83cd | 9.45abcd | 9.92abcd | 10.48ab | 9.67a | |
| ASMDL4 (80%) | 9.16bcd | 9.62abcd | 10.16abc | 10.78a | 9.93a | |
| Means | 8.79c | 9.37bc | 9.74ab | 10.39a | ||
| Location-I | ASMDL1 (20%) | 7.28g | 8.44defg | 8.44defg | 9.45abcde | 8.40b |
| ASMDL2 (40%) | 7.80fg | 9.25abcd | 9.26bcdef | 9.99abc | 8.91ab | |
| ASMDL3 (60%) | 8.14efg | 9.03bcdef | 9.47abcde | 10.36ab | 9.25a | |
| ASMDL4 (80%) | 8.63cdefg | 9.06bcdef | 9.84abcd | 10.87a | 9.60a | |
| Means | 7.96c | 8.78b | 9.25b | 10.17a | ||
| Location-II | Location-I | |
| LSD0.05 ASMDL | 0.77 | 0.97 |
| LSD0.05 Planting patterns | 0.72 | 0.75 |
| LSD0.05 ASMDL×planting pattern | 0.53 | 0.61 |
| CV (%) | 11.88 | 11.23 |

Mean in the respective category does not differ significantly at 5% level of probability according to LSD test.
With respect to different planting patterns, the maximum sugar recovery of 10.39 and 10.17% at Location-II and Location-I, respectively, was recorded in a 30/120 cm spaced paired row strip planting pattern followed by a 30/90 and 75 cm spaced planting pattern. Minimum sugar recovery percentage of 8.79 and 7.96% at Location-II and Location-I, respectively, was observed in a 60 cm spaced planting pattern. It was noted that 18.20, 10.81, 6.60% and 27.76, 16.21, and 10.30% higher sugar recovery was recorded in 30/120, 30/90, and 75 cm spaced planting patterns over a 60 cm planting pattern. These results are in line with those of Kathirisan and Narayanasamy (1991), who reported that sugarcane grown in widely spaced rows had higher sucrose content than that grown in narrow spaced rows. On the contrary, Vains et al. (2000) reported that sucrose content in cane juice was not significantly affected by different spatial arrangements and plantation methods. Such differential impact of row spacing on sucrose content might be due to the difference in soil and climatic conditions under which the various experiments were conducted.Regarding interactive effects, the maximum sugar recovery of 10.78 and 10.87% at Location-II and Location-I, respectively, was recorded in an 80% ASMDL×30/120 cm planting pattern followed by 80% ASMDL×30/90 cm, 80% ASMDL×75 cm, and 80% ASMDL×60 cm spaced planting patterns, respectively, while a minimum of 8.44 and 7.28% at Location-II and Location-I, respectively, was recorded in a 20% ASMDL×60 cm planting pattern. It was logical that 27.73 and 49.31% higher sugar recovery percentage at Location-II and Location-I, respectively, was recorded in the interaction of an 80%×30/120 cm planting pattern compared to a 20%×60 cm planting pattern.
21.3.15 Sugar yield (t ha−1)
Sugarcane is a highly productive crop plant with the capacity of storing large amounts of sucrose (Monica et al., 2011). Sugar yield (t ha−1) is the product of stripped cane yield (t ha−1) and sugar recovery percentage. As is evident from the data given in Table 21.19, the highest sugar yield of 12.75 and 15.16 t ha−1 at Location-II and Location-I, respectively, was recorded in 40% ASMD level followed by 60 and 20% ASMD levels, while the lowest sugar yield of 8.56 and 9.53 t ha−1 at Location-II and Location-I, respectively, was recorded in 80% ASMD level. It was also observed that 48.95, 38.43, 16.82 and 59.08, 49, and 15.11% higher sugar yield at Location-II and Location-I, respectively, was recorded in 40, 60, and 20% ASMD levels, respectively, over the 80% ASMD level. The higher sugar yield at the 40% ASMD level is ascribed to higher stripped cane yield. Saini and Chakor (1992) stated that irrigated plots produced significantly higher commercial cane sugar and extraction percentage over unirrigated plots with no effects on quality parameters. Pandian et al. (1992) obtained 12.93 and 12.75 t ha−1 sugar yields at 0.9 and 1.1 IW/CPE, respectively. Ali (1996) reported that irrigation applied at 15% ASM and 45% ASM did not affect the CCS%; however, total sugar was significantly reduced at 45% ASM due to decrease in cane yield at this moisture level.
Table 21.19
Pooled Average Data of 2003–2004 and 2004–2005 Regarding Sugar Yield (t ha−1) of Autumn Sugarcane Influenced by Different Available Soil Moisture Depletion Levels and Planting Patterns on Soils of Location-II and Location-I Under Arid Conditions
| Location | Available Soil Moisture Depletion Levels (ASMDL) | Planting Patterns (G) | Means | |||
| G-60 | G-75 | G-30/90 | G-30/120 | |||
| Location-II | ASMDL1 (20%) | 9.14f | 10.53de | 11.93c | 8.40gh | 10.00c |
| ASMDL2 (40%) | 12.20c | 13.35b | 14.74a | 10.70de | 12.75a | |
| ASMDL3 (60%) | 11.07d | 12.44c | 13.72b | 10.16e | 11.85b | |
| ASMDL4 (80%) | 7.95h | 8.72fg | 10.31e | 7.25i | 8.56d | |
| Means | 10.09c | 11.26b | 12.68a | 9.13d | ||
| Location-I | ASMDL1 (20%) | 9.69h | 11.77g | 13.30e | 9.13hi | 10.97c |
| ASMDL2 (40%) | 13.45e | 15.72c | 18.36a | 13.12e | 15.16a | |
| ASMDL3 (60%) | 12.85ef | 15.04d | 16.42b | 12.47f | 14.20b | |
| ASMDL4 (80%) | 8.57ij | 9.62h | 11.63g | 8.31j | 9.53d | |
| Means | 11.14c | 13.04b | 14.93a | 10.76d | ||
| Location-II | Location-I | |
| LSD0.05 ASMDL | 0.32 | 0.38 |
| LSD0.05 Planting patterns | 0.36 | 0.35 |
| LSD0.05 ASMDL×planting pattern | 0.64 | 0.7 |
| CV (%) | 4.18 | 3.62 |

Mean in the respective category does not differ significantly at 5% level of probability according to LSD test.
Maximum sugar yield of 12.68 and 14.93 t ha−1 at Location-II and Location-I, respectively, was recorded in a 30/90 cm spaced paired row strip planting pattern. The lowest sugar yield of 9.13 and 10.76 t ha−1 at Location-II and Location-I, respectively, was obtained in a 30/120 cm spaced paired row strip planting pattern. It was found that 38.88, 23.33, 10.51 and 38.75, 21.19, and 3.53% higher sugar yield at Location-II and Location-I, respectively, was recorded in 30/90, 75, and 60 cm planting patterns over the 30/120 cm planting pattern. Higher stripped cane yield in a 30/90 cm spaced paired row planting pattern was attributed to higher stripped cane yield. Similar results were reported by El-Geddawy et al. (2002).
The maximum stripped cane yield of 14.74 and 18.36 t ha−1 at Location-II and Location-I, respectively, was recorded in the interaction of 40%×30/90 cm followed by 40%×75 cm, 40%×60 cm, and 40%×30/120 cm planting patterns. Whereas the minimum sugar yield of 7.25 and 8.31 t ha−1 at Location-II and Location-I, respectively, was recorded in an 80%×30/120 cm planting pattern. It was also observed that 102.76 and 121.20% higher sugar yield at Location-II and Location-I, respectively, was recorded in the treatments interaction of a 40% ASMDL×30/90 cm planting pattern compared to an 80% ASMDL×30/120 cm planting pattern. The increase in sugar yield in the interaction of the 40%×30/90 cm planting pattern was ascribed to complementary effects of increased nutrient availability at the 40% ASMD level and improved air circulation and light interception in the 30/90 cm paired row strip planting pattern, which resulted in higher stripped cane yield.
21.3.16 Net field benefit (Rs ha−1)
Water for irrigation is a limited resource and its effective management is critical, not only in reducing wasteful usage, but also in reducing production costs and sustaining productivity (Qureshi and Afghan, 2005). Total water requirement (cm) for sugarcane ranges from 140 to 240 cm through irrigation (Narendra, 2008). To have this amount, farmers have to resort to artificial irrigation through tubewells, therefore the demand for available water resource is fast exceeding the economic supply (Namara et al., 2007). Net field benefit (NFB) was calculated on the basis of 2-year pooled data of Location-I and Location-II (Table 21.20). Regarding ASMD levels, the crop receiving irrigation at the 40% ASMD level gave more NFB of Rs 70,917 ha−1, followed by 60 and 20% ASMD levels and the lowest NBF of Rs 25022 ha−1 in an 80% ASMDL. Sugarcane grown in different planting patterns generated different NFB. The crop grown in the 30/90 cm spaced paired row strips gave the maximum NFB of Rs 65,266 ha−1, followed by 75 and 60 cm spaced planting patterns with Rs 55,871 and Rs 45,561 ha−1, respectively, while a minimum NFB of Rs 26,241 ha−1 was obtained from the crop grown in a 30/120 cm spaced paired row strip planting pattern. Higher NFB in the 30/90 cm spaced paired row strip planting pattern was ascribed to added stripped cane yield than the other three planting patterns.
Table 21.20
Pooled Average Data of Location-II and Location-I Khan for the Years 2003–2004 and 2004–2005 Regarding Net Field Benefit (Rs ha−1) of Autumn Sugarcane Influenced by Available Soil Moisture Levels And Planting Patterns Under Arid Conditions
| Treatments | Stripped Cane Yield (ton) | Variable Cost (Rs)* | Total Cost (Rs)** | Gross Cost (Rs)*** | Gross Income (Rs) | Net Field Benefit (Rs) |
| A. N: P: K. doses (kg ha−1) | ||||||
| ASMDL1=20% | 24,175 | 26,025 | 53,238 | 79,263 | 120,875 | 41,612 |
| ASMDL2=40% | 30,688 | 31,800 | 50,723 | 82,523 | 153,440 | 70,917 |
| ASMDL3=60% | 27,813 | 29,200 | 49,473 | 78,673 | 139,065 | 60,392 |
| ASMDL4=80% | 18,731 | 20,750 | 47,883 | 68,633 | 93,655 | 25,022 |
| Planting patterns (G) | ||||||
| G-60=60 cm | 24,663 | 27,425 | 50,329.3 | 77,754.3 | 123,315 | 45,561 |
| G-75=75 cm | 27,000 | 28,800 | 50,329.3 | 79,129.3 | 135,000 | 55,871 |
| G-30/90=30/90 cm | 29,299 | 30,900 | 50,329.3 | 81,229.3 | 146,495 | 65,266 |
| G-30/120=30/120 cm | 19,444 | 20,650 | 50,329.3 | 70,979.3 | 97,220 | 26,241 |
| (ASMDL×G) | ||||||
| ASMDL1×G-60 | 24,300 | 26,800 | 53,238 | 80,038 | 121,500 | 41,462 |
| ASMDL1×G-75 | 25,550 | 28,100 | 53,238 | 81,338 | 127,750 | 46,412 |
| ASMDL1×G-30/90 | 28,850 | 30,200 | 53,238 | 83,438 | 144,250 | 60,812 |
| ASMDL1×G-30/120 | 18,000 | 19,000 | 53,238 | 72,238 | 90,000 | 17,762 |
| ASMDL2×G-60 | 31,250 | 32,200 | 50,723 | 82,923 | 156,250 | 73,327 |
| ASMDL2×G-75 | 32,750 | 33,800 | 50,723 | 84,523 | 163,750 | 79,227 |
| ASMDL2×G-30/90 | 35,100 | 36,200 | 50,723 | 86,923 | 175,500 | 88,577 |
| ASMDL2×G-30/120 | 23,650 | 25,000 | 50,723 | 75,723 | 118,250 | 42,527 |
| ASMDL3×G-60 | 28,400 | 30,000 | 49,473 | 79,473 | 142,000 | 62,527 |
| ASMDL3×G-75 | 29,900 | 31,400 | 49,473 | 80,873 | 149,500 | 68,627 |
| ASMDL3×G-30/90 | 31,200 | 32,400 | 49,473 | 81,873 | 156,000 | 74,127 |
| ASMDL3×G-30/120 | 2,750 | 23,000 | 49,473 | 72,473 | 108,750 | 36,277 |
| ASMDL4×G-60 | 18,700 | 20,700 | 47,883 | 68,583 | 93,500 | 24,917 |
| ASMDL4×G-75 | 19,800 | 21,900 | 47,883 | 69,783 | 99,000 | 29,217 |
| ASMDL4×G-30/90 | 22,050 | 24,800 | 47,883 | 72,683 | 110,250 | 37,567 |
| ASMDL4×G-30/120 | 14,375 | 15,600 | 47,883 | 63,483 | 71,875 | 8,392 |

Govt. rate of stripped cane for the years 2003–2004 and 2004–2005 was Rs 1000 per 1000 kg.
Gross income (stripped cane yield in tons × rate of one tone of stripped cane).
*Variable cost (output cost) is the cost of harvesting stripping loading and carriage of crop at the rate of Rs 200 per ton.
**Total cost is the cost incurred on purchase of inputs and cultural operations (input cost).
***Gross cost is the sum of variable cost and total cost (input cost+output cost).
Different treatment combinations resulted in different NFB. The combination of 40%×30/90 cm planting pattern gave the maximum NFB of Rs 88,577, followed by 40%×G-75, 60%×G-30/90, 40%×G-60, with NFB of Rs 79,277, 74,127, and 73,327 ha−1, respectively, against the minimum of Rs 8392 ha−1 with 80%×G-30/120 combination.
21.4 Conclusion and future prospects
It was concluded that maximum sugar yield was obtained from autumn sugarcane by irrigating it at 40% ASMD level and planting it at 30/90 cm spaced paired row strips. Thus, 10 and 24% irrigation water was saved on sandy loam and silty clay soils, respectively, as compared to the traditional method of irrigating autumn sugarcane crop through flooding.
In developing countries like Pakistan and others, more determined effort is needed to bridge the gap between science and the application of this knowledge for sugarcane on the farm in view of decreasing surface water resources augmented with high growth population rate. We need to develop simple and practicable monitoring tools and engage irrigators in a process of adaptive learning for the promotion of existing technologies related to direct measurement of volumetric soil–water content coupled with advances in remote data access through the internet or via cellular networks.