
CHAPTER ELEVEN
Capital—Risk, Regulation and Adequacy
CHAPTER STRUCTURE
Section II Risk-Based Capital Standards—Regulatory Capital (Basel norms)
Section III Application of Capital Adequacy to Banks in India
Section IV Illustrative Problems on Calculating Capital Adequacy
Suggestions for Further Reading
Annexures I, II (Case study), III, IV
KEY TAKEAWAYS FROM THE CHAPTER
- Understand why capital is so important for banks.
- Know what constitutes bank capital.
- Analyse what bank capital should be related to, if ‘safety’ of bank is to be ensured.
- Understand the difference between accounting capital, economic capital and regulatory capital.
- Learn to measure capital adequacy-Basel norms.
- Learn how Basel norms are applied in India.
SECTION I
BASIC CONCEPTS
Why Regulate Bank Capital?
Banking is undoubtedly one of the most regulated industries globally and the rules governing bank capital are one of the most prominent aspects of such regulation. Why should this be so?
There are two typical justifications presented for regulating banks—the risk of a systemic crisis and the inability of depositors (who are the primary creditors) to monitor banks. Bank failures1 are often triggered by the inability of banks to honour repayment commitments to their creditors on time. Modigliani and Miller, in their seminal work of 1958, contended that in perfect frictionless markets with full information, the value of a firm is independent of its capital structure. Most research on firms’ capital structure thereafter has studied the implications of deviations from the ‘perfect’. Taxes, financial distress, transaction costs, agency costs and asymmetric information are the important ‘imperfections’ considered to explain a firm’s capital structure. In the case of banks, research has added two other factors—banks’ access to the safety net, in particular, deposit insurance and the fact that most of the bank debt originates from small, generally uninformed depositors.1
In the traditional corporate finance view, capital reduces risk of failure by providing protection against unexpected losses (ULs). This is applicable to non-financial firms with relatively low financial leverage and reliance on long-term debt. Is the same argument applicable to financial intermediaries as well?
Consider the balance sheets of the two hypothetical firms in Table 11.1. One is a manufacturing firm and the other, a bank.2
TABLE 11.1 BALANCE SHEET OF TWO HYPOTHETICAL FIRMS

The following are the striking contrasts:
- The manufacturing firm has 60 per cent current assets and 40 per cent fixed assets. The bank has 77 per cent current assets and 3 per cent fixed assets.
- The manufacturing firm has a current ratio of 2, while the bank’s current ratio is less than 1.
- The manufacturing firm finances its assets with 60 per cent debt and 40 per cent equity. The bank finances its assets with 90 per cent debt and 10 per cent equity.
- The manufacturing firm can tolerate a 40 per cent fall in the value of its assets before its equity value is reduced to zero. It would take a mere 10 per cent fall in asset values for the bank to default on its liabilities.
- Therefore, the higher the capital, the higher the number of problem assets that can default before the capital is fully depleted.
Then why are banks permitted to operate with much more financial risk than manufacturing firms? Is it because banks, with low fixed assets, exhibit low operating leverage? However, market values of bank assets are more volatile than those of the typical manufacturing firm. Interest rate changes, borrower defaults or force majeure happenings can trigger changes in market values of bank assets, which are essentially financial assets. Though, theoretically, financial assets are more liquid and less risky than real assets (that manufacturing companies hold), in practice, these very assets could turn illiquid due to a variety of influencing factors.
We have seen in earlier chapters that bank liabilities and assets vary greatly by tenor, rate and composition. The assets bear the credit risk (borrower default), market risk (interest rate fluctuations) and the operational risks (failure of internal systems or people). Any one or a combination of these risks or an unanticipated disastrous event (force majeure risk) could result in eroding the value of banking assets.
On the other hand, the bank needs liquidity to pay off its creditors in accordance with the various contracts it has entered into at various points in time. This liquidity will have to primarily come from the periodic liquidation of assets (e.g., repayments, interest payments and sale of securities). If the assets start losing value, since assets = liability + equity, the bank would have to turn to its capital to keep up its liability commitments. If the capital is not augmented with fresh infusion of funds, the bank would run out of cash and face the most serious risk of all—liquidity and hence, solvency risk.
Diagrams 11.1 and 11.2 depict the relationship between asset value (cash flows) and the bank’s solvency. In the first, book values of liabilities and assets are matched. However, in the second case, the market value of assets erodes and the bank faces a solvency risk.
DIAGRAM 11.1 BOOK VALUE BALANCE SHEET OF A BANK – ASSETS AND LIABILITIES MATCHED

DIAGRAM 11.2 MARKET VALUE BALANCE SHEET OF A BANK – ASSET VALUE ERODES AND EQUITY USED TO MEET PART OF LIABILITIES
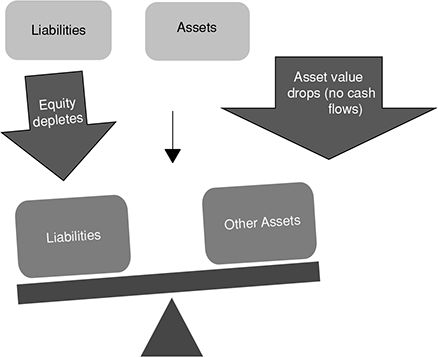
Thus, the greater the bank’s capital funds, the greater the amount of assets that can default before the bank becomes technically insolvent and lower the bank’s risk.
Apart from the vital function of absorbing losses as described above, which also ensures the long-term solvency of the bank, capital for a bank also serves other functions.
When a bank has adequate capital, it has ready access to the financial markets, since investors look upon it as a safe investment option. The bank can enter new businesses and can indulge in risk taking to boost earnings potential.
Thus, regulating the amount of capital that a bank should hold, though seen to constrain growth to some extent, is aimed at reducing the risk of banks expanding beyond their ability or taking undue risks.
To What Should Capital be Linked to Ensure Bank Safety?
How much capital is adequate? The debate goes on.
Take the hypothetical example given above. Let us assume that both the manufacturing firm and the banking firm have a return of 1 on their assets (ROA = 1). Which of the firms will have a higher return on equity (ROE)? Going by our analysis in the earlier chapter on ‘bank financial statements’, the ROE equals the product of the ROA and the equity multiplier (EM). The two firms’ Equity multiplier are 2.5 (for the manufacturing firm) and 10 (for the banking firm), respectively. This implies that the bank’s ROE is four times that of the manufacturing firm or that the latter should be able to flog its assets to produce an ROA, which is four times larger than what it is now!
What has contributed to this difference in the ROE? Financial leverage. Higher leverage improves profitability when earnings are positive.
More capital may ensure safety and stability, but may reduce profitability. Hence, bankers may prefer to operate with less capital.
Here lies the catch. What happens when the bank has risky or low quality assets whose earnings are being eroded either due to market factors or defaults? If the ROA slips to a negative slot, the bank’s profits slide tenfold! This implies that only low risk firms should have high financial leverage.
However, financial risk is inherent to banking business, quite incomparable with the traditional manufacturing firms. Hence, the inference becomes quite clear. Only if banks have low-risk assets can they remain safe. In practice; however, banking assets are risky.
Therefore, banks should increase capital relative to the risks of the assets they hold.
In this connection, please recall the discussion in the chapter on Bank financial statements, where the implication of the inverse of the equity multiplier (Assets/Equity) was mentioned. The inverse, Equity/Assets, indicates the number of assets that can default before the equity of the bank is entirely eroded. The better the quality of assets, therefore, the more safe is the bank. In other words, when the bank’s assets have low risk, the bank’s capital, and hence the bank’s solvency, is intact.
The Concept of Economic Capital3
If banks have to increase capital relative to the risk of the assets they hold, how should we determine how much capital would be adequate or required by banks to run the business, stay viable and survive?
We have seen that the risk associated with banking services depends on the type of service, that ‘risk’ is inherent in banking business and banks cannot survive by merely avoiding risk. Table 11.2 provides an overview of the risks that banks face in various facets of their operations.
Since ‘risk’ is statistically defined as the adverse deviation of actual results from expected results, the likelihood of potential adverse outcomes can be modelled using mathematical/statistical techniques. The capital that is estimated to cover the probabilistic assessment of potential future losses is called ‘Economic Capital’ and logically, banks themselves would be in a position to assess the amount of capital they require to absorb potential losses associated with all the risks they face. This estimate of capital is bound to be different from the traditional accounting capital measure that appears on banks’ balance sheets. While the accounting capital represents book values, economic capital can be considered a forward looking measure of adequacy of capital to cover banking risks.
Thus, ‘Economic Capital’ can be defined as the amount of capital considered necessary by banks to absorb potential losses associated with banking risks—such as credit, market, operational and other risks. In recent times, many banks have been using advanced modelling techniques that incorporate the internal allocation of economic capital considered necessary to support risks associated with individual lines of business, portfolios or banking transactions. Banks also use economic scenarios generated stochastically to model future business and risks.
Statistically, economic capital is defined as the difference between some given percentile of a loss distribution and the expected loss (EL) and can be understood as protection against unexpected future losses at a confidence level selected by the bank management. Usually the 99.9 per cent confidence level is used. We have seen from earlier chapters that selecting a high confidence level would imply lower probability of insolvency. Hence, the economic capital required would be higher for higher confidence levels (See Figure 11.1).
Maintaining economic capital at the 99.9 per cent confidence level implies that the capital is sufficient to cover all but one worst possible risk loss out of 1,000 possible risk scenarios, for a given time horizon. In other words, economic capital would cover most of the Unexpected Loss (UL) events, except catastrophic events. This possibility for ‘ULs’ necessitates holding of capital protection.
The Concept of Regulatory Capital
The widespread banking crises in the last two decades have resulted in a number of regulations to prevent such occurrences. These regulations were earlier based on the notion that banks are prone to default on their committed deposit payments because of the mismatch between the timings of the demand for withdrawals and the returns on the assets that banks create. The possibility of such a mismatch can encourage depositors to withdraw larger amounts than they would have, if such possibilities did not exist. On a large scale, such depositors’ behaviour would result in a ‘run’ on the bank. Therefore, one aspect of bank regulation is to ensure that depositors who do not need to withdraw at present are given enough assurance that they will be paid in the future. Depositors need assurance that the bank has enough (claims on) liquid assets to meet all demands made by depositors. There are four ways to provide this assurance4—adequate bank equity capital, deposit insurance, lender of last resort and subordinated debt. Lack of assurance can lead to bank failures and outcomes that are not welfare maximizing. These assurances have an economic role in providing optimal outcomes and therefore, need to be formulated with utmost care.
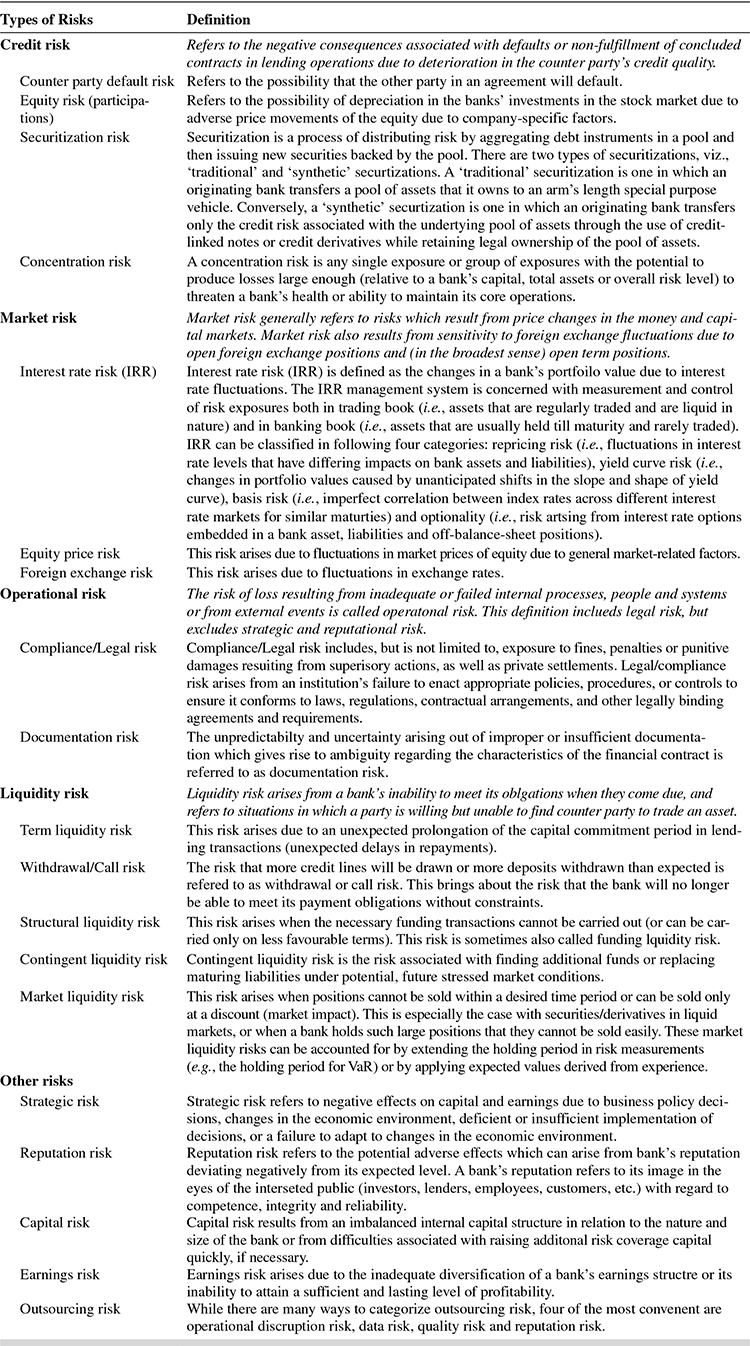
FIGURE 11.1 ECONOMIC CAPITAL AND HEDGING TECHNIQUES FOR LOSSES

Basically, both regulatory and economic capital are concerned with the bank’s financial staying power. However, regulatory capital depends on the confidence level set by the regulator and therefore, does not respond in the same manner to changes in the common variables that affect both economic and regulatory capital, such as loans’ Probability of Default (PD) and Loss Given Default (LGD). Hence, no direct relationship has been perceived between both capital levels.
The Basel Committee on Banking Supervision (BCBS) (see Section II) and the regulators however recognize that capital adequacy as determined by economic risk is imperative for the long term stability of banks. Therefore, apart from maintaining capital as stipulated by regulation, banks need to carefully assess their internal and future capital requirements based on the risks taken during the course of business.
Moreover, the two concepts reflect the needs of different stakeholders—the bank’s shareholders look to economic capital, while the depositors look to adequacy of regulatory capital.
Illustration 11.1 depicts a simple example of how regulatory and economic capital might be different.
ILLUSTRATION 11.1
Please refer to Illustration 9.1 (Chapter 9 – Managing Credit Risk – Advanced Topics)
In the measurement of credit VaR for a single loan using the Credit Migration Approach (Credit Metrics), we will compare the regulatory requirement of capital for the loan with the economic capital requirement for the same loan.
Regulatory capital specifies that (Indian norms) 9% risk weighted capital has to be maintained. Though our loan in the example is A rated, we will assume 100% risk weight for the loan. Hence, for ₹100 crore of the loan, the bank has to maintain regulatory capital of ₹9 crore.
Economic capital can be calculated as the Credit VaR either by assuming ‘normal’ distribution, or using the values in the actual distribution in the example.
- If we use normal distribution, we get the following results at 5% VaR and 1% VaR
5% VAR 1.65* ₹12.89 cr 1% VAR 2.33* ₹18.20 cr - If we use the actual distribution, we find that 5% VaR is approximated by 9.61% (adding the probabilities from the default state upwards i.e.,.009 + .007 + .002 + .044 + .072 + .827), and 1% VaR is approximated by 1.34% (add all probabilities except .827). At these values.
5% VAR 95% of actual distribution (125.63 – 126.89) ₹–1.26 crore 1% VAR 99% if actual distribution (125.63 – 125.67) ₹–0.04 crore
The VaR comes out negative in both cases, though, we can interpolate values to get to the 5% VaR level.
How do we interpret these results?
The results throw up some interesting observations, and in practice, challenges for banks when they have to maintain capital commensurate with the asset risk.
In our example of a ₹100 crore loan rated A, the bank would have to maintain ₹9 crore as capital to compensate for the credit risk in terms of the capital regulations. However, if the bank were to estimate the capital requirement based on its internal assessment of credit risk, it would have to maintain ₹18.20 crore as capital, if a normal distribution were assumed, or no capital at all, if the actual distribution were to be relied upon!
SECTION II
RISK-BASED CAPITAL STANDARDS5—REGULATORY CAPITAL
In the early 1980s, concern about international banks’ financial health increased, as did complaints of unfair competition. It was then that the BCBS began thinking in terms of setting capital standards for banks.
Box 11.1 provides an overview of the Bank for International Settlements and the Basel Committee.
BOX 11.1 THE BIS AND THE BCBS
The Bank for International Settlements (BIS)
The Bank for International Settlements, the world’s oldest international financial organization, was established in 1930 with its head office in Basel, Switzerland. It aims at fostering international monetary and financial cooperation and serves as a bank for central banks. The bank’s capital is held exclusively by 60 central banks of the world. The BIS fulfils its mandate by acting as:
- a forum for discussion and decision-making among central banks and within the international financial and supervisory community,
- a centre for economic and monetary research,
- a prime counter party for central banks in their financial transactions and
- agent or trustee in connection with international financial operations.
Sixty central banks, including the RBI, currently (as of July 2017) have rights of voting and representation at general meetings.
To maintain exclusivity as a bank for central banks around the world, the BIS does not accept deposits from or provide financial services to private individuals or corporate bodies. It is also not permitted to make advances to governments or open current accounts in the name of governments. However, it offers a wide range of financial services to central banks and other monetary authorities, such as the following:
- Management of foreign exchange reserves, a service used by 135 monetary authorities (at end of March 2009), to manage total currency deposits of SDR 197 billion, amounting to about 4 per cent of the world’s foreign currency reserves,
- Investment and asset management services for central banks, ranging from standard (such as sight/notice accounts and term deposits) to innovative, such as financial products to enable central banks to trade actively with BIS for increasing return on foreign assets, management of sovereign securities and other high grade assets and so on,
- Granting occasional collateralized short term credits to central banks and
- Acting as trustee for international government loans and performing collateral agent functions.
In order to further its objective of fostering international monetary and financial cooperation, the BIS undertakes the following activities:
- It organizes regular meetings of governors and other senior officials of central banks to enable them monitor global financial and economic developments and also discuss specific policy issues relating to monetary and financial stability.
- It hosts the secretariats of the BCBS (see below), the Committee on Payment and Settlement Systems, the Committee on the Global Financial System, the Markets Committee and several others.
- To support the meetings and the work of the committees, BIS undertakes extensive research in the economic, monetary, financial and legal areas. It also functions as a hub for sharing statistical information among central banks and for publishing statistics on global banking securities, foreign exchange and derivatives markets.
- The Financial Stability Institute has been set up by BIS to promote dissemination and implementation of robust financial sector supervisory standards.
The Basel Committee on Banking Supervision (BCBS)
The committee, established by central bank governors of the G10 countries in 1974, meets regularly four times a year. It has four main working groups, which also meet regularly.
The countries comprising the committee are represented by their central banks. The Committee reports to the governors of the central banks of the G10 countries. An important objective of the Committee is to tighten supervision of international banks towards achieving which the Committee has been working since 1975 and issuing a long series of documents. The Committee’s Secretariat is provided by the BIS in Basel. At the end of 2016, BCBS membership has expanded from the G10 to 45 institutions from 28 jurisdictions.
In 1988, the Committee introduced the bank capital measurement system popularly referred to as the Basel Capital Accord.
It should be noted that the Committee does not possess any formal supranational supervisory authority and its conclusions do not have legal force. Rather, it formulates broad supervisory standards and guidelines and recommends best practices to be customized and implemented suitably by individual authorities in various countries. In other words, the Committee encourages convergence towards common approaches and common standards.
More details of the functioning of the BIS can be accessed at www.bis.org.
The international convergence of bank capital regulation began with the 1988 Basel Accord on capital standards. The G10 countries signed the accord, which was then intended to apply to only internationally active banks. At that time, its focus was the measurement of capital and the definition of capital standards for credit risk. Since then the Accord has been amended several times, having been endorsed by the central banks of many countries and adopted by several banks across the globe. The first Basel Agreement (1988) contained some important features, which took into account the relationship between capital and the asset portfolio.
- It is directly linked by a simple formula, the capital requirement of a bank to the credit risk, determined by the bank’s asset composition. The greater the default risk of the asset portfolio, the higher the required capital.
- Recognizing the vital role of owner’s equity in capital it also prescribed, based on the risk profile of the assets, a minimum amount of equity capital.
- The capital norms were standardized across countries to ‘level the playing field’.
Over time, the Accord has been fine-tuned to account for financial innovation and some other risks it had not considered earlier.
Basel Accords II and III seek to strengthen the resilience and risk management capabilities of global banks. Basel III, the latest version of the Accord, aims at reinforcing global capital and liquidity rules, in the wake of the financial crisis of 2007–08. The salient features of the three Accords are provided in the remaining part of this Section (See Figure 11.2).
FIGURE 11.2 THE BASEL ACCORDS – TIMELINES

Demystifying the Basel Accords I, II and III
What do the successive Basel Accords really say? They do not mean anything different from what we have simplistically stated earlier about the relationship between bank capital and the risks of the assets banks carry. Therefore, the basic Basel definition of capital adequacy remains ‘Capital/Assets’, that can be now expressed as
![]() .
.
The Numerator of ‘Capital Adequacy’ Ratio We will start with the ratio ‘equity (capital)/assets’ mentioned earlier. What defines capital of a bank? Is it the book value of equity and reserves shown on the balance sheet, or is it the economic capital described in the previous section required to support risks? This is what the successive Basel Accords seek to define and measure. We know that equity capital has the last claim on the cash flows or assets of a firm. Hence, any instrument that satisfies this criterion, namely, staking the last claim on residual cash flows after all commitments are met, can be a part of bank capital. ‘Regulatory capital’ as defined by the Basel Accords adopts this approach and specifies some ‘equity like’ instruments that can be considered part of ‘capital’ of a bank. This is the numerator of the ‘capital adequacy ratio’. The ratio aims to ensure ‘adequacy of capital’ (in relation to asset risks) or simply measure ‘capital adequacy’ in regulatory terms. The successive Accords attempt to rigorously define and monitor the numerator.
The Denominator of the ‘Capital Adequacy’ Ratio Let us now look at the denominator – ‘assets’. The discussion in the preceding section has established that rather than total assets of the bank the riskiness of the assets would determine how fast the bank’s capital would be eroded, and the bank would become insolvent. Hence, the denominator of the ‘capital adequacy ratio’ is ‘risk weighted assets’. Simply, each asset on the bank’s balance sheet is assigned a ‘risk weight’ (either by the regulator or by the bank itself through its internal models). The risk weight is multiplied with the asset value to arrive at the total of risk weighted assets. Risk weights are applicable not only to assets on the balance sheet of the bank, but also to contingent liabilities of the bank, since these can become potential future liabilities for the bank. ‘Credit conversion factors’ are used to arrive at a credit equivalent of the off balance sheet items, and then multiplied by the appropriate risk weights to compute the consolidated ‘risk weighted assets’ in the denominator.
‘Risk weighted assets’ (RWAs) are an integral part of the regulatory norms since they can (a) provide a common measure for banks’ risks, (b) ensure that capital maintained by banks is commensurate with the risks; and (c) potentially highlight where destabilizing asset class bubbles are arising6.
Since banks deal with complex instruments and risks, the successive Basel Accords have been fine tuning the ‘risk weighted assets’ to consider risks of counter parties, securitizations, derivatives, foreign exchange and other market related risks. ‘Operational risks’ that impact asset value are also considered part of ‘risk weighted assets’.
How Successive Basel Accords Have Treated ‘Capital Adequacy’ Basel I and Basel II (as well as Basel 2.5) concentrated on the measurement of the riskiness of assets in the denominator and the calculation of ‘risk weighted assets’. The numerator, ‘capital’ was also defined to bring out the difference between permanent capital of the bank augmented by reserves, and other types of capital that would typically not be shown on the balance sheet as equity capital. As the Accords progressed, the various versions of the numerator, ‘capital’ and the denominator, ‘risk weighted assets’ aimed at fine tuning their definition and measurement
The manner in which the various versions have dealt with the concept is shown in Figure 11.3
FIGURE 11.3 EVOLUTION OF THE CAPITAL ADEQUACY RATIO OVER THE BASEL ACCORDS
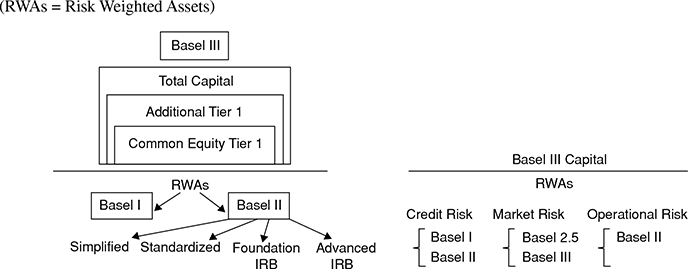
It can be understood from the Figure 11.3 that in Basel III, the focus is on the definition and composition of the numerator, ‘capital’, and the denominator ‘risk weighted assets’ is largely being carried over from the previous approaches.
Basel I, II and III are briefly described in the remaining portion of this section.
Basel Accord I
The 1988 Basel Accord required internationally active banks in G10 countries to hold capital equal to at least 8 per cent of a basket of assets measured in accordance with their risk profiles. The definition of ‘capital’ is broadly set in two tiers—Tier 1 being shareholders’ equity and retained earnings and Tier 2 being the additional internal and external sources available to the bank. The bank has to hold at least half of its measured capital in Tier 1 form.
A portfolio approach is taken to measure risk, with assets classified into four discrete buckets—10 per cent, 20 per cent, 50 per cent and 100 per cent—according to the quality of the assets. This means that some assets have no capital requirements, being considered riskless, while others have risk-weights attached to them. The two principal objectives of the Accord were: (a) to ensure an adequate level of capital in the international banking system and (b) to create a ‘more level playing field’ in competitive terms so that banks could no longer build business volumes without adequate capital backing.
The Accord was adopted as a world standard in the 1990s, with more than 100 countries applying the Basel framework to their banking systems.
However, the drawbacks in the framework were as listed below.
- The regulatory measures were seen to be in conflict with increasingly sophisticated internal measures of economic capital.
- The simple bucket approach with a flat 8 per cent charge for claims on the private sector resulted in banks moving high quality assets off their balance sheets, thus reducing the average asset quality.
- The Accord did not sufficiently recognize credit risk mitigation techniques.
When the Accord was introduced in 1988, its very design was questioned since the capital ratios appeared to lack economic foundation, the risk-weights did not reflect the risk of the borrower, and it did not account for any benefits from diversification of the asset portfolio. Growing experience and research prompted development of various alternatives to the Accord’s ‘buckets’ framework for setting capital standards.
Basel Accord II
It was recognized that the ‘one-size-fits-all’ framework of the Basel I Accord had to be upgraded, since each bank had its own unique way of measuring, mitigating and managing risks. The revised framework hence provides a spectrum of approaches ranging from simple to advanced for measurement of credit risks, market risks and operational risks, all of which could lead to asset quality and value deterioration. The framework also builds in incentives for better and more accurate risk management by individual banks.
The new Accord aims at a framework, which will maintain the overall ‘safety’ level of capital in banks through more comprehensive and risk sensitive approaches. It is less prescriptive than its predecessor and offers a range of approaches for banks capable of scaling up to more risk sensitive methodologies.
Structure of the New Accord The new Accord is based on three mutually reinforcing ‘pillars’, which together are expected to contribute to the safety and soundness of the international financial system (see Figure 11.4).
First pillar—Minimum capital requirement: The minimum capital requirement will now take into account market risks and operational risks, along with credit risks. It also proposes differentiated approaches to measurement of capital from basic to advanced.
- Capital for credit risk
- Standardized approach
- Internal ratings based approach—Foundation and advanced
- Securitization framework
- Capital for market risk
- Standardized approach (maturity method)
- Standardized approach (duration method)
- Internal models method
- Capital for operational risk
- Basic indicator approach
- Standardized approach
- Advanced measurement approach (AMA)
The salient features of these three approaches to measuring ‘risk weighted assets’ are provided in the following paragraphs:
FIGURE 11.4 THE PILLARS OF BASEL II ACCORD

Credit Risk Measurement: Credit risk refers to the negative consequences associated with defaults or non fulfilment of concluded contracts in lending operations due to deterioration in the counter party’s credit quality.
- In the ‘Standardized’ approach, the risk weight depends largely on external credit ratings provided by accredited credit rating agencies. (For more details on credit rating and credit rating agencies, please refer to the Chapter ‘Uses of bank funds–the lending function’)
- In this case,
regulatory capital = 8 per cent × risk weight × notional amount.
For example, a BBB rated corporate borrower will attract 100 per cent risk weight. 8 per cent is the minimum capital that is to be maintained on the exposure to this corporate borrower. Hence, if the notional amount outstanding is ₹1000 crore, the regulatory capital to be maintained on this exposure would be 8 per cent × 100 per cent × 1000 = ₹80 crore
- In this case,
- In the Foundation—Internal Ratings based approach (F-IRB), banks would use internal estimates of Probability of Default (PD), and regulatory values for Loss Given Default (LGD) and Exposure at Default (EAD). (For more details on PD, LGD and EAD, please refer to the chapters on ‘Managing Credit Risk’)
- Banks can form their own assessment of ‘risk components’, after approval from their regulators/central banks. The risk components are—PD, LGD, EAD and M (Maturity—denoting effective maturity of every instrument).
- The second key element of the IRB framework is definition of the ‘risk weight functions’. These are the means by which risk components are transformed into risk weighted assets, the denominator of capital adequacy ratio. The risk weight functions are derived from the estimates of ‘risk components’.
- The third key element is definition of ‘minimum requirements’—the minimum standards that must be met by a bank using the IRB approach for an asset class.
- Banks moving to Advanced Internal Ratings Based approaches (advanced IRB) would use internal estimates of PD, LGD and EAD.
Market Risk Assessment: Market risk is defined as the risk of losses in on and off-balance-sheet positions arising from movements in market prices. The risks pertaining to interest rate related instruments and equitiesin the trading book, foreign exchange risk and commodities risk throughout the bank are key components of market risk.
- The standardized approaches use risk weights provided by the supervisor.
- The Internal Models Method (IMM) allows banks to use risk measures derived from their own internal risk management models. (Please also refer to some market risk measurement tools mentioned in the previous chapter).
- Basel 2.5 is a complex package of rules that imposes higher capital charges on banks for the market risks they run in their trading books, particularly credit-related products.
Operational Risk Measurement: Operational risk is defined as the risk of loss resulting from inadequate or failed internal processes, people and systems or from external events (e.g., fraud, system failures). This definition includes legal risk, but excludes strategic and reputational risk.
- Under the Basic Indicator Approach, capital is a fraction of gross income. Banks using the approach must hold capital equal to the average over the previous three years of a fixed percentage (termed α = 15 per cent) of positive annual gross income.
- In the Standardized approach, capital is computed by lines of business using fixed percentages. Banks’ activities are divided into eight business lines. Within each business line, the capital charge is calculated by multiplying gross income by a factor termed β assigned to that line of business. For example, the β factor for corporate finance is 18 per cent, for commercial banking is 15 per cent, for retail banking 12 per cent and so on.
- Advanced Measurement Approach requires banks to use statistical methods and data analytics to calculate capital. Under this approach, the regulatory capital requirement will equal the risk measure generated by the bank’s internal operational risk measurement system using quantitative and qualitative criteria.
Calculation of Capital Adequacy Under Basel II
The ‘Capital ratio’ is expressed as follows:
The minimum ratio that a bank should maintain under the given formula is 8 per cent.
Credit risk is calculated as the aggregate of risk weighted assets under each applicable asset class. In the case of Market and Operational risks, risk-weighted assets are determined by multiplying the capital requirements (termed ‘capital charge’) for both risks by 12.5 (i.e., the reciprocal of the minimum capital ratio of 8 per cent) and adding the resulting figures to the sum of risk-weighted assets for credit risk.
Comparison of Basel I and Basel II
| Basel I | Basel II | |
|---|---|---|
| Complexity | Simple | High complexity |
| Approach | Top down—supervisor determines risk weights | Bottom up—Banks/external agencies determine risk weights |
| Approach to risk | No risk sensitivity | Increased risk sensitivity |
A detailed description of the determination of Risk weighted assets under the above approaches, definition of ‘capital’ and calculating the capital requirement under Basel II and Basel 2.5, can be found in Annexure I.
Second pillar—Supervisory review process. Bank managements are expected to strengthen their internal processes to set targets for capital commensurate with the risk profile and control environment of each bank. The internal processes would be subject to more rigorous review and intervention by the country’s central bank.
Third pillar—Market discipline. This aims at bolstering market discipline through enhanced disclosure by banks. The new framework sets out disclosure requirements and recommendations in several areas, including the manner in which a bank calculates its capital adequacy and its risk assessment methods. The core set of disclosure requirements is applicable to all banks.
How do the above approaches compare with the previous Accord? It can be seen that basel has shed the buckets approach which treated all banks alike, with no incentives for safer banks to differentiate themselves from riskier ones and thus save on capital. The present approach is an improvement since the buckets are now based on risk measures rather than on types of assets. This would bring regulatory capital for each exposure into closer alignment with the risk of the underlying asset and encourage banks to adopt better risk management practices.
Basel Accord III7
Shortcomings in Basel II
Some of the flaws pointed out in the Basel II proposals were as follows:
- The main criticism against Basel I was that it had a ‘one size fits all’ and ‘risk insensitive’ approach. Basel II brought in ‘risk sensitive’ capital regulation. However, the risk sensitivity made Basel II blatantly ‘procyclical’—that is, in good times, when banks are doing well, and the market is willing to invest additional capital in banks, Basel II does not demand more capital from banks. However, in bad times, when markets run out of or are unwilling to supply additional capital, Basel II requires that banks bring in more capital to support stressed assets. The happenings during the financial crisis of 2007, where major international banks could not bring in additional capital under pressure, bear out this observation about Basel II.
- Basel II failed to promote frameworks for accurate and realistic measurement of risk. Thus, the regulations could not demand sufficient loss absorbing capital to mitigate the risks caused by changes in market dynamics. For example, the financial crisis happened when market risk models failed to factor in the real risk from complex derivative products, on the simplistic assumption that these were tradable instruments that could be sold readily in the market. Hence, banks did not adequately cover these risks with capital. Additionally, banks started converting their assets into tradable instruments (the ‘originate and distribute’ model) to minimize capital holding.
- Basel II did not explicitly address the issues of excessive leverage and liquidity risk in banks. The assumption was that risk based capital would automatically mitigate the risk of excessive leverage. However, it was excessive leverage that triggered the financial crisis. The loss of liquidity that quickly followed excessive leverage led to banks becoming insolvent. The excessive leverage-liquidity risk–solvency risk relationship was not adequately recognized by Basel II.
- Basel II also focussed on individual banks and financial institutions and failed to take into consideration the ‘contagion’ effect of failure of one large bank. The risks to the global banking system arising from the interconnectedness of large institutions was a major reason for the crisis spreading rapidly across the financial system.
- Other issues that rendered Basel II ineffective against a major crisis were
- Pillar 1 does not penalize credit concentration. Instead, the issue of credit concentration risk is embodied as part of Pillar 2. In other words, the onus of identifying and penalizing credit concentration is left to supervisory review.
- All aspects of Counter party risk were not covered and there was no provision to include certain types of specialized derivative products in the risk measurement.
- On the issue of Pro cyclicality, it was noted that banks’ risk measurements were more at a specific point in time rather than over the whole asset cycle. Also, profit recognition and compensation schemes were seen to encourage short term risk taking. The risk over the business cycle was ignored.
Annexure II to this chapter gives more viewpoints on Basel II and its role in the blame game for the financial crisis of 2007.
The Move to Basel III Basel III, as we can see from the following paragraphs, makes an effort to fix the lacunae in Basel II that came to light during the financial crisis as also to reflect other lessons of the crisis. It is also evident that Basel III does not jettison Basel II, but builds on the essence of Basel II—the link between the risk profiles and capital requirements of individual banks. In that sense, Basel III can be considered an enhancement of Basel II.
The enhancements of Basel III over Basel II are primarily in four areas: (i) augmentation in the level and quality of capital; (ii) introduction of liquidity standards; (iii) modifications in provisioning norms; and (iv) better and more comprehensive disclosures. It is noteworthy that Basel III has concentrated on capital definition (the numerator of the capital adequacy ratio), with minimal enhancements in the risk measurements ( denominator of capital adequacy ratio).
Diagram 11.3 depicts the structure of Basel III guidelines and the comparison with Basel II.
DIAGRAM 11.3 BASEL III BASIC STRUCTURE AND BROAD COMPARISON WITH BASEL III

Objectives of Basel III According to the Basel committee, the Basel III proposals have two primary objectives:
- To strengthen global capital and liquidity regulations. The goal is to promote a more resilient banking sector
- To improve the banking sector’s ability to absorb shocks arising from financial and economic stress
To achieve these objectives, the Basel III proposals have focussed on the areas of capital reform, liquidity reform and other reforms that would improve the stability of the global banking system. The key ingredients of these reforms are presented in Diagram 11.4
DIAGRAM 11.4 BASEL III – PROPOSED REFORMS TO ACHIEVE OBJECTIVES
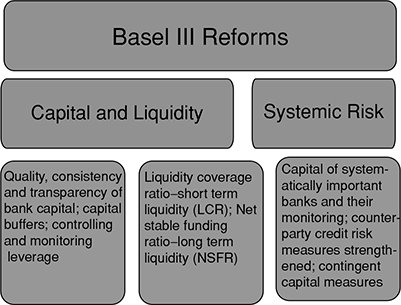
Each of the reforms are briefly discussed in the paragraphs below
Some Specific Enhancements Proposed in Basel III (Over Basel II)
- New definition of capital:
Table 11.3 distinguishes the capital requirements under Basel II and Basel III
It is not only the quantity of capital that has changed from Basel II as can be seen in the above table, but also the quality of capital required under the various categories of capital have undergone a change. Table 11.4 summarizes the key changes.
TABLE 11.4 BASEL II AND III CAPITAL REQUIREMENTS COMPARED – QUALITY OF CAPITAL

Table 11.5 shows the composition of capital items under Basel II and Basel III
TABLE 11.5 BASEL II AND III CAPITAL REQUIREMENTS COMPARED – COMPOSITION OF CAPITAL

In essence, in order to qualify, the additional Tier 1 and Tier 2 instruments in Basel III must have the following features:
- They must be more loss absorbing
- They must not contain incentives to redeem prior to their stated maturity
- They must be written off or converted to equity at the determination by the supervisory authority—that either the bank would not be viable without the write off or that a public sector capital infusion is essential .
All the above capital classes are also subject to ‘regulatory adjustments’. Some of these adjustments are listed below:
- ‘Goodwill’ or other ‘intangible assets on banks’ balance sheets have to be deducted from Common Equity Tier 1 capital
- Deferred Tax Assets (DTAs) that rely on future profitability of the bank to be realize dare to be deducted in the calculation of Common Equity Tier 1.
- Gain on sale related to securitization transactions to be deducted from Common Equity Tier 1
Other adjustments mentioned by the Basel document related to ‘cash flow hedge reserve’, ‘shortfall of stock of provisions to expected losses, ‘cumulative gains and losses due to changes in own credit risk on fair valued financial liabilities’, ‘defined benefit pension fund assets and liabilities’, ‘investments in own shares’, ‘reciprocal cross holdings in banks and other financial entities’, etc.
The essential difference between Basel II and III Tier 1 and Tier 2 capital is that:
- Under Basel II, qualifying Tier 1 and Tier 2 capital was determined on the basis of ‘gross’ instruments, before deduction of various items that could reduce the amount of capital available to withstand credit and other shocks
- Under Basel III, banks would determine available Tier 1 and Tier 2 capital only after deductions are made
- Additional requirements as part of capital—the capital conservation buffer:
As can be seen from the comparative data presented above, Basel III requires higher and better quality capital. The minimum total capital remains unchanged at 8 per cent of Risk Weighted Assets (RWA). However, Basel III introduces a capital conservation buffer of 2.5 per cent of RWA over and above the minimum capital requirement, raising the total capital requirement to 10.5 per cent against 8.0 per cent under Basel II.
This buffer is intended to ensure that banks are able to absorb losses without breaching the minimum capital requirement, and are able to carry on business even in a downturn without deleveraging. This buffer is not part of the regulatory minimum; however, the level of the buffer will determine the dividend distributed to shareholders and the bonus paid to staff.
According to the Basel committee, ‘The framework reduces the discretion of banks which have depleted their capital buffers to further reduce them through generous distributions of earnings. In doing so, the framework will strengthen their ability to withstand adverse environments’. {page 55)
Table 11.6 from the Basel document shows the minimum capital conservation ratios a bank must meet at various levels of the Common Equity Tier 1 (CET1) capital ratios, and its impact on earnings distribution of banks
TABLE 11.6 IMPACT OF CAPITAL CONSERVATION BUFFER ON BANK CAPITAL AND EARNINGS DISTRIBUTION
 Source: Basel Committee on banking supervision, Basel III: A global regulatory framework for more resilient banks and banking systems, revised version, June 2011, page 56.
Let us interpret the table. A bank with CET1 capital ratio of say 5.5 per cent is required to pay out no more than 20 per cent of its net earnings as dividends or bonus payments or share buybacks in the following financial year. In other words, the bank has to conserve 80 per cent of its earnings over the following year. The motive is obvious—to curb excessive bonus and dividend payouts by banks at the cost of its stability and solvency.
If the bank still wants to make payments in excess of the prescribed limits, the bank has the option of raising more capital to equal the amount it wants to distribute over and above the limit. The option has to be discussed with the central bank/regulator as part of the bank’s capital planning process.
- Countercyclical buffer:
The financial crisis of 2007 came in the aftermath of a period of booming credit growth. A period of downturn succeeding excessive credit growth can destabilize not only the banking system but entire economies, as was evident from the events that followed the crisis. It is therefore important that the banking sector builds up additional capital defences to safeguard the macro-financial environment.
As the name suggests, this is an additional capital buffer. It is to be maintained in the proportion of 0–5 per cent of risk weighted assets that would be imposed on banks in periods of high credit growth. The buffer requirement should be met entirely from CET1 capital.
The National regulatory authorities would set the counter cyclical buffer, with the discretion of raising the buffer beyond 2.5 per cent of RWAs. The buffer would be set by public announcement. To enable banks build the buffer, a proposed increase in the buffer would have to be announced twelve months in advance. However, decisions to decrease the buffer would take effect immediately. Buffers would apply to banks based on geographic composition of credit exposures.
The implementation of this buffer is closely linked to the capital conservation buffer (CCB) described above. The following is an extract from the Basel III document, page 60.
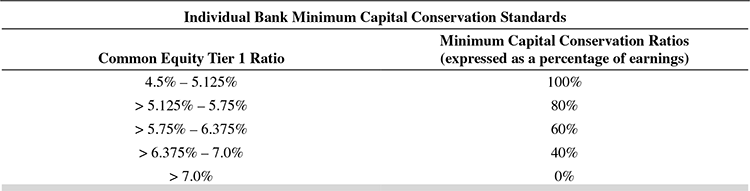
Individual Bank Minimum Capital Conservation Standards Common Equity Tier 1 (including other fully loss absorbing capital) Minimum Capital Conservation Ratios (expressed as a percentage of earnings) Within first quartile of buffer 100% Within second quartile of buffer 80% Within third quartile of buffer 60% Within fourth quartile of buffer 40% Above top of buffer 0% For illustrative purposes, the following table sets out the conservation ratios a bank must meet at various levels of common Equity Tier 1 capital if the bank is subject to a 2.5 per cent countercyclical buffer requirement.
Individual Bank Minimum Capital Conservation Standards, When a Bank is Subject to a 2.5% Countercyclical Requirement Common Equity Tier 1 (including other fully loss absorbing capital) Minimum Capital Conservation Ratios (expressed as a percentage of earnings) 4.5% – 5.75% 100% > 5.75% – 7.0% 80% > 7.0% – 8.25% 60% > 8.25% – 9.5% 40% > 9.5% 0% It is evident from the above that the capital conservation buffer and the countercyclical buffer combine to determine the required retained earnings and profit payouts of banks. If a bank breaches the buffer, the amount of profits it can distribute to shareholders and employees can be restrained.
- Leverage ratio:
The 2007 financial crisis demonstrated that banks showing strong risk based capital ratios in accordance with Basel II, could also be excessively leveraged. The build up of excessive leverage was due to both on and off balance sheet activities. The Basel Committee has therefore introduced a ‘simple, transparent, non risk based leverage ratio to act as a credible supplementary measure to the risk based capital requirements’ (page 61).
The leverage limit is set at 3 per cent. This implies that a bank’s total assets (including both on and off balance sheet assets) should not be more than 33 times the bank’s capital.
The leverage ratio is proposed to be calculated as

The ratio should be ≥3 per cent.
The leverage ratio is proposed to be calculated as the simple arithmetic mean of the monthly leverage ratios over the quarter, and is to be tested during the parallel run period of January 1, 2013 to January 1, 2017.
‘Tier 1’ capital in the numerator would include both CET1 and Additional Tier 1.
The ‘exposure’ in the denominator would follow the accounting measures for both on and off balance sheet items. While the asset values will be captured from the balance sheet, the off balance sheet items will be considered at their credit conversion factors, and derivatives with Basel II rules (of netting) and a simple measure of potential future exposure (using the Basel II framework). Hence both off balance sheet items and derivatives are converted to ‘loan equivalents’.
- Liquidity requirements:
Being ‘liquid’, or having enough cash to pay liabilities as and when they fall due and honour other commitments, is one of the most celebrated aspects of banking. This vital requirement was put to severe test during and just after the financial crisis of 2007.
Before the crisis struck, asset markets were buoyant and funding was available readily and at low cost. Liquidity conditions deteriorated rapidly as the crisis progressed, and the banking system faced severe stress. According to the Basel committee, the difficulties experienced by some banks were due to lapses in basic principles of liquidity risk management. These principles, published by BCBS (the following chapter contains a summary of these principles) in 2008, have been complemented with more stringent minimum standards for funding liquidity.
Basel III introduces a new liquidity standard through two liquidity ratios.
- The Liquidity Coverage Ratio (LCR) is designed to improve the short term resilience of the liquidity risk profile of banks. It requires banks to hold a buffer of ‘high quality’ liquid assets to match net liquidity outflows during a 30 day period of stress. In other words, the ratio shows if the bank can survive an acute stress scenario lasting for a month.

High quality liquid assets are defined by the Basel document as ‘unencumbered, liquid in markets during a time of stress and, ideally, be central bank eligible.’
The reporting frequency for the LCR should be not less than monthly. The LCR would be mandatorily reported from January 1, 2015, while the observation period starts from January 1, 2013.
A detailed description of the ratio and its components can be found in the document ‘Basel III: International framework for liquidity risk measurement, standards and monitoring’, published in December 2010, that can be accessed at www.bis.org
- The Net Stable Funding Ratio (NSFR) is designed to promote resilience in the longer term. It requires that banks fund their activities with more stable sources of funding on an ongoing basis. More specifically, assets currently being funded and any other contingent obligations that may require funding must be matched by sources of stable funding over a one year horizon

The numerator, ‘Available Stable Funding’ (ASF), is calculated using ASF factors of 100 per cent, 90 per cent, 80 per cent, 50 per cent, and 0 per cent, to reflect the stability of the funding sources, multiplied by the amount of available funding over the horizon. For example, Tier 1 capital will have an ASF factor of 100 per cent, while unsecured wholesale funding would have an ASF factor of 50 per cent.
The denominator, ‘Required Stable Funding’ (RSF), is also calculated using RSF factors ranging from 0 per cent (for example, cash) to 100 per cent (for example, loans to retail or SME customers with remaining maturity of less than one year would have an RSF factor of 85 per cent).
NSFR will be a required standard from January 1, 2018, and the reporting will be not less than quarterly.
A detailed description of the ratio and its components can be found in the document ‘Basel III: International framework for liquidity risk measurement, standards and monitoring’, published in December 2010, that can be accessed at www.bis.org
- The Liquidity Coverage Ratio (LCR) is designed to improve the short term resilience of the liquidity risk profile of banks. It requires banks to hold a buffer of ‘high quality’ liquid assets to match net liquidity outflows during a 30 day period of stress. In other words, the ratio shows if the bank can survive an acute stress scenario lasting for a month.
- Additional requirement for Systemically important financial institutions (SIFI)10:
The financial crisis of 2007 saw the fall or impairment of large, global institutions. The contagion that ensued affected global financial stability. The public sector intervention in many countries to restore financial stability imposed huge financial and economic costs, and also increased the moral hazard associated with too-big-to-fail institutions (by encouraging risky behaviour).
Basel III seeks to mitigate this externality by identifying global systemically important banks (G-SIBs) and global systemically important financial institutions (G-SIFIs), and mandating them to maintain a higher level of capital based on their importance in the global financial system. The Basel committee’s approach is based on the Financial Stability Board’s document endorsed by the G20 leaders in November 201011.
For assessing which banks should be considered as G-SIB, an indicator based measurement approach was adopted. The selected indicators reflect the size of banks, their interconnectedness, the lack of readily available substitutes or financial institution infrastructure for the services they provide, their global (crossjurisdictional) activity and their complexity. The indicator-based measurement approach would be supported by supervisory judgment based on certain principles. The BCBS also identified several ancillary indicators which can support the supervisory judgment.
The Basel Committee grouped G-SIBs into different categories of systemic importance based on the score produced by the indicator-based measurement approach. GSIBs would be initially allocated into four buckets based on their scores of systemic importance, with varying levels of additional loss absorbency requirements applied to the different buckets as set out in Table 11.7.
TABLE 11.7 MAGNITUDE OF ADDITIONAL LOSS ABSORBENCY FOR G-SIBS
 Source: BCBS, 2011, Global systemically important banks: assessment methodology and the additional loss absorbency requirement-Rules text, November 2011, page 15
The additional loss absorbency requirement is to be met with Common Equity Tier 1 (CET1) capital. The requirements are only the minimum prescribed levels of capital required. The list of G-SIBs would be reviewed annually.
These requirementsare to be phased-in in parallel with the capital conservation and countercyclical buffers, i.e., between 1 January 2016 and year end 2018, becoming fully effective on 1 January 2019.
- Enhancing risk coverage:
In addition to raising the quality and level of the capital base, the Basel Committee has taken cognisance of other material risks that could impact capital. Failure to capture major on and off-balance sheet risks, as well as derivative related exposures, was a key factor that amplified the financial crisis of 2007.Based on the lessons learned from the crisis, revised metrics have been proposed in the Basel III document.
We know that total capital requirements are calculated relative to risk weighted assets. Under Basel III, the enhanced risk coverage in relation to capital market instruments and activities, could result in an increase in risk weighted assets. Further, Basel III addressed some concerns about the reliance on external credit ratings while determining risk weights, especially after the criticism that external credit rating agencies invited for their perceived role in the financial crisis.
- Higher capital requirements for trading and securitization activities—In July 2009, the Basel Committee announced, among other things, higher capital requirements for trading and securitization activities under Basel II (also called Basel 2.5).The trading book12 reforms, among other things, introduced new risk weights to better capture risks in trading portfolios. The securitization reforms also included an increase in the risk-weighting of certain securitizations and resecuritization exposures.
- Capital requirements for certain counter party credit risk exposures—Basel III has enhanced capital requirements and risk management standards for counter party credit risk exposures arising from derivatives, repos and securities financing activities. It includes an additional capital charge for possible losses due to the deterioration in the creditworthiness of counter parties or increased risk weights on exposures to large financial institutions. The objectives were to reduce the risk of transmission of shocks between financial institutions whilst also creating incentives to move Over The Counter (OTC) derivative exposures to central counter parties and exchanges. The measures include additional capital requirements based on the following measures:
- Effective Expected Positive Exposure (EEPE), through the use of stressed inputs
- Credit Value Adjustment (CVA), that accounts for mark to market losses due to deterioration in the creditworthiness of counter parties
- Specific ‘wrong way risk’ if future exposures to a specific counter party is highly positively correlated with the counter party’s probability of default
- External credit ratings in the Basel III framework—Basel III has incorporated elements of the International Organization of Securities Commissions’ (IOSCO) Code of Fundamentals for Credit Rating Agencies that requires banks to carry out internal assessments of externally rated securitization exposures.
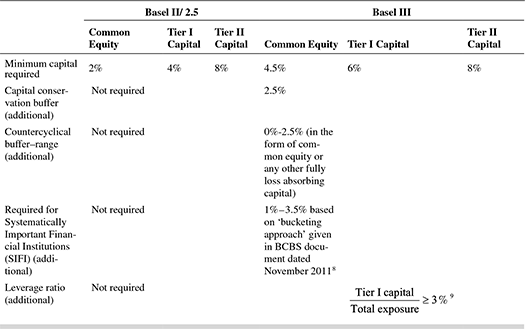
Table 11.8 shows the phase in arrangements for banks to completely adopt Basel III
TABLE 11.8 TIMELINES FOR MIGRATION TO BASEL III

Annexure I provides an overview of the determination of risk weighted assets under existing select approaches of the Basel norms. The revisions to these approaches and standards are being briefly described in the paragraphs given below.
Annexure II to this chapter is a case study on why Basel II Accord takes a share of the blame for the financial crisis of 2007.
BASEL IV –OR IS IT BASEL 3.5? MOVE TO MORE REGULATORY APPROACHES TO RISK MEASUREMENT
We have seen that Basel III focuses on enhancing the stability of the financial system by increasing both the quantity and quality of regulatory capital, and liquidity. Figure 11.3 shows the evolution of Basel regulations, in which Basel III has addressed strengthening of bank capital, the numerator of the Capital Adequacy ratio. Basel III did not make many changes in the denominator of the ratio, which comprise the Risk Weighted Assets (RWA).
After Basel III went into effect, the BCBS began revisiting the transparency and consistency in risk measurements across approaches, jurisdictions and banks. The proposals and consultative documents that have been issued since 2014, are being termed as a move to ‘Basel IV’.
The series of regulatory measures proposed are as follows. It is noteworthy that all the measures are aimed at reinforcing the measurement of RWA – the denominator of the Capital Adequacy Ratio – which essentially comprises of Credit Risk, Market Risk and Operational Risk.
1. Market Risk Requirements – Fundamental Review Of Trading Book (FRTB)*
In the previous chapter we had learnt the salient features of the treatment of market risk in the above mentioned documents.
The key features of the revised framework include the following:
- A revised boundary between the trading book and banking book.
- A revised internal models approach for market risk.
- A revised standardised approach for market risk.
- A shift from value-at-risk to an expected shortfall measure of risk under stress.
- Incorporation of the risk of market illiquidity.
The revised framework comes into effect from January 2019, with banks reporting from the end of 2019. There are significant changes compared with the post crisis Basel 2.5 market risk requirements. Some examples are given below.
Trading book requirements (see end note 12 for a brief description of trading and banking books). There has been a substantial tightening in the banking book/ trading book boundary with the objective of reducing the scope of regulatory arbitrage, such as constraints on the movement of instruments across books, and a fixed addition to capital required if such movements caused any reduction in capital to the bank. The rules also specify that certain instruments should be assigned to the banking book, such as unlisted equities, real estate holdings, instruments being intended for securitization, retail and SME credit.
Internal models for market risk measurement: Banks wishing to use internal models have to go through a number of steps, such as (a) qualitative and quantitative assessment of the model by the supervisor; (b) post approval nomination of specific trading desks that fall within the ambit of the model (those trading desks out of the scope of the model that will have to calculate capital requirements using the revised standardized approach); (c) where internal models are approved, demonstration of existence of sufficient real data points; (d) approved models can use the Expected Shortfall (ES) to estimate capital risk charge, along with an additional default risk charge add on. Models not passing the test at any step, would use the standardized approach. The capital multiplier applicable to the internal model is 1.5, which will be applied to the ES component.
Revised standardized approach: The revised standardized approach is complex, requiring calculation of risk sensitivities. Additionally, the approach specifies inclusion of a standardized default charge (as for credit risk), and a residual risk add-on to capture other risks.
In most cases, it is expected that the capital requirement for market risk will increase due to the revised rules.
2. Counterparty Credit Risk
The Standardized approach for Counterparty credit risk was published in March 2-14.13
Counterparty credit risk (CCR) is the risk associated with uncertain future exposure on derivatives and repo like transactions. Basel III had introduced a Credit Valuation Adjustment (CVA) charge (the concept of CVA has been briefly described in the chapter on Credit Risk). The Basel III requirements have been further revised in tune with the FRTB.
The new Standardized Approach (SA-CCR), finalized in March 2014, is applicable to all derivative contracts (excluding repo like contracts) from January 2017. The approach plays a significant role in calculation of large exposures of capital requirements (CCR and CVA) and the leverage ratio of banks. It is also expected to indirectly impact capital held by banks who are also clearing house members.
The CVA treatment is also being reviewed and updated proposals for change in line with FRTB are expected.
3. Interest Rate Risk in the Banking Book (IRRBB)
The revised standards were published in April 201614
The standards revise the Committee’s 2004 Principles for the management and supervision of interest rate risk, which set out supervisory expectations for banks’ identification, measurement, monitoring and control of IRRBB as well as its supervision. The key enhancements to the 2004 Principles include:
- More extensive guidance on the expectations for a bank’s IRRBB management process in areas such as the development of interest rate shock scenarios, as well as key behavioural and modelling assumptions to be considered by banks in their measurement of IRRBB.
- Enhanced disclosure requirements to promote greater consistency, transparency and comparability in the measurement and management of IRRBB. This includes quantitative disclosure requirements based on common interest rate shock scenarios.
- An updated standardised framework, which supervisors could mandate their banks to follow or banks could choose to adopt.
- A stricter threshold for identifying outlier banks, which is has been reduced from 20% of a bank’s total capital to 15% of a bank’s Tier 1 capital.
The standards reflect changes in market and supervisory practices since the Principles were first published in 2004, which is particularly pertinent in light of the current exceptionally low interest rates in many jurisdictions. The revised standards, which were published for consultation in June 2015, are expected to be implemented by 2018.
4. Credit Risk – Revisions to Standardized Approach and IRB Approach, and the Revisions to the Securitizations Framework
The committee has been considering two methodologies – a more credible standardized approach for credit risk, and how the Internal Ratings Based (IRB) approach should be adjusted for better simplicity and comparability.
The second consultative document (December 2015) on Revisions to the Standardised Approach for credit risk15 forms part of the Committee’s broader review of the capital framework to balance simplicity and risk sensitivity, and to promote comparability by reducing variability in risk-weighted assets across banks and jurisdictions.
Some salient features proposed in the above document include (a) a two stage process for exposure to banks, with unrated exposures subject to a new approach; (b) a refined approach for corporate exposures, with and without external ratings; (c) 85% risk weight for SME exposures; (d) issue specific external ratings for specialized lending, and specific risk weights where external ratings are not available or not permitted; (e) specific detailed processes for risk weighting loans to real estate. The document does not set out a standardized approach for sovereigns and other public sector entities, or which categories are being considered under a broader review of these exposures, including the IRB.
The consultative document (March 2016) Reducing variation in credit risk-weighted assets constraints on the use of internal model approaches16 sets out the Committee’s proposed changes to the advanced internal ratings-based approach and the foundation internal ratings-based approach.
The proposed changes to the IRB approaches set out in the above consultative document include a number of complementary measures that aim to: (i) reduce the complexity of the regulatory framework and improve comparability; and (ii) address excessive variability in the capital requirements for credit risk. Specifically, the Basel Committee proposes as follows:
- Remove the option to use the IRB approaches for certain exposures, where it is judged that the model parameters cannot be estimated sufficiently reliably for regulatory capital purposes (section 2);
- Adopt exposure-level, model-parameter floors to ensure a minimum level of conservatism for portfolios where the IRB approaches remain available (section 3); and
- Provide greater specification of parameter estimation practices to reduce variability in risk weighted assets (RWA) for portfolios where the IRB approaches remain available (section 4).
Final rules are awaited for the above mentioned proposals for credit risk measurement.
Securitization Exposures – final Standards
Final standards have been published in respect of securitization exposures in July 2016. The document titled Revisions to the Securitization Framework17 states that the standards have been “amended to include the alternative capital treatment for “simple, transparent and comparable” securitisations”.
The revised framework comes into effect in January 2018.
The financial crisis highlighted weaknesses in the Basel II securitization framework, some of which were identified as the following:
- Very low risk weights for highly rated securitization exposures.
- Mechanistic reliance on external ratings.
- Very high risk weights for low rated senior securitization exposures.
- Cliff effects.
- Insufficient risk sensitivity of the framework.
The revised framework aimed at addressing the major shortcomings of the earlier one. Some of the revisions relate to the following aspects:
(a.) Hierarchy
The Basel II framework consists of two hierarchies – one for the Standardized Approach (SA), and the other for the Internal Ratings Based approach (IRB) – depending on the approach used by banks for the underlying assets securitised. The Basel III revised framework has revised this hierarchy to reduce reliance on external ratings and to simplify and limit the number of approaches. Diagram 11.4 shows the revised hierarchy under the revised framework.
The revised hierarchy of approaches in the revised framework for securitisation exposures is:
DIAGRAM 11.4 REVISED HIERARCHY OF APPROACHES UNDER THE REVISED SECURITIZATION FRAMEWORK

(b.) Approaches
The number of approaches have also been reduced in the revised framework. There would be only three primary approaches, as opposed to the multiple approaches and exceptional treatments of the Basel II framework. The revised hierarchy of approaches relies on the information that is available to the bank and on the type of analysis and estimations that it can perform on a specific transaction.
The STC criteria are intended to help transaction parties – including originators, investors and other parties with a fiduciary responsibility – evaluate more thoroughly the risks and returns of a particular securitisation, and to enable more straightforward comparison across securitisation products within an asset class. These criterias should assist investors in undertaking their due diligence on securitisations.
| What does STC mean? | |
|---|---|
| Simplicity | Simplicity refers to the homogeneity of underlying assets with simple characteristics, and a transaction structure that is not overly complex. |
| Transparency | Criteria for transparency to provide investors with sufficient information on the underlying assets, the structure of the transaction and the parties involved in the transaction, thereby promoting a more comprehensive and thorough understanding of the risks involved. The manner in which the information is available should not hinder transparency, but instead support investors in their assessment. |
| Comparability | Criteria promoting comparability which could assist investors in their understanding of such investments and enable more straightforward comparison across securitisation products within an asset class. More importantly, they should appropriately take into account differences across jurisdictions. |
Banks must deduct from Common Equity Tier 1 any increase in equity capital resulting from a securitisation transaction, such as that associated with expected future margin income resulting in a gain on sale that is recognised in regulatory capital.
The revised framework document quoted above also contains detailed illustrations.
5. Operational Risk
The second consultative document on Standardized Measurement Approach for Operational Risk was released by BCBS in March 2016.18
The committee’s review of banks’ operational risk modelling practices and the resultant capital requirement revealed that the inherent complexity and lack of comparability of Advanced Measurement Approach (AMA) was leading to variability in risk weighted asset calculations. The committee therefore proposes to remove the AMA from the regulatory framework.
The revised operational risk capital framework will be based on a single non model based method, termed as Standardized Measurement Approach (SMA). The SMA would build on the simplicity and comparability of the standardized approach and embody the risk sensitivity of an advanced approach. It would mainly consist of a revised business indicator, new size-based risk coefficients instead of segment-based risk coefficients, and a loss component that accounts for observed operational losses.
The final rules are awaited.
Capital floors
In December 2014, BCBS published a consultative document Capital Floors: The Design of a Framework Based on Standardised Approaches.19
This framework will replace the current transitional floor, which is based on the Basel I Standard 1. The revised capital floor framework will be based on the Basel II/III standardised approaches, and allows for a more coherent and integrated capital framework.
The objectives of a capital floor are to: ensure that the level of capital across the banking system does not fall below a certain level; mitigate model risk and measurement error stemming from internally modelled approaches; address incentive-compatibility issues; and enhance the comparability of capital outcomes across banks. A capital floor complements the leverage ratio introduced as part of Basel III. Together, these measures aim to reinforce the risk-weighted capital framework and promote confidence in the regulatory capital framework.
The final rules are awaited.
7. Pillar 3 Disclosure Requirements – Consolidated and Enhanced framework
Pillar 3 of Basel III has been revised and enhanced in March 2017, through Pillar 3 Disclosure Requirements - Consolidated and Enhanced Framework20
We have seen earlier in this chapter that the Pillar 3 disclosure framework seeks to promote market discipline through regulatory disclosure requirements. The enhancements in the revised framework contain three main elements:
- Consolidation of all existing Basel Committee disclosure requirements into the Pillar 3 framework, covering the composition of capital, the leverage ratio, the liquidity ratios, the indicators for determining globally systemically important banks, the countercyclical capital buffer, interest rate risk in the banking book and remuneration.
- Introduction of a “dashboard” of banks’ key prudential metrics which will provide users of Pillar 3 data with an overview of a bank’s prudential position and a new disclosure requirement for banks which record prudent valuation adjustments to provide users with a granular breakdown of its calculation.
- Updates to reflect ongoing reforms to the regulatory framework, such as the total loss-absorbing capacity (TLAC) regime for a global systemically important banks and the revised market risk framework published by the Committee in January 2016.
The implementation date for each of the disclosure requirements is set out in the standard.
Further regulatory initiatives
a. Risk weighting of Sovereign exposures:
This would entail introduction of regulatory capital requirements for banks investing in governments based solely on external ratings.
b. IFRS 9:
IFRS 9 is intended as replacement of the current accounting standard IAS39 for financial instruments and introduction of a new framework for classification, impairments and hedge accounting. The standards become effective in 2018.
While IAS 39 looks at incurred credit losses, IFRS 9 is intended as a futuristic standard for expected credit losses.
IFRS 9 describes Expected Credit Losses (ECL) as the weighted average of credit losses with the respective risks of a default occurring as the weights. Credit losses are the difference between all contractual cash flows that are due to an entity in accordance with the contract and all the cash flows that the entity expects to receive (i.e. all cash shortfalls), discounted at the original effective interest rate (or credit-adjusted effective interest rate for purchased or originated credit-impaired financial assets).
IFRS 9.5.5.17 outlines the measurement of ECL in a way that reflects: (a) an unbiased and probability-weighted amount that is determined by evaluating a range of possible outcomes; (b) the time value of money; and (c) reasonable and supportable information that is available without undue cost or effort at the reporting date about past events, current conditions and forecasts of future economic conditions.
For example, under IAS 39’s incurred loss approach, a provision is only accrued when there is a credit loss event. Therefore, assuming a loan of Rs 100 with three years’ maturity, there is no provision made if the loan is a standard asset in the first two years. If in the third year, the loan shows impairment, a provision is made in that year.
However under IFRS 9, the calculations will be as follows:
Assume a 3 year loan with $100 value and 10% interest rate, paid annually. The following illustrates 12 month and lifetime ECL calculations.
TABLE 11.9 CALCULATION OF 12 MONTH AND LIFETIME ECL AT BEGINNING OF YEAR L - WITH DISCOUNTING

The above implies that the parameters PD and LGD have to be forward looking and EAD should be a best estimate for both drawn and undrawn amounts.
SECTION III
APPLICATION Of CAPITAL ADEqUACy TO BANKS IN INDIA21
In India, the Narasimham Committee, appointed by the government, had submitted its report on banking reforms in the early 1990s. The Committee had observed that the capital ratios of Indian banks were generally low and that some banks were seriously undercapitalized. The Basel framework was adopted by the RBI in 1992, prescribing a higher norm of 9 per cent on risk-weighted assets (as against 8 per cent by the Basel Accord) for all banks operating in India.
The RBI has adopted the BCBS Basel III framework (section II), and banks in India would be reporting minimum capital under Basel III beginning April 1, 2013. The related guidelines have been published by the RBI in June 2015 and some revisions in 2016.22 For better understanding, these guidelines have been regrouped and presented in the following paragraphs.
- The Minimum Capital Requirement
The Basel III total regulatory capital would be disclosed by banks in India as given below:
- Tier 1 capital (going concern capital)23
- Common equity tier I (CET1)
- Additional Tier I
- Tier 2 capital (gone concern capital)
The minimum total capital as a percentage of risk weighted assets (CRAR) would be at 9 per cent under Basel III. The RBI has been consistently stipulating higher minimum capital of 9 per cent (as against BCBS requirement of 8 per cent) for both Basel I and II for banks in India.
Table 11.9 compares the various components of capital requirements in India and as proposed by BCBS Basel III framework
RBI guidelines require banks in India to maintain 1 per cent more capital and 1.5 per cent more as leverage ratio, over and above the minimum requirements stipulated by BCBS.
The RBI would implement Basel III capital regulations from April 1, 2013 in a phased manner, with the plan of fully implementing the capital ratios by end March 2019. For the financial year ending March 2013, banks in India were required to disclose the capital ratios computed under both the Basel II and III guidelines.
- Tier 1 capital (going concern capital)23
- Transitioning to Basel III
The transitioning of banks in India to Basel III begins from April 1, 2013. The phasing in plan for banks in India is shown in Table 11.11
TABLE 11.11 TRANSITIONAL ARRANGEMENTS-SCHEDULED COMMERCIAL BANKS (EXCLUDING LABS AND RRBS)
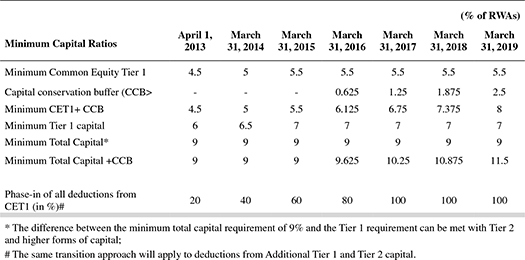 Source: RBI Master circular–Basel III Capital regulations, dated June 1, 2015, p. 32.
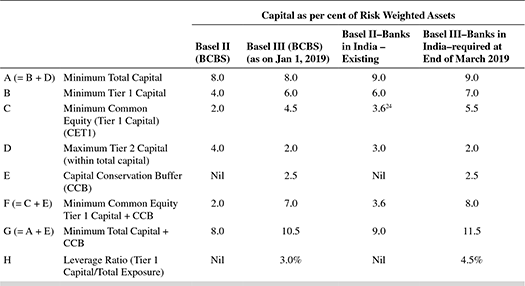
Capital Components–Banks in India
While the overall definitions of the BCBS document of CET1, additional Tier 1 and Tier 2 capital have been retained, the RBI has spelt out the components of each type of capital relevant to Indian banks. Table 11.12 provides a comparative picture of capital components under Basel II and III is given below for clearer understanding
TABLE 11.12 BASEL II AND III CAPITAL REQUIREMENTS COMPARED – COMPOSITION OF CAPITAL
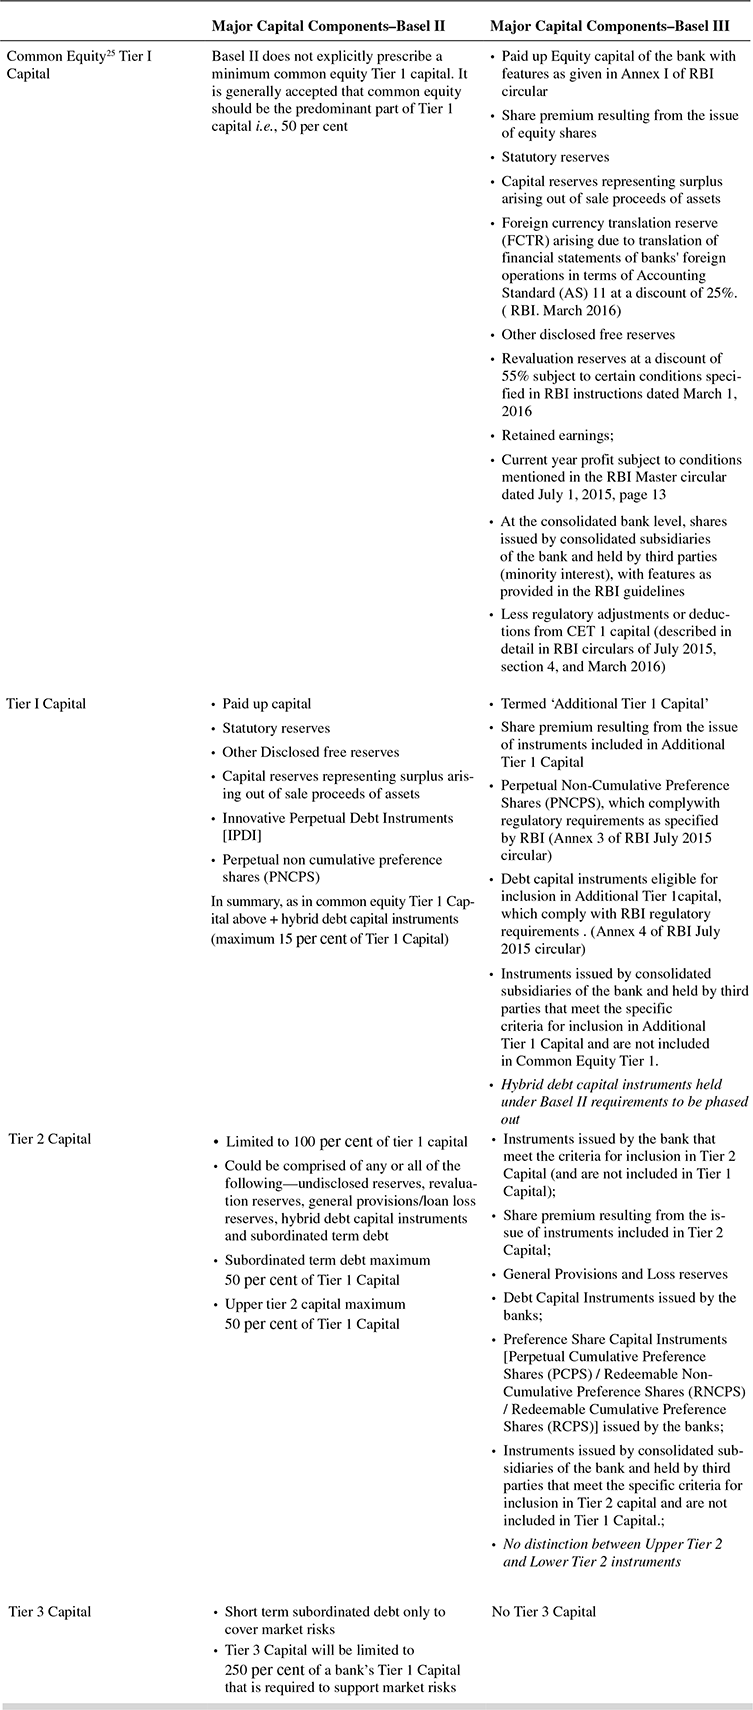
For detailed description of the types of capital funds, please refer to the latest RBI Master circular on Basel III, accessible on www.rbi.org.in
Pillar I-Implementation In accordance with the Basel II norms summarized in the BIS document ‘International convergence of capital measurement and capital standards—a Revised framework’ issued in June 2006 (please refer Section II), the RBI requires that all commercial banks in India (excluding local area banks and regional rural banks) adopt the
- Standardized approach for credit risk,
- Standardized approach (modified duration) for market risk and
- Basic indicator approach for operational risk.
All commercial banks were required to migrate to the above approaches by 31 March 2009. The revised capital adequacy norms will be applicable to commercial banks both at the global as well as the consolidated level.26
We have learnt in Section II the revisions being carried out in the computation of risk weighted assets by BCBS. RBI directions on the approaches to be adopted by Indian banks will follow.
Capital Funds of Banks Operating in India
RBI requires banks in India to maintain at the minimum, a capital to risk-weighted assets ratio (CRAR) of 9 per cent (as against the international norm of 8 per cent prescribed by the Basel Committee).
Though the CRAR of 9 per cent will have to be held continuously by banks, RBI also expects banks to operate at a capital level well above the minimum requirement. Additionally, RBI would assess individual banks’ risk profiles and risk management systems and call for additional capital infusion, where the capital is not found commensurate with the banks’ overall risk profile.
Banks in India are required to maintain a Tier 1 capital ratio of at least 7 per cent, and a total capital to risk weighted assets ratio of at least 9per cent. The Common Equity Tier 1 capital should be at least 5.5 per cent of risk weighted assets. These ratios are computed as follows.

RWAs denote ‘risk weighted assets’.
Some points to be noted are:
- The above equations signify that Tier 2 capital can be at a maximum of 2 per cent.
- In addition, banks should maintain a Capital Conservation Buffer (CCB) of 2.5 per cent of RWAs in the form of Common equity tier 1 capital.
- Only if a bank has complied with the CET 1 ratio of 5.5 percent and the CCB of 2.5 percent put together, canitadmit additional tier1 and tier 2 capital in excess of the pr escribed limits. The illustrative examples given in the RBI circular are self explanatory, and reproduced below: (Illustrations 11.2 and 11.3)
ILLUSTRATION 11.2
How to calculate admissible Tier 1 and Tier 2 capital (calculations pertain to March 2018)
| Capital Ratios as on March 31, 2018 | |
|---|---|
| Common Equity Tier 1 | 7.5% of RWAs |
| CCB | 2.5% of RWAs |
| Total CET1 | 10% of RWAs |
| PNCPS/PDI | 3.0% of RWAs |
| PNCPS/PDI eligible for Tier 1 capital | 2.05% of RWAs {(1.5/5.5) × 7.5% of CET1 |
| PNCPS/PDI ineligible for Tier 1 capital | 0.95% of RWAs (3–2.05) |
| Eligible Total Tier 1 capital | 9.55% of RWAs |
| Tier 2 issued by the bank | 2.5% of RWAs |
| Tier 2 capital eligile for CRAR | 2.73% of RWAs {(2/5.5) × 7.5% of CET1} |
| PNCPS/PDI eligible for Tier 2 capital | 0.23% of RWAs (2.73–2.5) |
| PNCPS/PDI not eligible Tier 2 capital | 0.72% of RWAs (0.95–23) |
| Total available capital | 15.50% |
| Total capital | 14.78% (12.28% + 2.55) |
| (CET1 – 10% + AT1 – 2.05% + Tier 2 – 2.73) | |
ILLUSTRATION 11.3
How to calculate capital for market risk – Basel III
- Capital Funds
Common Equity Tier 1 capital 75 Capital Conservation Buffer 25 PNCPS/PDI 30 Eligible PNCPS/PDI 20.5 Eligible Tier 1 capital 95.5 Tier 2 Capital available 25 Tier 2 Capital eligibility 27.3 Excess PNCPS/PDI eligible for Tier 2 Capital 2.73 Total Eligible Capital 122.8 - Total Risk Weighted Assets (RWA)
RWA for credit and operational risk 900 RWA for market risk 100 -
Minimum Common Equity Tier 1 Capital required to support credit and opeational risk (900 × 5.5%) 49.5 Maximum Additional Tier 1 Capital within Tier 1 Capital required to support credit and operational risk (900 × 1.5%) 13.5 Maximum Tier 2 Capital within Total Capital required to support credit and operational risk (900 × 2%) 18 Total Eligible Capital required to support credit and operational risk 81 (49.5 + 13.5 + 18) -
Minimum Common Equity Tier 1 Capital available to support market risk 25.5(75 – 49.5) Maximum Additional Tier 1 Capital within Tier 1 Capital available to support market risk 7 (20.5 – 13.5) Maximum Tier 2 Capital within Total Capital available to support market risk 9.3 (27.3 – 18) Total Eligible Capital available to support market risk 41.8 (122.8 – 81)
Source for both illustrations is the RBI Master circular on Basel III dated July 1, 2013, Annexure 14, pages 217, 218
- The Capital Conservation Buffer (CCB) will be transitioned during the Basel III implementation period as shown in Table 11.13 It may be noted that as against the Basel III international cut off of 7 per cent of CET1 ratio (please refer to the Basel III guidelines outlined in the previous section), Indian banks need a 7.375 per cent CET 1 ratio for maintaining the minimum CCB of 0 per cent.
TABLE 11.13 CCB TRANSITIONING PLAN FOR INDIAN BANKS
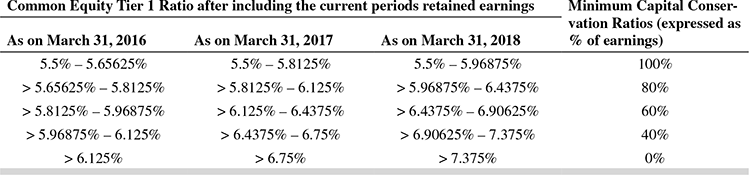
- Table 11.14 compares the salient features of Additional Tier 1 instruments as stipulated by the RBI
TABLE 11.14 FEATURES OF ADDITIONAL TIER 1 INSTRUMENTS COMPARED

- The RBI circular also provides detailed guidelines on treatment of investments in banks in capital instruments issued by other financial entities. The following figure extracted from the circular (page 27) summarizes the instructions.
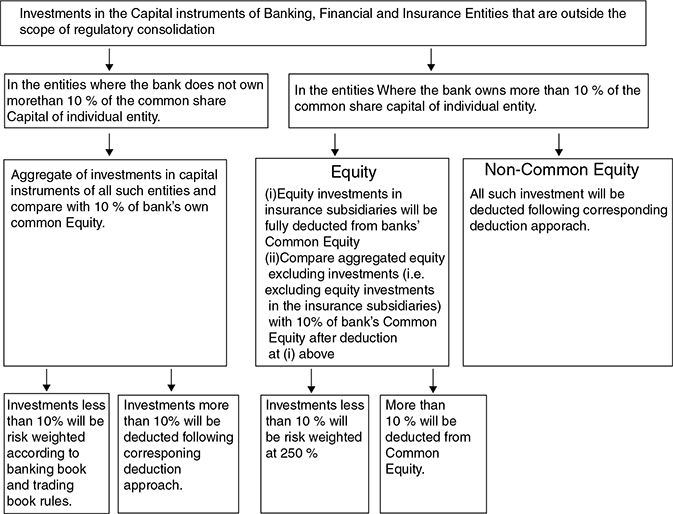
Annex 11 of the RBI Circular provides an Illustrative example of related computations.
Tier 2 Capital—Some Features
For both Indian and foreign banks operating in India, Tier 2 capital can consist of the following:
- Revaluation reserves
- These reserves often serve as a cushion against ULs. But they are less permanent in nature and cannot be considered as core capital. Revaluation reserves arise from revaluation of assets considered undervalued in the banks’ books, typically bank premises and marketable securities. The extent to which revaluation reserves can be relied upon as a cushion for ULs depends primarily upon the level of certainty that can be placed on estimates of market values of the relevant assets, the subsequent deterioration in values under difficult market conditions or in a forced sale, potential liquidation at those values and tax consequences of revaluation. Hence, RBI prescribes that revaluation reserves may be taken at a discount of 55 per cent while determining their value for inclusion in Tier 2 capital. On the balance sheet, however, the entire value would continue to be reflected as revaluation reserves.
In March 2016, RBI permitted banks to include revaluation reserves after applying the discount of 55% in CET1 capital, instead of in tier 2 capital, if the following conditions were met:27
- Bank is able to sell the property readily at its own will and there is no legal impediment in selling the property.
- The revaluation reserves are shown under Schedule 2: Reserves & Surplus in the Balance Sheet of the bank.
- Revaluations are realistic and in accordance with Indian Accounting Standards.
- Valuations are obtained, from two independent valuers, at least once in every 3 years; where the value of the property has been substantially impaired by any event, these are to be immediately revalued and appropriately factored into capital adequacy computations.
- The external auditors of the bank have not expressed a qualified opinion on the revaluation of the property.
- These reserves often serve as a cushion against ULs. But they are less permanent in nature and cannot be considered as core capital. Revaluation reserves arise from revaluation of assets considered undervalued in the banks’ books, typically bank premises and marketable securities. The extent to which revaluation reserves can be relied upon as a cushion for ULs depends primarily upon the level of certainty that can be placed on estimates of market values of the relevant assets, the subsequent deterioration in values under difficult market conditions or in a forced sale, potential liquidation at those values and tax consequences of revaluation. Hence, RBI prescribes that revaluation reserves may be taken at a discount of 55 per cent while determining their value for inclusion in Tier 2 capital. On the balance sheet, however, the entire value would continue to be reflected as revaluation reserves.
- General provisions and loss reserves
- These reserves can be included in Tier 2 capital if they are available to meet ULs and are not attributable to actual diminution in value or potential loss in any specific asset. Banks are permitted to include under this category (a) general provisions on Standard Assets, (b) floating provisions, (c) provisions held for country exposures, (d) Investment reserve account and (e) excess provisions on sale of NPAs. Such unencumbered reserves under this head will, however, be admitted as Tier 2 capital only up to a maximum of 1.25 per cent of credit risk-weighted assets.
- Debt capital instruments/Perpetual cumulative preference shares (PCPS)/ Redeemable non cumulative preference shares (RNCPS)/ Redeemable cumulative preference shares (RCPS)
To be eligible for inclusion in Tier 2 capital, the instrument should be fully paid up, unsecured, subordinated to claims of other creditors, free of restrictive clauses and should not be redeemable at the instance of the holder or without the consent of the RBI. The instruments carry a fixed maturity and as they approach maturity, a progressive discount will be applied on their value.
It is this discounted value that will be included as part of Tier 2 capital. Instruments with an initial maturity of less than 5 years or with a remaining maturity of 1 year, cannot be included in Tier 2 capital. Subordinated debt instruments eligible to be reckoned as Tier 2 capital will be limited to 50 per cent of Tier 1 capital. The rate at which discounts will be applied are as follows:
Remaining Maturity of Instruments Rate of Discount (per cent) Less than 1 year 100 1 year and more but less than 2 years 80 2 years and more but less than 3 years 60 3 years and more but less than 4 years 40 4 years and more but less than 5 years 20
The total amount of such Tier 2 capital instruments would be considered as part of NDTL for computing the bank’s reserve requirements (CRR/SLR).
RBI approval has to be sought every time a bank issues subordinated debt in foreign currency.
The other conditions for accessing subordinate debt for Tier 2 capital by Indian banks and foreign banks in India are provided in Annexures 5 and 6 of RBI Master circular—Basel III regulations, dated July 1, 2015.
Similarly, criteria for Tier 1 and Tier 2 capital to be maintained by foreign banks operating in India are also spelt out in the quoted RBI circular.
Counter Cyclical Capital buffer (CCCB)
We have learnt in Section II about the rationale and framework for countercyclical capital buffer in the Basel III norms.
The credit-to-GDP gap (Credit-to-GDP gap is the difference between credit-to-GDP ratio and the long term trend value of credit-to-GDP ratio at any point in time) will be the main indicator in the CCCB framework in India. However, it shall not be the only reference point and shall be used in conjunction with GNPA (Gross Non Performing Assets) growth.
RBI also will be considering other supplementary indicators for CCCB decision such as incremental C-D (Credit to Deposit) ratio for a moving period of three years (along with its correlation with credit-to-GDP gap and GNPA growth), Industry Outlook (IO) assessment index (along with its correlation with GNPA growth) and interest coverage ratio (along with its correlation with credit-to-GDP gap). While taking the final decision on CCCB, the Reserve Bank of India may use its discretion to use all or some of the indicators along with the credit-to-GDP gap.
Banks will be subjected to restrictions on discretionary distributions (may include dividend payments, share buybacks and staff bonus payments) if they do not meet the requirement on countercyclical capital buffer which is an extension of the requirement for capital conservation buffer (CCB). Assuming a concurrent requirement of CCB of 2.5% and CCCB of 2.5% of total RWAs, the required conservation ratio (restriction on discretionary distribution) of a bank, at various levels of CET1 capital held is illustrated in Table 11.15.
TABLE 11.15 INDIVIDUAL BANK MINIMUM CAPITAL CONSERVATION RATIOS ASSUMING 2.5% EACH OF CCB AND CCCB

The CET1 ratio bands are structured in increments of 25% of the required CCB and CCCB prescribed by RBI at a specific point in time
For example, Table 11.16 shows the implication of assuming CCB at 2.5% and CCCB at 1%
TABLE 11.16 INDIVIDUAL BANK MINIMUM CAPITAL CONSERVATION STANDARDS, ASSUMING CCB AT 2.5%
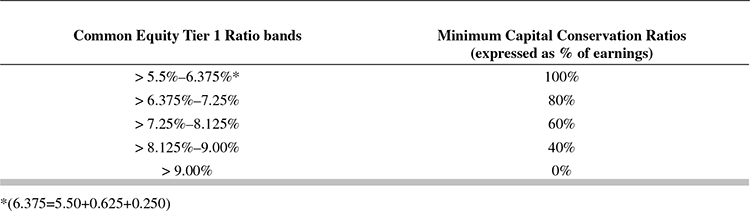
To understand the calculation, consider the first CET1 ratio band = minimum CET1 ratio + 25% of CCB + 25% of applicable CCCB (that is, 5.50 + 25% of 2.5% + 25% of 1% = 5.50 + 0.625 + 0.250*). For subsequent bands, the starting point will be the upper limit of the previous band. However, CET 1 ratio band will change, depending on the factors outlined earlier. Hence, as RBI changes the CET1 band, the lower and upper values will also change.
The CCCB decisions would form a part of the first bi-monthly monetary policy statement of the Reserve Bank of India for the year. However, more frequent communications in this regard may be made by the Reserve Bank of India, if warranted by changes in economic conditions.
Detailed guidelines can be accessed in Part F of the RBI Master circular of July 2015.
Leverage Ratio
In section II we have understood the rationale and standards set for the leverage ratio introduced in Basel III framework.
In Part E of the RBI Master circular, the Basel III leverage ratio is defined as the capital measure (the numerator) divided by the exposure measure (the denominator), with this ratio expressed as a percentage.
At present, the Indian banking system is operating at a leverage ratio of more than 4.5%. The final minimum leverage ratio will be stipulated by end 2017, after considering the final rules by the Basel Committee. During this period RBI monitors individual banks against the indicative leverage ratio of 4.5%.
Capital Measure
The capital measure for the leverage ratio is the Tier 1 capital as described in the RBI Master circular, taking into account various regulatory adjustments / deductions and the transitional arrangements. It is to be noted that the capital measure used for the leverage ratio at any particular point in time is the Tier 1 capital measure applying at that time under the risk-based framework.
Exposure Measure : General Measurement Principles
- The exposure measure for the leverage ratio should generally follow the accounting value, subject to the following:
- On-balance sheet, non-derivative exposures are included in the exposure measure net of specific provisions or accounting valuation adjustments;
- Netting of loans and deposits is not allowed.
- Unless specified differently below, banks must not take account of physical or financial collateral, guarantees or other credit risk mitigation techniques to reduce the exposure measure.
- A bank’s total exposure measure is the sum of the following exposures:
- On-balance sheet exposures.
- Derivative exposures.
- Securities financing transaction (SFT) exposures.
- Off- balance sheet (OBS) items.
The specific treatments for these four main exposure types are defined in paragraphs 16.4.2 to 16.4.5 of the RBI Master circular.
TEASE THE CONCEPT
Why should ‘Debt’ be included in a Bank’s ‘Capital’?
Procedure for Computing Minimum Capital Requirements
- Degrees of credit risk expressed as percentage weightings are assigned to balance sheet assets and conversion factors to off-balance sheet items.
- Convert ‘off-balance sheet’ contingent liabilities to an on-balance sheet notional ‘credit equivalent’, by multiplying each contingent liability by the appropriate ‘credit conversion factor’ and classify in the applicable risk category.
- Multiply the rupee amount of assets in each category—funded and non-funded, converted into the credit equivalent—by the appropriate risk-weight.
- Risk-adjusted assets would mean the weighted aggregate of funded and non-funded items.
- The banks’ overall minimum capital requirement will be the sum of:
- Capital requirement for credit risk on all credit exposures excluding items comprising trading book and including counter party credit risk on all OTC derivatives on the basis of the risk-weights,
- Capital requirement for market risks in the trading book and
- Capital requirement for operational risks.
Calculating Capital Charges and Risk-Weighted Assets
I. Capital Charge for Credit Risk Banks in India currently follow the ‘Standardized Approach’ (described in Section II). Under this approach, ratings assigned by external credit rating agencies will largely support the credit risk measurement. The assets/credit facilities and other facilities provided by the bank would be rated by the approved credit rating agency and the risk-weighting of the asset or claim will be based on this rating.
The credit rating agencies identified by the RBI are given in the Master circular dated July 1, 2013, under Section 6. Once a bank decides on the credit rating agency, it should continue to use the ratings of the same agency for rating all claims to ensure consistency and prevent ‘cherry picking’. Banks should also disclose the name of the credit rating agency and the rating should be publicly available. Section 6 of the RBI, ‘Master Circular’ stipulates stringent conditions in respect of external credit rating.
Under the Standardized approach of the Basel II framework, a mapping process would be required to link the ratings by external agencies to the risk-weights (reflecting the credit risk) to be applied to calculate capital adequacy. The mapping process has been described in detail in the RBI circular.
On the basis of the external credit ratings and the mapping process, credit risk-weights are assigned to the following counter parties: (described in detail under section 5 of the RBI circular).
- Claims on domestic sovereigns.
- Claims on foreign sovereigns.
- Claims on public sector entities.
- Claims on multilateral development banks (MDB), Bank for International Settlements (BIS) and International monetary fund (IMF).
- Claims on banks.
- Claims on primary dealers.
- Claims on corporates, depending on short term or long term credit facilities and the related ratings.
- Claims included in the regulatory retail portfolios. However this category excludes investment exposures (equity or bonds), mortgage loans (both residential and commercial real estate), staff advances, consumer credit such as personal loans and credit card receivables, capital market exposures and venture capital funds.
- Claims secured by residential property.
- Claims secured by commercial real estate.
- Non-performing assets—bifurcated into unsecured and secured portions and assigned risk-weights.
- Specified categories—will include venture capital funds, consumer credit, capital market exposures, nonbanking financial companies (NBFC), investment in other banks and financial entities and other exposures considered ‘high risk’.
- Other assets—include advances to staff.
- Off balance sheet items—We know that off balance sheet items can be potential credit exposures. Hence, the risk-weighted amount of an off balance sheet item is arrived at through a two-step process:
- The notional amount of the transaction is first converted into an ‘on balance sheet credit equivalent’ by multiplying by the appropriate ‘credit conversion factor’ (or by applying the ‘current exposure method’ briefly described later) and,
- The credit equivalent is multiplied by the applicable risk-weight to create a ‘risk-weighted asset’.
However, where the off balance sheet exposure is secured by eligible collateral or guarantee, the guidelines applicable to ‘credit risk mitigation’ (see section 7 of the RBI circular) will be used.
While risk-weighting off balance sheet items, a further distinction is made between market related and non-market related exposures.
- Non-market-related off balance sheet items are those such as direct credit substitutes, trade and performance related contingent items or credit commitment with certain draw downs. In such cases, the credit equivalent is simply the contracted amount multiplied by the relevant credit conversion factor. Where the non market related off balance sheet item is an undrawn or partially undrawn fund based facility, the treatment would be as shown in Illustrations 11.4 and 11.5 (given as footnote to 5.15.2 (ii) in the RBI circular).
ILLUSTRATION 11.4
Assume a cash credit/short term loan facility of ₹100 lakhs. Of this, assume ₹60 lakhs has been drawn and is also the average utilization. The outstanding balance would be multiplied by the risk-weight applicable to the rating of the borrower. The remaining ₹40 lakhs would be treated as an undrawn commitment and would therefore have to be multiplied by the credit conversion factor. Assume the applicable conversion factor is 20 per cent. The credit equivalent would be 20 per cent of ₹40 lakhs, that is, ₹8 lakhs. This amount should be multiplied by the risk-weight applicable to the borrower to compute the riskweighted asset value of the undrawn portion.
ILLUSTRATION 11.5
Assume a long term loan of ₹700 crores for a large project. The loan has been sanctioned such that the credit limit will be drawn in 3 stages, to coincide with the progress of construction. Assume that the loan can be drawn at every subsequent stage only with explicit approval from the bank and on completion of specified formalities. If the limit for stage 1 has been determined at ₹150 crores and the borrower has drawn ₹50 crores, the ‘undrawn commitment’ for applying the credit conversion factor will be restricted to stage 1 alone, that is, ₹100 crores. The conversion factor could vary depending on the period within which stage 1 is to be completed. Stages 2 and 3, which have not fallen due for disbursement would not be risk-weighted.
- Market-related off balance sheet items include market transactions that can potentially hold off balance sheet credit risk in the banking and trading books of banks. Examples are interest rate contracts (such as interest rate futures, interest rate swaps, forward rate agreements, etc. discussed in the following chapter) and foreign exchange contracts. The credit equivalent is determined by the ‘current exposure method’, which is the sum of current credit exposure and potential future credit exposure of the contracts. (The method, as well as special cases, such as ‘failed transactions’ are described in paragraphs 5.15.3 and 5.15.4 of the cited RBI, Master Circular).
- Securitization exposures resulting from securitization transactions have been defined in RBI’s ‘Guidelines for securitization of standard assets’ (circular dated 1 February 2006) and Section 5.16 of the cited RBI, Master Circular on capital adequacy. Banks’ securitization exposures include those (but are not restricted to) in roles such as investors, credit enhancers, liquidity providers, underwriters or providers of credit risk mitigation. This implies that if a bank invests in asset backed securities, provides liquidity facility or credit enhancement, retains a subordinated tranche or provides credit risk mitigation to other securitization transactions, the transactions would lead to securitization exposures. Further, securitization exposures would also include (a) credit enhancing interest only strips (I/O)28, (b) implicit support provided by the bank in excess of its contractual obligation or (c) a gain on sale. If the originating bank in a securitization transaction fails to meet the minimum requirements of RBI (as given in the circular dated 1 February 2006), the bank will have to hold capital commensurate with the exposures, as if the exposures were not securitized and gain on sale, if any, would have to be deducted from capital. Illustration 11.6 clarifies the discussion (Footnote 65 of the RBI Master circular).
ILLUSTRATION 11.6
Assume a securitization pool of ₹100 crores, with 80 per cent AAA rated, 10 per cent BB and 10 per cent unrated securities. If the transaction does not fulfil the criteria stipulated by the RBI, it would be assumed that the originating bank holds all the exposures in non-securitized form. Therefore, the risk-weight appropriate for AAA rated securities in the standardized approach would be applied to 80 per cent of the exposure. However, the value of lower rated and unrated securities (20 per cent in this case) would be deducted from capital.
Detailed guidelines for deduction of securitization exposures from capital funds can be accessed from Section 5.16 of the quoted RBI, Master Circular.
- Credit risk mitigation (CRM) techniques, historically in the nature of collateral securities and guarantees, have been undergoing a change with many banks shifting to ‘originate to distribute’ model. Under this model, banks transfer the credit risk of borrowers to other investors, as seen in earlier chapters. RBI follows the Basel II capital requirements under the standardized approach and makes it applicable to banking book exposures, as well as counter party risks in ‘over the counter’ (OTC) derivatives and ‘repo style’ transactions in the trading book. In order to mitigate possible legal risks in the CRM transactions, banks are required to meet minimum legal documentation standards.29
II. Capital Charge for Market Risk The RBI defines market risk as the risk of losses in on balance sheet and off balance sheet positions arising from movements in market prices. The market risk positions subject to capital charge requirement are as follows: (Please see Section 8 of RBI Master Circular)
- The risks pertaining to interest rate related instruments and equities in the trading book
- Foreign exchange risk (including open position in precious metals) throughout the bank (both banking and trading books)
Banks are required to maintain capital charge for interest rate related instruments in the trading book, equities in the trading book and foreign exchange risk (including gold and other precious metals) in both trading and banking books. Trading book for the purpose of capital adequacy will include the following:
- Securities included under the Held for Trading (HFT) category
- Securities included under the Available for Sale (AFS) category
- Open gold position limits n Open foreign exchange position limits
- Trading positions in derivatives
- Derivatives entered into for hedging trading book exposures
Banks have to ensure that capital for market risk is maintained at the close of every business day and also manage intra day risks. Capital for market risk would not apply to securities that have already matured but remain unpaid, since these securities would attract capital only for credit risk.
Measurement of capital charge for interest rate risk in the trading book
Points to be Noted
- The measurement relates to debt securities and other interest rate related instruments held in rupees in the trading book.
- The capital charge would apply to current market values of these securities in the bank’s trading book.
The current market value will be determined in accordance with the RBI guidelines on valuation of investments.(See previous chapter)
- The capital requirement would be computed based on two separate charges—one, a specific risk charge for each security (comparable to the capital charge for credit risk), both for short30 and long positions; and two, a general market risk charge towards interest rate risk in the portfolio.
- The capital charge for specific risk is to protect against adverse movements in prices of individual securities triggered by factors relating to individual issuers. Hence, the guidelines provide specific risk charges for various exposures related to broad categories of issuers such as government (central, state and foreign), banks (bonds) and others (corporate bonds and securitized debt). From Table 16 (Part A–I) in the quoted RBI Master Circular, it can be seen that the highest specific risk capital charges (as a percentage of exposures) are applicable to investments in low rated foreign government securities, banks whose performance is below the desired capital adequacy benchmark and other unrated securities or those with low ratings. Where the securities’ risk is perceived as very high (as in unrated exposures), deduction from capital is stipulated.
- We have learnt from the earlier paragraphs on credit risk that counter party credit risk has to be computed on OTC derivatives. In addition, derivatives in the trading book carry a specific risk charge, the calculation of which is explained in detail in the quoted RBI circular.
- The capital requirements for general market risk are meant to capture the risk of loss arising from changes in market interest rates. The capital charge is the aggregate of four components:
- The net short (not permitted in India except in derivatives) or long position in the trading book
- A small proportion of the matched positions in each time band (the ‘vertical disallowance’)
- A larger proportion of matched positions across different time bands (the ‘horizontal disallowance’)
- A net charge for positions in options, where appropriate
Since banks in India are still in a nascent stage of developing internal risk management models, the RBI has stipulated that, to begin with, banks could adopt the standardized approach to market risk measurement. Under the standardized method, market risk could be measured by either the ‘maturity’ or the ‘duration’ method. Between the two, the duration31 method is preferred over the maturity method due to better accuracy.
Accordingly, banks will be measuring the general market risk charge using the ‘price sensitivity’ or ‘modified duration’ in the following steps:
- Calculate the price sensitivity (modified duration)32 of each instrument in the portfolio.
- Apply the assumed change in yield to the modified duration of each instrument between 0.6 and 1 percentage points, depending on the instrument’s maturity (as given in Table 17 of the quoted RBI circular).
- Slot the resulting capital charge measures into a maturity ladder with fifteen time bands as in Table 17 of RBI circular
- Apply a 5 per cent vertical disallowance to long and short positions in each time band. This step is meant to capture basis risk.
- Finally, carry forward the net positions in each time band for horizontal off-setting subject to the horizontal disallowances set out in Table 18 of the quoted the RBI, Master Circular.
The illustrations provided in Section IV will be helpful in understanding the above procedure.
Capital charge for specific risk will be 9 per cent and specific risk is computed on the banks’ gross equity positions (i.e., the sum of all long equity positions and of all short equity positions—short equity position is, however, not allowed for banks in India). The general market risk charge will also be 9 per cent on the gross equity positions.
The aggregate capital charge for market risk is calculated in the following format:
| (₹ in crore) | |
|---|---|
| Risk Category | Capital Charge |
|
We have learnt in Section II of the modifications in the standardized method by BCBS. RBI modifications to the method given above are awaited.
III. Capital Charge for Operational Risk The RBI’s definition of operational risk is the same as the Basel Committee’s definition. The definition includes legal risk, but excludes strategic and reputation risk. Legal risk includes (but is not restricted to) fines, penalties or punitive damages as consequences of supervisory actions and private settlements.
Banks in India will be arriving at the capital charge for operational risk using the Basic Indicator approach. However, internationally active banks and banks with significant operational risk exposures are expected to use more sophisticated approaches. In its communication dated 31 March 2010, the RBI has issued guidelines to banks for migrating to the standardized approaches for measuring operational risk.
Pillars II and III of the Basel Accord and their application in the Indian context are summarized in Annexure III of this chapter, while Annexure IV provides information on the capital adequacy ratio of banks operating in India.
The application of the Basel III to Indian banks raises one more question. How would the capital adequacy ratio of Indian banks be impacted in future under Basel III? Box 11.2 provides some estimates.
BOX 11.2: BASEL III CAPITAL RAISING – IMPLICATIONS AND CHALLENGES
What is the size of the additional capital required to be raised by Indian banks? It depends on the assumption made, and there are various estimates floating around. The Reserve bank has made some quick estimates based on the following two conservative assumptions covering the period to March 31, 2018: (i) risk weighted assets of individual banks will increase by 20 per cent per annum; and (ii) internal accruals will be of the order of 1 per cent of risk weighted assets.
Reserve Bank’s estimates project an additional capital requirement of ₹5 trillion, of which non-equity capital will be of the order of ₹3.25 trillion while equity capital will be of the order of ₹1.75 trillion (See Table on p. 398).
Additional (over and above internal accruals)Common Equity Requirements of Indian Banks under Basel III (estimates) (₹billion)

The additional equity capital requirement of the order of ₹1.75 trillion raises two questions. First, can the market provide capital of this size?
Second, what will be the burden on the Government in capitalizing public sector banks (PSBs) and what are its options?
Let us turn to the first question, whether the market will be able to provide equity capital of this size. The amount the market will have to provide will depend on how much of the recapitalization burden of PSBs the Government will meet. Data in the above Table indicate that the amount that the market will have to provide will be in the range of ₹700 billion –₹1 trillion depending on how much the Government will provide. Over the last five years, banks have raised equity capital to the tune of ₹520 billion through the primary markets. Raising an additional ₹700 billion ₹1 trillion over the next five years from the market should therefore not be an insurmountable problem. The extended period of full Basel III implementation spread over five years gives sufficient time to banks to plan the time-table of their capital rising over this period.
Moving on to the second question of the burden on the Government which owns 70 per cent of the banking system. If the Government opts to maintain its shareholding at the current level, the burden of recapitalization will be of the order of ₹900 billion; on the other hand, if it decides to reduce its shareholding in every bank to a minimum of 51 per cent, the burden reduces to under ₹700 billion.
Clearly, providing equity capital of this size in the face of fiscal constraints poses significant challenges. A tempting option for the Government would be to issue recapitalization bonds against common equity infusion. But this will militate against fiscal transparency. In the alternative, would the Government be open to reducing its shareholding in PSBs to below 51 per cent? If the Government decides to pursue this option, an additional consideration is whether it will amend the statute to protect its majority voting rights.
SECTION IV
ILLUSTRATIVE PROBLEMS ON CALCULATING CAPITAL ADEQUACY
Illustration 11.7 will help to understand the mechanics. Note that, operational risk has been ignored for the purpose of these examples.
ILLUSTRATION 11.733
A bank has the following position.
| Details | Amount (₹ in Crores) |
| Cash and balances with RBI | 200.00 |
| Bank balances | 200.00 |
| Investments | |
| Held for trading | 500.00 |
| Available for sale | 1,000.00 |
| Held to maturity | 500.00 |
| Advances (net) | 2,000.00 |
| Other assets | 300.00 |
| Total assets | 4700.00 |
The ₹2,000 crores investments of the bank relate to the following counter parties.
| Government | ₹1,000 crores |
| Banks | ₹500 crores |
| Others | ₹500 crores |
Further break up of the investments is as follows:
Government securities
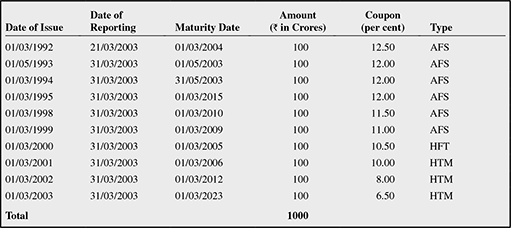
Bank bonds

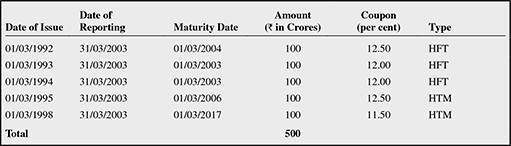
Step 1: Calculate risk-weighted assets for credit risk, which implies excluding securities held under trading book. In this case, the trading book would be ₹1,500 crores (₹700 crores of government securities + ₹500 crores of bank bonds + ₹300 crores of others—arrived at by excluding HTM securities). The credit risk would be computed after excluding the trading book as follows:
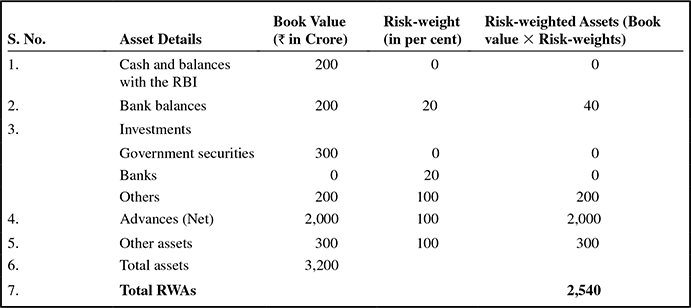
Step 2: Calculate risk-weighted assets for market risk. This comprises computing capital charge for specific risk for (see table on specific risks given in the RBI circular) the following:
- Government securities—₹700 crores-nil.
- Banks—to be grouped according to residual term to final maturity.
- Others—₹300 crores with capital charge of 9 per cent = ₹27 crores

Therefore, specific risk in trading book can be consolidated as (i) 1 (ii) 1 (iii) = 0 + 5.325 + 27 = ₹32.33 crores
Step 3: Compute general market risk.
Modified duration is used to arrive at the price sensitivity of an interest rate related instrument. For all the securities listed below, date of reporting is taken as 31 March 2003.
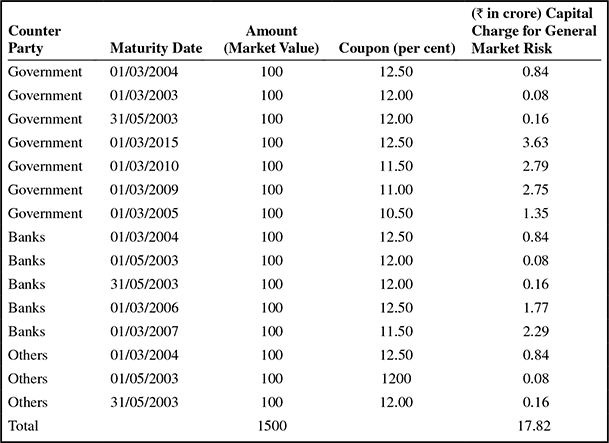
Step 4: Consolidate general and specific risks to give the total capital charge for the trading book of interest rate related instruments. Thus, total capital charge for market risks = ₹32.33 crores + ₹17.82 crores = ₹50.15 crores.
Step 5: Compute the CRAR for the banking book as well as the trading book, in short, for the assets of the bank. For this purpose, the capital charge as above needs to be converted into equivalent risk-weighted assets. In India, the minimum CRAR is 9 per cent. Therefore, the capital charge is converted to risk-weighted assets by multiplying the capital charge by the factor (100/9). Accordingly, the risk-weighted assets for market risk in the example is 50.15 × (100/9) = ₹557.23 crores. The capital ratio would stand at 12.91 per cent, calculated as follows:
| Sl. No. | Details | Amount (₹ in crore) |
|---|---|---|
| 1. | Total capital | 400 |
| 2. | Risk-weighted assets for credit risk | 2,540.00 |
| 3. | Risk-weighted assets for market risk | 557.23 |
| 4. | Total risk-weighted asses (2 + 3) | 3,097.23 |
| 5. | CRAR [(1 ÷ 4) × 100] | 12.91% |
ILLUSTRATION 11.8
Assume that, in the above example, the assets of the bank include investments in ‘equities’ of ₹300 crores. The bank’s modified balance sheet would appear as follows:
Note that, the total assets have increased from the earlier ₹4,700 crores to ₹5,000 crores due to the investment in equities.
In addition, assume:
- foreign exchange open position limit at ₹60 crores
- gold open position at ₹40 crores and
- that the bank is having the following positions in interest rate related derivatives:
- Interest rate swaps (IRS),34 ₹100 crores-bank received floating rate interest and pays fixed, next interest fixing after 6 months, residual life of swap 8 years and
- long position in interest rate future (IRF), ₹50 crores, delivery after 6 months, life of underlying government security 3.5 years.
Thus, in terms of counter parties, the investments are assumed to be as under:
-
Interest rate related securities (as in Illustration 11.7)
Government—₹1,000 crores
Banks —₹500 crores
Others—₹500 crores
Equities
Others—₹300 crores
Note: The composition of interest rate related securities remain as in Illustration 11.5.
Steps for Computing Risk-Weighted Assets
Step 1: Risk-weighted assets for credit risk
As per the guidelines, ‘held for trading’ and ‘available for sale’ securities are to be categorized as trading book. Thus, trading book in respect of interest rate related investments in this case would continue to be ₹1,500 crores as in Illustration 11.7. In addition, equities position of ₹300 crores would be in the trading book. The derivative products held by banks are to be considered as part of the trading book. Open position on foreign exchange35 and gold also would be considered for market risk. While computing the capital charge for credit risk, the securities held under trading book would be excluded and hence, the credit risk based risk-weights would be as under:
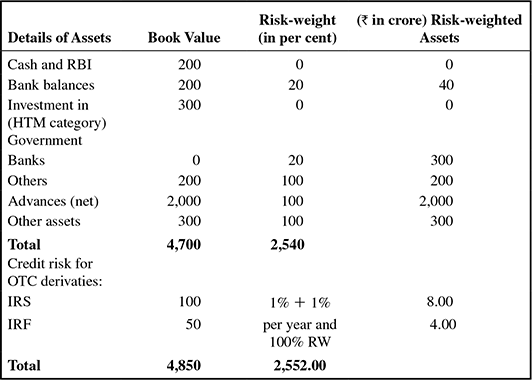
Hence, the risk-weighted assets have increased from ₹2,540 crores in Illustration 11.5 to ₹2,552 crores, due to the credit risk in respect of OTC derivative.
Step 2: As in Illustration 11.7, we now calculate the risk-weighted assets for market risk.
- Specific risk
We have seen in Illustration 11.7 that the specific risk for interest rate related instruments was ₹32.33 crores.
Additionally, we will now have to consider the capital charge of 9 per cent on equities of ₹300 crores held in the trading book, which amounts to ₹27 crores.
Thus, capital charge for specific risk in the trading book now stands at ₹59.33 crores (₹32.33 crores + ₹27 crores).
- General market risk
As in Illustration 11.7, modified duration is used to arrive at the price sensitivity of interest rate related instruments and therefore, the capital charge remains at ₹17.82 crore.
Additionally, we will have to calculate the capital charge for positions in respect of interest rate related derivatives.
- Interest rate swap

- Interest rate futures

- Example for computing the capital charge including the vertical and horizontal disallowances on interest rate related instruments. (Please see Box 11.3, for better understanding).

BOX 11.3 COMPUTING VERTICAL AND HORIZONTAL DISALLOWANCE FOR INTEREST RATE DERIVATIVES
- Calculation of vertical disallowance
While calculating capital charge for general market risk on interest rate related instruments, banks should recognize the basis risk (different types of instruments whose price responds differently for movement in general rates) and gap risk (different maturities within time bands).This is addressed by a small capital charge (5 per cent) on matched (off-setting) positions in each time band (‘vertical disallowance’). An off-setting position, for vertical disallowance, will be the sum of long positions and/or the short positions within a time band, whichever is lower. In the above example, except for the time band 3 to 6 months in zone 1 and the time band of 7.3 to 9.3 years, where there are off-setting positions of (–) 045 and 2.79, there is no off-setting position in any other time band. The sum of long positions in the 3–6 months time band is +0.47 and the sum of short positions in this time band is (–) 0.45. This off-setting position of 0.45 is subjected to a capital charge of 5 per cent, i.e., 0.0225. The sum of long positions in the 7.3 to 9.3 year time band is + 2,79 and the sum of short positions in this time band is (–) 3.08. This off-setting position of 2.79 is subjected to a capital charge of 5 per cent, i.e., 0.1395. It may be mentioned here, that if a bank does not have both long and short positions in the same time band, there is no need for any vertical disallowance.
- Calculation of horizontal disallowance
While calculating capital charge for general market risk on interest rate related instruments, banks must subject their positions to a second round of off setting across time bands with a view to give recognition to the fact that interest rate movements are not perfectly correlated across maturity bands (yield curve risk and spread risk), i.e., matched long and short positions in different time bands may not perfectly off set. This is achieved by a ‘horizontal disallowance’. An off-setting position for horizontal disallowance will be the sum of long positions and/or the short positions within a zone, whichever is lower. In the above example, except in zone 3 (7.3 to 9.3 years), where there is an off setting (matched) position of (–) 0.29, there is no off setting position in any other zone. The sum of long positions in this zone is 10.81 and the sum of short positions in this zone is (–) 0.29. This off setting position of 0.29 is subject to horizontal disallowance as under:
Within the same zone (zone 3) 30 per cent of 0.29 = 0.09
Between adjacent zones (zone 2 and 3) Nil
Between zone 1 and zone 3 Nil
Similar to the case of vertical disallowance, if a bank does not have both long and short positions in different time zones, there is no need for any horizontal disallowance.
Banks in India are not allowed to take any short position in their books except in derivatives. Therefore, banks in India will generally not be subject to horizontal or vertical disallowance unless they have short positions in derivatives.
- Total capital charge for interest rate related instruments
For over all net position 16.89 For vertical disallowance 0.16 For horizontal disallowance in zone 3 0.09 For horizontal disallowance in adjacent zones Nil For horizontal disallowance between zone 1 and 3 Nil Total capital charge for interest rate related instruments 17.14
Let us summarize the above process:
- Price sensitivities have been slotted into a duration based ladder with 15 time bands.
- Long and short positions within a time band have been subjected to vertical disallowance of 5 per cent. In this case, vertical disallowance is applicable only under 3 to 6 month and 7.3 to 9.3 year time bands.
- Net positions in each time band have been arrived at for horizontal off-setting subject to the disallowances mentioned in tables given above. In this case, horizontal disallowance is applicable only in respect of zone 3 and not in respect of adjacent zones.
The total capital charge for general market risk for interest rate related instruments is thus computed as shown below.
Step 3: Compute capital charge for market risks by consolidating the following:
- Capital charge for specific and general market risks for interest rate related instruments.
- Capital charge on equities for specific and general market risks.36
- Capital charge for general market risk37 in respect of open position of foreign exchange and gold.
| Details | Capital Charge for Specific Risk | Capital Charge for General Market Risk |
|---|---|---|
| Interest rate related | 32.33 | 17.14 |
| Equities | 27.00 | 27.00 |
| Forex/Gold | 9.00 | |
| Total | 59.33 | 59.33 |
Thus, total capital charge for market risk (general and specific) is ₹112.47 crores.
Step 4: We can now compute the capital ratio. To facilitate computation of CRAR for the whole book, this capital charge for market risks in the trading book needs to be converted into equivalent risk-weighted assets. Since a CRAR of 9 per cent is required, the capital charge could be converted to risk-weighted assets by multiplying the capital charge by (100/9), i.e., ₹112.47 × (100/9) = ₹1,249.67 crores. Therefore, riskweighted assets for market risk is ₹1,249.67 crores.
| Sl. No. | (₹ in Crore) | |
|---|---|---|
| 1. | Total capital | 400 |
| 2. | Risk-weighted assets for credit risk | 2,552,00 |
| 3. | Risk-weighted assets for market risk | 1,249.67 |
| 4. | Total risk-weighed assets (2 + 3) | |
| 5. | CRAR [(1 × 4) × 100] | 10.52% |
CHAPTER SUMMARY
- Banking is undoubtedly one of the most regulated industries globally and the rules governing bank capital are one of the most prominent aspects of such regulation. The higher the capital, the higher the number of problem assets that can default before the capital is fully depleted. Thus, greater the bank’s capital funds, greater the amount of assets that can default before the bank becomes technically insolvent and lower the bank’s risk.
- Capital for a bank also serves other functions. When a bank has adequate capital, it has ready access to the financial markets, since investors look upon it as a safe investment option. The bank can enter new businesses and can indulge in risk taking to boost earnings potential.
- Financial risk is inherent to banking business, quite incomparable with the traditional manufacturing firms. Hence, only if banks have low risk assets can they remain safe. In practice, however, banking assets are risky. Therefore, banks should increase capital relative to the risks of the assets they hold.
- One aspect of bank regulation is to ensure that depositors who do not need to withdraw at present are given enough assurance that they will be paid in the future. Depositors need assurance that the bank has enough (claims on) liquid assets to meet all demands made by depositors. There are four ways to provide this assurance—adequate bank equity capital, deposit insurance, lender of last resort and subordinated debt. Lack of assurance can lead to bank failures and outcomes that are not welfare maximizing. These assurances have an economic role in providing optimal outcomes and therefore, need to be formulated with utmost care.
- Accounting definition of bank capital is different from the definition of ‘economic capital’ and regulatory capital in banks.
- Economic Capital is the amount of capital considered necessary to absorb potential losses associated with banking risks.
- Regulatory capital, though seen to constrain growth to some extent, reduces the risk of banks expanding beyond their ability or taking undue risks. Regulators include certain forms of debt and loss reserves while measuring capital funds in banks.
- The international convergence of bank capital regulation began with the 1988 Basel Accord on capital standards. The G10 countries signed the accord, which was then intended to apply to only internationally active banks. At that time, its focus was the measurement of capital and the definition of capital standards for credit risk Since then the Accord has been amended several times having been endorsed by the central banks of many countries and adopted by several banks across the globe.
- The Accord currently under implementation in various countries is Basel III, which makes an effort to fix the lacunae in Basel II that came to light during the financial crisis as also to reflect other lessons of the crisis. Basel III builds on the essence of Basel II—the link between the risk profiles and capital requirements of individual banks. In that sense, Basel III can be considered an enhancement of Basel II.
- The enhancements of Basel III over Basel II are primarily in four areas: (i) augmentation in the level and quality of capital; (ii) introduction of liquidity standards; (iii) modifications in provisioning norms; and (iv) better and more comprehensive disclosures. It is noteworthy that Basel III has concentrated on capital definition (the numerator of the capital adequacy ratio), with minimal enhancements in the risk measurements ( denominator of capital adequacy ratio).
- The minimum capital requirement will now take into account market risks and operational risks, along with credit risks. It also proposes differentiated approaches to measurement of capital ranging from basic to advanced. To calculate capital for credit risk, banks can adopt (1) the standardized approach, (2) the IRB foundation and advanced approach and (3) securitization approach depending on the strength of their internal risk management systems. Similarly, capital for market risk can be maintained on the basis of (1) the standardized approach (maturity method), (2) the standardized approach (duration method) and (3) the internal models method. Capital required for operational risk can be gauged through the following methods ranging from (1) the basic indicator approach, (2) the standardized approach, and (3) the advanced measurement approach (AMA).
- The essential difference between Basel II and III Tier 1 and Tier 2 capital is that: (a) Under Basel II, qualifying tier 1 and Tier 2 capital was determined on the basis of ‘gross’ instruments, before deduction of various items that could reduce the amount of capital available to withstand credit and other shocks, and (b) Under Basel III, banks would determine available Tier 1 and Tier 2 capital only after deductions are made.
- Further, within Tier 1 capital, there is a distinction made between the components of Common Equity Tier 1 and Additional Tier 1 Capital instruments.
- Basel III also requires buffers such as Capital conservation and countercyclical buffers to be kept as part of capital. A leverage ratio has also been introduced.
- Basel III introduces a new liquidity standard through two liquidity ratios.
- The Liquidity Coverage Ratio (LCR) is designed to improve the short term resilience of the liquidity risk profile of banks. It requires banks to hold a buffer of ‘high quality’ liquid assets to match net liquidity outflows during a 30 day period of stress

- The Net Stable Funding Ratio (NSFR) is designed to promote resilience in the longer term. It requires that banks fund their activities with more stable sources of funding on an ongoing basis.
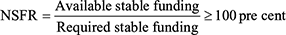
- The Liquidity Coverage Ratio (LCR) is designed to improve the short term resilience of the liquidity risk profile of banks. It requires banks to hold a buffer of ‘high quality’ liquid assets to match net liquidity outflows during a 30 day period of stress
- The capital ratio can be expressed as follows:
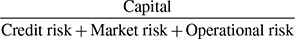
- Extensive changes are being made by the Basel Committee in risk measurement - the denominator of the capital ratio. These changes are being called Basel IV or Basel 3.5. Simultaneously, changes are being made in global accounting standards.
- In India, the Narasimham Committee had submitted its report on banking reforms in the early 1990s. The Committee had observed that the capital ratios of Indian banks were generally low and that some banks were seriously undercapitalized. The Basel framework was adopted by the RBI. prescribing a higher norm of 9 per cent on riskweighted assets (as against 8 per cent by the Basel Accord) for all banks operating in India. The aggregate of Tier 1 and Tier 2 capital forms the total capital funds for banks for the purpose of computing ‘capital adequacy’.
- Banks in India are currently following the Standardized approach for credit risk, the Standardized approach (modified duration) for market risk and the Basic Indicator approach for operational risk.
- Banks in India are required to maintain a Tier 1 capital ratio of at least 6 per cent, and a total capital to Risk Weighted Assets ratio of at least 9 per cent. The Common Equity Tier 1 capital should be at least 5.5 per cent of Risk Weighted Assets.
- Banks in India are reporting minimum capital under Basel III beginning April 1, 2013.
TEST YOUR UNDERSTANDING
- Rapid fire questions
Answer ‘True’ or ‘False”
- Bank failures are often triggered by the inability of banks to repay their creditors on time.
- Bank capital reduces risk of failure by providing protection against expected losses.
- Commercial banks typically operate with more leverage than non financial firms.
- The greater the banks’ capital funds, the lower the amount of assets that can default before the bank becomes technically insolvent.
- Regulating the amount of capital banks hold can constrain growth.
- Economic capital and accounting capital of banks are the same.
- Regulatory bank capital and economic bank capital are different.
- The Bank for international settlements can accept deposits from corporate bodies.
- The numerator of the capital adequacy ratio is risk weighted assets.
- The denominator of the capital adequacy ratio is total assets.
Check your score in Rapid fire questions
- Fill in the blanks with appropriate words and expressions
- The risk that the other party in an agreement will default is called the ————— risk.
- Risks that result from price changes in the money and capital markets is called ————— risk.
- Pillar 1 of Basel II and III is ————— requirements.
- Pillar 2 of Basel II and III is the ————— process.
- Pillar 3 of Basel II and III is ————— discipline and disclosure.
- Capital conservation buffer was required at ————— % of risk weighted assets in Basel II.
- Counter cyclical capital buffer was introduced in Basel —————.
- The denominator of the leverage ratio is —————.
- The requirement of capital for systematically important financial institutions was ————— % under Basel II.
- Basel III introduced two liquidity ratios under new liquidity standards. They are the ————— ratio and the ————— ratio.
- Expand the following abbreviations in the context of the Indian financial system
- NSFR
- LCR
- CET1
- BIS
- BCBS
- CCB
- CCCB
- SIFI
- CRAR
- PNCPS
- Test your concepts and application
- Compare accounting capital, economic capital and regulatory capital. Which type of capital will reflect a realistic picture of the bank’s capability of protecting itself against all risks? Support your choice with valid arguments.
- Why does capital limit the ability of banks to make loans? Is risk-weighted capital a better measure of capital adequacy?
- Analysts opine that risk-based capital requirements will force banks to raise their rates of lending. Let us assume that Bank A prices its loans to earn an ROE of 15 per cent. Will the allocation of capital to a loan affect loan pricing?
- Consider the following shifts in asset composition in Bank A. How will the shift affect (a) the bank’s capital requirement? (b) the bank’s profit potential?
- From auto loans to home loans
- From investment in government securities to project financing
- From corporate lending to investment in government securities
- From investment in project bonds to investment in money market instruments
- The capital of Bank B on 31 March 2016 was ₹1,000 crores. The bank’s balance sheet carried total assets of ₹10,000 crores, which translated into risk-weighted assets of ₹7,000 crores. The bank desires an ROA of 2 per cent at the end of 31 March 2017. It also expects to add ₹2,000 crores of assets to the balance sheet during 2016–17.
- If the bank wishes to maintain the existing capital adequacy ratio, what is the probable maximum addition to the risk-weighted assets?
- Assume that the incremental assets are totally financed by incremental liabilities of the same amount, which are subjected to reserve requirements of 5 per cent CRR and 25 per cent SLR. If the bank targets a capital adequacy ratio of 16 per cent by the end of March 2017, what would be the minimum addition to off-balance sheet items (non-funded assets) if the incremental assets carry 100 per cent risk-weight?
- Bank C wants to grow during the next year, but does not want to add fresh capital. In the current year, it expects an ROA of 1.5 per cent and an Equity-to-asset ratio of 9 per cent. It also plans a dividend payout ratio of 25 per cent. By how much can the bank’s assets grow under these expectations? If the bank plans to add capital to the extent of 1 per cent of its total assets, what would be the growth in assets? Assume that there is no change in the expected earnings.
TOPICS FOR FURTHER DISCUSSION
- Would increased regulatory capital requirements lead to more consolidation among banks?
- What are the possible consequences of Indian banks’ need for huge capital in the next few years (as required by Basel III)?
- What are the consequences of bank failure?
- Compare the regulatory capital and accounting capital of all banks operating in India. What are your conclusions? Do you think regulatory capital provides an effective cushion against all risks?
- What would be the effects on government ownership in public sector banks as banks in India migrate to more advanced methods of capital adequacy calculations?
SUGGESTIONS FOR FURTHER READING
- The chapter provides a mere bird’s eye view into the current regulatory aspects in banking. A thorough reading of the Basel Committee standards and the RBI’s adaptation to banks in India through its Master Circulars would provide more insight into each of the aspects discussed in the chapter.
ANNEXURE I
DETERMINATION OF RISK WEIGHTED ASSETS UNDER THE BASEL NORMS38
The total minimum capital requirement for credit, market and operational risks is calculated using the definition of regulatory capital as defined in the Basel document and risk-weighted assets. The total ‘capital to risk-weighted assets’ ratio must be no lower than 8 per cent.
Total risk-weighted assets are determined by multiplying the capital requirements for market risk and operational risk by 12.5 (the reciprocal of the minimum capital ratio of 8 per cent) and adding the resulting figures to the sum of risk-weighted assets for credit risk.
Capital for Credit Risk The ‘standardized approach’ for credit risk in its current form retains some part of the 1988 Accord, such as the definition of ‘capital’. Its novelty lies in replacing the existing risk-weighting scheme by a system where risk-weights are determined by the borrower’s rating, defined by an external credit rating agency such as Standard and Poor’s or Moody’s or by Export Credit Agencies (ECAs) recognized by the respective country’s central bank. Banking book39 exposures are risk-weighted based on ratings by the external agencies in specified cases as follows: (See Chart 11.1) However, some of the processes outlined below would be undergoing modifications under the new standards being finalized, as stated in Section II of this chapter.
- Claims on sovereigns and their central banks are assigned risk-weights ranging from 150 per cent for a below B-ratings40 to 0 per cent for an AAA to AA rated country. Unrated sovereigns attract a risk-weight of 100 per cent.
- Claims on the Bank for International Settlements, the International Monetary Fund, the European Central Bank and the European Community may be assigned a 0 per cent risk-weight.
- Claims on public sector entities will be riskweighted at the country’s discretion or can also be treated at par with the risk-weight for claims on the sovereign.
- Multilateral development banks (MDBs) that are highly rated are eligible for a 0 per cent risk-weight.41 Such eligibility will be evaluated on a case-to-case basis.
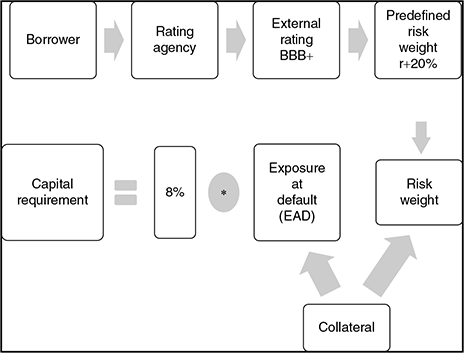
- In the case of claims on banks, there are two options presented for risk-weighting. Under the first option, all banks in a country will be assigned a risk-weight one category less favourable than that assigned to claims on the sovereign of that country. The second option bases the risk-weighting on the external credit assessment of individual banks in the country, with unrated banks risk-weighted at 50 per cent.
- Claims on securities firms are to be treated as claims on banks, provided such firms are subject to strict supervisory and regulatory arrangements. If not, such claims would follow the rules for claims on corporates.
- Claims on corporates, including insurance companies, cannot be assigned a risk-weight preferential to that of its country of incorporation. The central banks also have the discretion to permit banks to risk-weight corporate claims at 100 per cent without regard to external ratings.
- Retail exposures may be risk-weighed at 75 per cent on a uniform basis. However, central banks may increase these risk-weight based on the default experience.
- Claims on residential property may be assigned a risk-weight of 35 per cent only, provided the valuation is fair and substantial security exists over and above the loan amount. Based on prior default experience, central banks may increase the riskweights appropriately. However, considering the volatility in commercial real estate, the Committee proposes a 100 per cent risk-weight for mortgages and commercial real estate loans.
- In addition, the Committee has proposed high risk-weights (ranging from 150 per cent to 350 per cent) on certain categories of claims.
- In all other cases not specified by the standardized approach, the risk-weights as presently applicable would continue.
- Off-balance sheet items under the standardized approach will be converted into credit exposure equivalents through Credit Conversion Factors (CCFs). Commitments with an original maturity of up to 1 year and those with original maturity over 1 year will receive a CCF of 20 per cent and 50 per cent, respectively. However, any commitments that can be unconditionally cancelled at any time by the bank without prior notice or that which can effectively provide for automatic cancellation due to deterioration in a borrower’s creditworthiness will receive a 0 per cent CCF. A CCF of 100 per cent will be applied to the lending of banks’ securities or the posting of securities as collateral by banks, including instances where these arise out of repo-style transactions (i.e., repurchase/reverse repurchase and securities lending/securities borrowing transactions).
- Where Credit Risk Mitigation42 (CRM) techniques such as (a) collateralized transactions, (b) on-balance sheet netting and (c) guarantees and credit derivatives exist, lower capital may be maintained, provided certain conditions are fulfilled. While the use of such risk mitigation techniques reduce or transfer credit risk, they may simultaneously increase other residual risks, which could include legal, operational, liquidity and market risks. Where such residual risks are not adequately controlled, the central bank may impose additional capital charges under Pillar 2.
- To determine minimum capital requirement for a bank, a four step process is to be followed.
- Classify assets into risk categories and assign risk-weights.
- Convert off-balance sheet commitments and guarantees to a notional on balance sheet ‘credit equivalent’ (using CCF) and classify these in the appropriate risk categories.
- Multiply the rupee amount of assets in each risk category by the appropriate risk-weight. The result equals ‘risk-weighted assets’.
- Multiply the risk-weighted assets by the minimum capital percentages required for it to be adequately capitalized. Compare this with the existing capital on the bank’s balance sheet.
The process ensures that assets with the highest perceived risk have the highest risk-weights and hence require the most capital. Another important feature of the risk-based standards is that a bank’s off-balance sheet items should be supported by adequate capital. These items, called ‘contingent liabilities’ are exposures that could arise in future if counterparties do not meet their commitments. Hence, banks that expose their operations to risk by offering letters of credit or guarantees or participating in forward or futures transactions must hold capital against the possible future exposure.
The Internal Ratings Based (IRB) Approach to Credit Risk Under this advanced approach, banks can use their internal estimates of borrower creditworthiness to assess the credit risk in their portfolio, subject to stringent methodological and disclosure standards. Distinct analytical frameworks are applicable to different types of loan exposures whose loss characteristics are different.
These banks may rely on their own internal estimates of risk components in determining the capital requirement for a given exposure. The risk components include measures of the following:
- Probability of Default (PD)
- Loss Given Default (LGD)
- Exposure at Default (EAD)
- Effective Maturity (M)
In some cases, banks may be required to use values prescribed by supervisors in lieu of internal estimates for some of the risk components. The IRB approach is based on measures of Unexpected Losses (UL) and Expected Losses (EL). The risk-weight functions account for capital for the UL portion.
Under the IRB approach, banks would categorize banking book exposures into broad classes of assets with different underlying risk characteristics, such as: (a) corporate, (b) sovereign, (c) bank, (d) retail, and (e) equity. Within each asset class, sub-classes of specialized lending are identified. For each of the asset classes covered under the IRB framework, there are three key elements.
- Risk components—estimates of risk parameters provided by banks some of which are supervisory estimates
- Risk-weight functions—the means by which risk components are transformed into risk-weighted assets and therefore capital requirements
- Minimum requirements—the minimum standards that must be met in order for a bank to use the IRB approach for a given asset class
For many of the asset classes, the Committee has made available two broad approaches: foundation and advanced. Under the foundation approach, banks generally provide their own estimates of PD and rely on supervisory estimates for other risk components. Under the advanced approach, banks provide more of their own estimates of PD, LGD and EAD and their own calculation of M, subject to meeting minimum standards.
For both the foundation and advanced approaches, banks must always use the risk-weight functions provided in this framework for the purpose of deriving capital requirements. The derivation of risk-weighted assets is dependent on estimates of the PD, LGD and EAD. The process outlined in the above paragraphs is also being modified in the revised standards as stated in Section II.
Credit Risk—The Securitization Framework
The revised securitization framework has been briefly described in Section II
Section II briefly describes the updated standards of the BCBS with regard to capital requirement of market risk.
The standard includes an internal models approach and a standardised approach to measuring market risk capital requirements.
In June 2017, the BCBS has published a consultative document for further simplifying the standardized approach for market risk
Capital Requirement for Interest Rate (Market) Risk
Credit risk or default risk is not the only risk borne by banks’ assets. With banks resorting increasingly to treasury operations, they assume interest rate risk or market risk.
The Basel Committee defines market risk as “the risk of losses in on- and off-balance sheet positions arising from movements in market prices.” The risks subject to this requirement are:
- The risks pertaining to interest rate related instruments and equities in the trading book.
- Foreign exchange risk and commodities risk throughout the bank.
Hence, market risk is the risk of loss to the bank from fluctuations in interest rates, equity prices, currency rates, commodity prices, as well as exposure to specific risk associated with the composition of the bank’s investment portfolio. The sensitivity of the bank’s trading assets (and liabilities) to the volatilities of the above rates and prices, exposes the bank to market risk.
Therefore, it is prudent for banks to measure market risk and hold adequate capital for exposure to market risk.
Capital Requirement for Operational Risk
Operational risk is defined as the risk of loss resulting from inadequate or failed internal processes, people and systems or from external events. The Basel Committee definition includes legal risk, but excludes strategic and reputation risk.
The framework presents three methods for calculating operational risk capital charges in a continuum of increasing sophistication and risk sensitivity.
- The basic indicator approach,
- The standardized approach, and
- Advanced measurement approaches (AMA)
The Basic Indicator Approach Banks using the basic indicator approach must hold capital for operational risk equal to the average over the previous 3 years of a fixed percentage (denoted alpha) of positive annual gross income. Figures for any year in which annual gross income is negative or zero, should be excluded from both the numerator and denominator when calculating the average. The charge is expressed as follows:
where KBIA = the capital charge under the basic indicator approach
GI = annual gross income, where positive, over the previous 3 years
n = number of the previous 3 years for which gross income has been positive
α = 15 per cent, which is set by the com-mittee, relating the industry wide level of required capital to the industry wide level of the indicator
Gross income is defined as net interest income plus net non-interest income. It is intended that this measure should: (a) be gross of any provisions (e.g., for unpaid interest), (b) be gross of operating expenses, including fees paid to outsourcing service providers, (c) exclude realized profits/losses from the sale of securities in the banking book, and (d) exclude extraordinary or irregular items as well as income derived from insurance.
The Standardized Approach In the ‘standardized approach’, banks’ activities are divided into eight business lines: corporate finance, trading and sales, retail banking, commercial banking, payment and settlement, agency services, asset management and retail brokerage. Within each business line, gross income is a broad indicator that serves as a proxy for the scale of business operations and thus, the likely scale of operational risk exposure within each of these business lines. The capital charge for each business line is calculated by multiplying gross income by a factor (denoted beta) assigned to that business line. Beta serves as a proxy for the industry-wide relationship between the operational risk loss experience for a given business line and the aggregate level of gross income for that business line. It should be noted that in the standardized approach gross income is measured for each business line, not the whole institution, i.e., in corporate finance, the indicator is the gross income generated in the corporate finance business line.
Advanced Measurement Approach (AMA) Under the AMA, the regulatory capital requirement will equal the risk measure generated by the bank’s internal operational risk measurement system using the quantitative and qualitative criteria for the AMA. AS stated in Section II, BCBS is proposing to remove AMA and introduce a Standardized Measurement Approach (SMA).
The SMA builds on the simplicity and comparability of a standardised approach, and embodies the risk sensitivity of an advanced approach.
GUIDELINES FOR OPERATIONAL RISK MANAGEMENT
Relevant Excerpts from the Report on ‘Sound Practices for the Management and Supervision of Operational Risk’, Published by the Basel Committee on Banking Supervision in February 2003
Deregulation and globalization of financial services, together with the growing sophistication of financial technology, are making the activities of banks and thus their risk profiles (i.e., the level of risk across a firm’s activities and/or risk categories) more complex.
Developing banking practices suggest that risks other than credit, interest rate and market risk can be substantial. Examples of these new and growing risks faced by banks include the following:
- If not properly controlled, the greater use of more highly automated technology has the potential to transform risks from manual processing errors to system failure risks, as greater reliance is placed on globally integrated systems.
- Growth of e-commerce brings with it potential risks (e.g., internal and external fraud and system security issues) that are not yet fully understood.
- Large-scale acquisitions, mergers, de-mergers and consolidations test the viability of new or newly integrated systems.
- The emergence of banks acting as large-volume service providers creates the need for continual maintenance of high-grade internal controls and back-up systems.
- Banks may engage in risk mitigation techniques (e.g., collateral, credit derivatives, netting arrangements and asset securitizations) to optimize their exposure to market risk and credit risk, but which in turn may produce other forms of risk (e.g., legal risk).
- Growing use of outsourcing arrangements and the participation in clearing and settlement systems can mitigate some risks but can also present significant other risks to banks.
The diverse set of risks listed above can be grouped under the heading of ‘operational risk’, which the Committee has defined as ‘the risk of loss resulting from inadequate or failed internal processes, people and systems or from external events’. The definition includes legal risk but excludes strategic and reputation risk.
The Committee recognizes that operational risk is a term that has a variety of meanings within the banking industry and therefore, for internal purposes, banks may choose to adopt their own definitions of operational risk. Whatever be the exact definition, a clear understanding by banks of what is meant by operational risk is critical to the effective management and control of this risk category. It is also important that the definition considers the full range of material operational risks facing the bank and captures the most significant causes of severe operational losses.
Operational risk event types that the Committee—in co-operation with the industry-has identified as having the potential to result in substantial losses include the following:
- Internal fraud. For example, intentional misreporting of positions, employee theft and insider trading on an employee’s own account.
- External fraud. For example, robbery, forgery, cheque kiting and damage from computer hacking.
- Employment practices and workplace safety. For example, workers’ compensation claims, violation of employee health and safety rules, organized labour activities, discrimination claims and general liability.
- Clients, products and business practices. For example, fiduciary breaches, misuse of confidential customer information, improper trading activities on the bank’s account, money laundering and sale of unauthorized products.
- Damage to physical assets. For example, terrorism, vandalism, earthquakes, fires and floods.
- Business disruption and system failures. For example, hardware and software failures, telecommunication problems and utility outages.
- Execution, delivery and process management. For example, data entry errors, collateral management failures, incomplete legal documentation, unapproved access given to client accounts, non-client counter party misperformance and vendor disputes.
Fundamental Principles for Operational Risk Management43
Principle 1: The board of directors should take the lead in establishing a strong risk management culture. The board of directors and senior management should establish a corporate culture that is guided by strong risk management and that supports and provides appropriate standards and incentives for professional and responsible behaviour. In this regard, it is the responsibility of the board of directors to ensure that a strong operational risk management culture exists throughout the whole organisation.
Principle 2: Banks should develop, implement and maintain a Framework that is fully integrated into the bank’s overall risk management processes. The Framework for operational risk management is chosen by an individual bank which will depend on a range of factors, including its nature, size, complexity and risk profile.
Governance
The Board of Directors
Principle 3: The board of directors should establish, approve and periodically review the Framework. The board of directors should oversee senior management to ensure that the policies, processes and systems are implemented effectively at all decision levels.
Principle 4: The board of directors should approve and review a risk appetite and tolerance statement for operational risk that articulates the nature, types, and levels of operational risk that the bank is willing to assume.
Senior Management
Principle 5: Senior management should develop for approval by the board of directors a clear, effective and robust governance structure with well defined, transparent and consistent lines of responsibility. Senior management is responsible for consistently implementing and maintaining throughout the organisation policies, processes and systems for managing operational risk in all of the bank’s material products, activities, processes and systems consistent with the risk appetite and tolerance.
Risk Management Environment
Identification and Assessment
Principle 6: Senior management should ensure the identification and assessment of the operational risk inherent in all material products, activities, processes and systems to make sure the inherent risks and incentives are well understood.
Principle 7: Senior management should ensure that there is an approval process for all new products, activities, processes and systems that fully assesses operational risk.
Monitoring and Reporting
Principle 8: Senior management should implement a process to regularly monitor operational risk profiles and material exposures to losses. Appropriate reporting mechanisms should be in place at the board, senior management, and business line levels that support proactive management of operational risk.
Control and Mitigation
Principle 9: Banks should have a strong control environment that utilises policies, processes and systems; appropriate internal controls; and appropriate risk mitigation and/or transfer strategies.
Business Resiliency and Continuity
Principle 10: Banks should have business resiliency and continuity plans in place to ensure an ability to operate on an ongoing basis and limit losses in the event of severe business disruption.
Role of Disclosure
Principle 11: A bank’s public disclosures should allow stakeholders to assess its approach to operational risk management.
The key findings of a review undertaken by BCBS in October 2014 revealed that overall, banks have made insufficient progress in implementing the Principles originally introduced in 2003 and revised in 2011. Many banks are still in the process of implementing various principles.
RBI Guidelines to Banks in India on Operational Risk Management On the basis of the Basel Committee’s guidelines, the RBI has framed draft guidelines in March 2005 on operational risk measurement and management for adoption by banks in India by March 2007. Three options had been put forth by the Basel Committee for calculating capital charge for operational risk. These are, in the order of increasing complexity, (a) the basic indicator approach, (b) the standardized approach and (c) advanced management approaches (AMAs).
Though the RBI proposes to initially allow banks to use the basic indicator approach for computing regulatory capital for operational risk, banks are expected to move along the range toward more sophisticated approaches as they develop more sophisticated operational risk management systems and practices which meet the prescribed qualifying criteria.
As a point of entry for capital calculation, no specific criteria for use of the Basic Indicator Approach are set out in the guidelines.
Banks using this approach are to comply with the Basel Committee’s guidance on ‘Sound Practices for the Management and Supervision of Operational Risk’, February 2003 and the ‘Guidance Note on Management of Operational Risk’, issued by the Reserve Bank of India in October, 2005.
Once the bank has calculated the capital charge for operational risk under BIA, it has to multiply this with 12.5 and arrive at the notional risk weighted asset (RWA) for operational risk.
Section II has briefly described the changes to be effected in operational risk measurement by the BCBS. RBI guidelines in this regard are awaited.
As a point of entry for capital calculation, no specific criteria for use of the Basic Indicator Approach are set out in the guidelines.
Banks using this approach are to comply with the Basel Committee’s guidance on ‘Sound Practices for the Management and Supervision of Operational Risk’, February 2003 and the ‘Guidance Note on Management of Operational Risk’, issued by the Reserve Bank of India in October, 2005.
Once the bank has calculated the capital charge for operational risk under BIA, it has to multiply this with 12.5 and arrive at the notional risk weighted asset (RWA) for operational risk.
Section II has briefly described the changes to be effected in operational risk measurement by the BCBS. RBI guidelines in this regard are awaited
Relevant Excerpts from the ‘Draft Guidance Note on Management of Operational Risk’ Published on 11 March 2005, by the RBI
The Basic Indicator Approach At the minimum, all banks in India should adopt this approach while computing capital for operational risk while implementing Basel II. Under the basic indicator approach, banks have to hold capital for operational risk equal to a fixed percentage (alpha) of a single indicator, which has currently been proposed to be ‘gross income’. This approach is available for all banks irrespective of their level of sophistication. The charge may be expressed as follows:
Where, KBIA = the capital charge under the basic indicator approach
GI = annual gross income, where positive, over the previous × years,
α = 15 per cent set by the committee, relating the industry-wide level of required capital to the industry-wide level of the indicator.
n = number of the previous 3 years for which gross income is positive.
The Basel Committee has defined gross income as net interest income and has allowed each central bank to define gross income in accordance with the prevailing accounting practices. Accordingly, gross income has been defined as follows by the RBI.
Gross income = Net profit (+) Provisions and Contingencies (+) Operating expenses (Schedule 16) (–) Profit on sale of HTM investments (–) Income from insurance (–) Extraordinary/ irregular item of income (+) Loss on sale of HTM investments.
Advanced Measurement Methodologies
The standardized approach. Under the standardized approach, banks’ activities are divided into eight business lines against each of which, a broad indicator is specified to reflect the size or volume of banks’ activities in that area. Table 11.17 shows the proposed business lines and indicator.
Within each business line, the capital charge is calculated by multiplying the indicator by a factor (beta) assigned to that business line. Under this approach, the gross income is measured for each business line and not for the whole institution. However, the summation of the gross income for the eight business lines should aggregate to the gross income of the bank as computed under the basic indicator approach. The total capital charge under the standardized approach is calculated as the simple summation of the regulatory capital charges across each of the business lines.

The total capital charge may be expressed as follows:
Where KTSA = the capital charge under the standardized approach
GI1-8 = annual gross income in a given year, for each business lines
β1-8 = a fixed percentage, set by the committee, relating the level of required capital to the level of the gross income for each of the eight business lines
The alternative standardized approach (ASA): At national supervisory discretion, a supervisor can choose to allow a bank to use the alternative standardized approach (ASA) provided the bank is able to satisfy its supervisor that this alternative approach provides an improved basis by, for example, avoiding double counting of risks. Once a bank has been allowed to use the ASA, it will not be allowed to revert to use of the standardized approach without the permission of its supervisor. It is not envisaged that large diversified banks in major markets would use the ASA. Under the ASA, the operational risk capital charge/methodology is the same as for the standardized approach except for two business lines-retail banking and commercial banking. For these business lines, loans and advances—multiplied by a fixed factor ‘m’—replaces gross income as the exposure indicator. The betas for retail and commercial banking are unchanged from the standardized approach. The ASA operational risk capital charge for retail banking (with the same basic formula for commercial banking) can be expressed in the following way.
Where KRB = the capital charge for the retail banking business line
βRB = the beta for the retail banking business line
LARB = total outstanding retail loans and advances (non-risk-weighted and gross of provisions), averaged over the past 3 years
m is 0.035
As under the standardized approach, the total capital charge for the ASA is calculated as the simple summation of the regulatory capital charges across each of the eight business lines.
Advanced measurement approaches (AMAs). The advanced measurement approaches would be based on an estimate of operational risk derived from a bank’s internal risk measurement system and are, therefore, expected to be more risk sensitive than the other two approaches. Under the AMA, banks would be allowed to use the output of their internal operational risk measurement systems, subject to set qualitative and quantitative standards. For certain event types, banks may need to supplement their internal loss data with external industry loss data.
The approaches that banks in other territories are currently developing, fall under three broad categories. These are the internal measurement approach (IMA), loss distribution approach (LDA) and scorecard approach. The main features of these approaches, as outlined by the Basel Committee, are described as under.
Internal measurement approach (IMA): The approach assumes a fixed and stable relationship between ELs (the mean of the loss distribution) and ULs (the tail of the loss distribution). This relationship may be linear—implying the capital charge would be a simple multiple of ELs or non-linear—implying that the capital charge would be a more complex function of ELs.
The IMA calculations are generally based on a framework that divides a bank’s operational risk exposures into a series of business lines and operational risk event types. In such a framework, a separate EL figure is calculated for each business line/event type combination. Typically, ELs are calculated by combining estimates of loss frequency and severity for various business line/event type combinations, based on internal and where appropriate, external loss data, along with a measure of the scale of business activities for the particular business line in question.
While these elements can be specified in a variety of ways, in general, they can be described as follows:
PE: The probability that an operational risk event occurs over some future horizon
LGE: The average loss given that an event occurs
El: An exposure indicator that is intended to capture the scale of the bank’s activities in a particular business line
Combining these parameters, the IMA capital charge for each business line (i)/event type (j) combination (Ki,j) would be:
Ki, j = γi, j × EIi, j × PEi, j × LGEi, j = γi, j × ELi, j
In this formula, a linear relationship between ELs and the tail of the distribution is assumed and the parameter γi,j translates the estimate of ELs for business line (i)/event type (j) (ELi, j) into a capital charge. The γ for each business line/event type combination would be specified by banks (possibly via consortia) and subject to acceptance by supervisors. The overall capital charge is generally calculated as the sum of the capital charges for individual business line/ event type cells.
Loss distribution approach (LDA): Under loss distribution approaches, banks estimate, for each business line/ risk type cell or group thereof, the likely distribution of operational risk losses over some future horizon (for instance, 1 year). The capital charge resulting from these calculations is based on a high percentile of the loss distribution. As with internal measurement approaches, this overall loss distribution is typically generated based on assumptions about the likely frequency and severity of operational risk loss events. In particular, LDAs usually involve estimating the shape of the distributions of both the number of loss events and the severity of individual events. These estimates may involve imposing specific distributional assumptions (for instance, a Poisson distribution for the number of loss events and lognormal distribution for the severity of individual events) or deriving the distributions empirically through techniques such as bootstrapping and Monte Carlo simulation. The overall capital charge may be based on the simple sum of the operational risk ‘VaR’ for each business line/risk type combinationwhich implicitly assumes perfect correlation of losses across these cells—or by using other aggregation methods that recognize the risk-reducing impact of less than full correlation.
At present, several kinds of LDA methods are being developed and no industry standard has emerged.
Scorecard approaches: A range of scorecard approaches is being developed with some banks already operating a system of economic capital allocation based on such an approach. In this approach, banks determine an initial level of operational risk capital at the bank or business line level and then modify these amounts over time on the basis of ‘scorecards’ that attempt to capture the underlying risk profile and risk control environment of the various business lines. These scorecards are intended to bring a forward-1ooking component to the capital calculations, that is, to reflect improvements in the risk control environment that will reduce both the frequency and severity of future operational risk losses. The scorecards may be based on actual measures of risk, but more usually identify a number of indicators as proxies for particular risk types within business units/lines. The scorecard will normally be completed by line personnel at regular intervals and are subject to review by a central risk function.
In order to qualify for the AMA, a ‘scorecard’ approach must have a sound quantitative basis, with the overall size of the capital charge being based on a rigorous analysis of internal and external loss data.
Other Issues
Overlap with credit and market risks: Certain operational risk loss events may overlap with those of credit or market risk related exposures. For the purpose of better operational risk management and to evolve internal policies in this regard, banks are expected to include all operational risks in the loss event database. However, for regulatory capital purposes, banks are expected to attribute operational risk related to credit and market loss events to those risk areas for the calculation of regulatory capital requirements.
Partial use: A bank may be permitted to use a combination of approaches, say, the standardized approach for some business lines and an advanced measurement approach for others, subject to a materiality requirement that at least a minimum percentage of the bank’s business should be in the advanced measurement approach. However, with a view to prevent arbitrage of the capital charge, banks will not be allowed to choose to revert to simpler approaches once they have been approved for more advanced approaches.
ANNEXURE II
CASE STUDY: THE FINANCIAL CRISIS OF 2007—BASEL II AND THE BLAME GAME
Does the Basel II Accord deserve its share of the blame in the run up to the financial crisis of 2007?
Those who say ‘no’ however point to the shortcomings of Basel I Accord as a possible reason. At a time when countries had just begun implementing the Basel II Accord, the remnants of the Basel I era, with its lack of risk sensitivity and inflexibility to rapid innovations, could have created perverse regulatory incentives to simply move risky exposures off bank balance sheets, without really assessing the adequacy of capital to meet the risk exposures.
Those who say ‘yes’ feel that the financial crisis merely exposed the deficiencies in the ‘vastly improved’ Basel II Accord. What were the limitations of the Basel II Accord?
One, the Basel II Accord made a quantum leap from the relatively simple Basel I to include a degree of complexity that proved a challenge to both the regulators as well as banks.
Two, external ratings provided by rating agencies played a critical role in the Basel II Accord. Since rating agencies were assigned significant blame for the financial crisis, the basic premises of Basel II Accord were also questionable.
Three, the standardized and advanced approaches operated under certain assumptions may not be applicable to all countries adopting the Accord. Hence, the onus was on the regulator of each country to assess if the risk-weights assigned were applicable to the country’s context.
Four, the Accord allocated higher capital to higher credit risk. This led to the concern that small businesses and the less prosperous sections of society, typically considered as high credit risk segments, would attract unaffordable rates of interest. This concern was especially true for developing countries.
Five, the risk modelling approaches in the advanced approaches had limitations. It is still unclear whether maintaining capital based on these risk models would ensure adequate amount of capital to cover risks. Further, these models require accurate and validated data to assess risks, which may not be available in all countries or for all instruments.
Six, the level of technological and computational competence that the approach presupposes may not be available with all banks or banking systems.
Seven, aligning disclosures under Pillar 3 (please refer to Annexure III) to international and domestic accounting systems would be a challenge.
Eight, effective implementation of the Basel II Accord would require tremendous upgrading in skills of both supervisors and banks.
Finally, an issue that has been discussed widely is that of pro-cyclicality. When economies are doing well, banks lend more, probably take more risks for better returns and maintain adequate capital. However, when business cycles take a downturn, banks downgrade the borrowers due to increased likelihood of default and therefore, have to maintain more capital. This leads to capital shortage, as well as restriction in credit and therefore, leads to further deterioration in the economy. The Basel Committee acknowledges that risk based capital requirements could inevitably lead to pro-cyclicality, but this problem could be addressed by different instruments.
In November 2008, the Basel Committee admitted that its proposed Accord had to be more comprehensive to address the fundamental weaknesses exposed by the financial crisis related to the regulation, supervision and risk management of internationally active banks. In 2009, the Committee has already brought out documents amending the Basel II Accord, as described in Section II of the chapter.
QUESTIONS ON THE CASE STUDY:
- Why is a set of rules like the Basel II blamed as the cause for a global financial meltdown?
- Can another set of rules like Basel III undo the damage?
- Does Basel III address the shortcomings of Basel II?
- How successful will Basel III be in averting future financial crises?
SELECT REFERENCES
- RBI, “Report on Currency and Finance, 2006–2008”
- www.bis.org
ANNEXURE III
PILLARS II AND III OF BASEL II AND III ACCORD AND THEIR APPLICATION TO INDIAN BANKS
The Second Pillar of the Basel II and III Accord—Supervisory Review Process
The supervisor’s role would be not only to ensure that banks maintain adequate capital to cover all critical risks, but also to guide banks towards increasingly robust internal risk management systems. Increased capital should not be regarded as a substitute for fundamentally weak internal risk management and control processes. The Basel Committee points out areas where supervisory review becomes more important.
- Risks under Pillar 1 not fully captured by the Pillar 1 (minimum capital requirements) process. An example would be ‘credit concentration risk’.
- Factors not taken into account in the Pillar 1 process. Examples would be interest rate risk in the banking book, business and strategic risks.
- External factors, such as business cycles, over which banks have little control.
- Assessment of compliance with minimum standards and disclosure requirements of the more advanced methods in Pillar 1, such as the IRB approach for credit risk or the AMA for operational risk.
Accordingly the Basel Committee has identified four key principles of supervisory review.
Principle 1. Banks should have a process for assessing their overall capital adequacy in relation to their risk profile and a strategy for maintaining their capital levels. (Note that the onus of maintaining adequate capital rests with individual banks.)
Principle 2. Supervisors should review and evaluate banks’ internal capital adequacy assessments and strategies, as well as their ability to monitor and ensure their compliance with regulatory capital ratios. Supervisors should take appropriate supervisory action if they are not satisfied with the result of this process.
Principle 3. Supervisors should expect banks to operate above the minimum regulatory capital ratios and should have the ability to require banks to hold capital in excess of the minimum.
Principle 4. Supervisors should seek to intervene at an early stage to prevent capital from falling below the minimum levels required to support the risk characteristics of a particular bank and should require rapid remedial action if capital is not maintained or restored.
Thus, while principles 1 and 3 relate to the expectations of supervisors from banks, principles 2 and 4 delineate the role of supervisors under Pillar 2.
The Committee has emphasized that supervisory review should address risks not addressed under Pillar 1 such as those mentioned in the earlier paragraphs. In addition, supervisors should make rigorous assessments of the following aspects while carrying out their review process, to ensure proper functioning of Pillar 1. These aspects specifically include (a) interest rate risk in the banking book, (b) credit risk, especially with regard to stress tests under the IRB approaches, definition of default, residual risk (where credit risk mitigation techniques are used), credit concentration risk and counter party credit risk, (c) operational risk, and (d) market risk, with special reference to policies and procedures for trading book eligibility, valuation and stress testing and specific risk modelling under the internal models approach.
In view of its growing importance and the scope for innovation, the Committee has laid special emphasis on supervisory review process in securitization transactions.
Finally, as banks move towards greater sophistication in risk management, supervisors should be able to assess banks with greater transparency and accountability. This requirement assumes increased importance in the case of banks’ international operations, where supervisors of the countries, where a bank operates, need to have an enhanced degree of cross border communication and co-operation.
Additionally, the BCBS, in its "Core Principles for effective banking supervision" brought out in September 2012,44 has revised the core principles. The enhanced number of 29 core principles is expected to to provide a comprehensive standard for establishing a sound foundation for the regulation, supervision, governance and risk management of the banking sector.
Application of Pillar II to Indian Banks The RBI reiterates the Basel Committee principles and the specific areas for supervisory review as given above.
On the basis of the Basel Committee observations, the RBI has introduced unique nomenclatures (and abbreviations) in the implementation of Pillar 2 requirements. Some of these are as follows:
- The process is known as the supervisory review and evaluation process (SREP) under Pillar 2.
- An important component of SREP is the internal capital adequacy assessment process (ICAAP).
Banks in India are required to formulate an ICAAP (with Board approval). The ICAAP will be unique to the bank and will be commensurate with its size, level of complexity, risk profile and scope of operations. It is noteworthy that ICAAP will be, in addition to, the Bank’s calculation of regulatory capital under Pillar 1. Foreign banks in India and Indian banks with international presence have operationalized their ICAAP from 31 March 2008 and all other commercial banks (excluding local area banks and regional rural banks) from 31 March 2009. The ICAAP document has to be sent to the RBI every year in the prescribed format. The RBI’s July, 2015 Master Circular sections 10 to 13 provides detailed guidelines on formulating, reviewing and using the ICAAP as a rigorous management control tool for both the bank and the supervisor.
The SREP will be conducted periodically by the RBI, generally coinciding with the annual financial inspection (AFI) by the RBI. Under this process, the RBI would carry out a comprehensive evaluation to assess the overall capital adequacy of each bank. The ICAAP would be an important input in this process.
The ICAAP is expected to be (a) forward looking, (b) risk based, and (c) include stress tests and scenario analysis. The RBI also wants banks to develop internal models to estimate economic capital.
The Third Pillar of the Basel III Accord—Market Discipline
(March 2017, Pillar 3 disclosure requirements - enhanced and consolidated framework(http://www.bis.org/bcbs/publ/d400.pdf)
Theoretically, regulation aimed at creating and sustaining competition among banks, notably through increased transparency, is believed to play an important role in mitigating bank solvency Problems.
Pillar 3—market discipline-serves to complement the requirements of the other two pillars. The key feature of this pillar is ‘disclosure’. As banks move towards advanced methodologies of assessing risks, the discretionary element also increases. Market participants would therefore require more information on vital aspects of bank operations, especially those connected with risk exposures and assessment and capital adequacy.
Under this pillar, the Committee has recommended that supervisors use their powers to require banks to disclose information that would lead to a safe and sound banking system.
The enhancements in the revised Pillar 3 standard contain three main elements:
- Consolidation of all existing Basel Committee disclosure requirements into the Pillar 3 framework, covering the composition of capital, the leverage ratio, the liquidity ratios, the indicators for determining globally systemically important banks, the countercyclical capital buffer, interest rate risk in the banking book and remuneration.
- Introduction of a "dashboard" of banks' key prudential metrics which will provide users of Pillar 3 data with an overview of a bank's prudential position and a new disclosure requirement for banks which record prudent valuation adjustments to provide users with a granular breakdown of its calculation.
- Updates to reflect ongoing reforms to the regulatory framework, such as the total loss-absorbing capacity (TLAC) regime for globally systemically important banks and the revised market risk framework published by the Committee in January 2016.
The implementation date for each of the disclosure requirements is set out in the standard. In general, the implementation date for existing disclosure requirements consolidated under the standard will be end-2017. For disclosure requirements which are new and/or depend on the implementation of another policy framework, the implementation date has been aligned with the implementation date of that framework.
Application of Pillar III to Indian Banks The RBI has formulated disclosure requirements based on the Basel Committee recommendations. The effective dates of commencement of disclosures would be July 1, 2013. The requirements under this Pillar can be accessed in the RBI Master circular dated July 1, 2015.
Impact of Ind AS implementation on banks in India - Convergence with IFRS 9
In section II we learnt that IFRS 9, when implemented, would change the way of provisioning of Expected Credit Losses (ECL). The possible impact of Indian Accounting Standards (Ind AS) in this context is broadly captured in the RBI Financial Stability Report, June 2017 (page 44).
In preparation for Indian Accounting Standards (IndAS) converging with the IFRS from April 1, 2018, banks in India have to submit proforma Ind AS financial statements from the half year ended September 30, 2016. The proforma statements submitted revealed that there were wide variations in assumptions in implementing the ECL under Ind AS 109.
The following key observations emerge based on the analysis: (Box 3.1, pages 44 and 45 of RBI Financial stability report, June 2017).
A. Estimated increase in stock of provisions on transition to Ind AS
A significant increase in the stock of provisions on loans is expected at the date of transition to Ind AS, both from Stage 1 and Stage 2 loans.
Stage 1 loans are Performing loans: when loans first come onto the balance sheets, banks must recognise the 12-month expected credit loss for these loans. This is the probability in the next 12-months of a loan defaulting (PD), multiplied by the amount which a bank would lose on the default. Stage 2 loans are Underperforming loans: where a loan begins to show a significant increase in credit risk, banks will have to make provisions for the lifetime expected credit loss (ie., based on the lifetime, not the 12-month PD).
Stage 1 provisions under the Ind AS is expected to be generally higher compared with the current standard advances provision at 0.40 per cent for majority of the advances (See chapter 8 for provisions on standard assets). On the other hand, a portion of the current portfolio of standard advances is expected to move to Stage 2 which will require higher levels of provisions based on lifetime expected loss provisions.
Under Ind AS, as portfolios deteriorate, (although not defaulted) and therefore move to Stage 2, there may be a likelihood of cliff effect due to significant increase in ECL.
B. Classification and measurement
- Financial liabilities – Under Ind AS 109, the measurement basis of financial liabilities is similar to the current practices followed by banks, i.e., financial liabilities are likely to be measured at amortised cost.
- Loans and advances – The measurement basis for loans and advances in general, is the same and, in most cases, amortised cost will be the most relevant category for loans and advances under Ind AS. A very small proportion of loans contracted under the “hold to sell/securitise” business model are expected to be fair valued under Ind AS.
- Investment portfolio – Fair value, in particular FVOCI is likely to be the most relevant category for a major portion of the investments of Indian banks, which are currently held under the Held to Maturity (HTM) category. A financial asset shall be measured at ‘fair value through other comprehensive income’ (FVOCI) if (a) the financial asset is held within a business model whose objective is achieved by both collecting contractual cash flows and selling financial assets and (b) the contractual terms of the financial asset gives rise on specified dates to cash flows that are solely payments of principal and interest on the principal amount outstanding. It needs to be noted that the current practice of sale and transfers from HTM category would be inconsistent with the Ind AS framework where sales out of amortised category, if not insignificant, would fail the business model test for classification as amortised cost.( It is to be noted that while sale from HTM portfolio results in tainting of the whole portfolio (IAS 39) in some jurisdictions, it is totally unrestricted in some other jurisdictions. RBI follows a middle path by allowing such sales subject to disclosure above a cut-off and transfer of profit from such sales, net of taxes, to the Capital Reserve. Also, a financial asset is measured at amortised cost if (a) the financial asset is held within a business model whose objective is to hold financial assets in order to collect contractual cash flows and (b) the contractual terms of the financial asset give rise on specified dates to cash flows that are solely payments of principal and interest on the principal amount outstanding.)
- The regulatory requirement under liquidity coverage ratio (LCR) that a portion of high quality liquid assets (HQLAs) portfolio be periodically monetised, could perhaps also preclude some securities from being classified under amortised cost. (See Chapter 12 for more details on LCR and HQLA).
C. Impact on equity and regulatory capital on transition
The total estimated impact of Ind AS on equity/regulatory capital is likely to be adverse, mainly driven by the impairment requirements, although the downside impact is expected to be partially offset by creation of deferred tax assets. The shift in classification of investments to fair value and the subsequent marked-to-market (MTM) gains/ losses will also have an impact on the opening equity.
Going forward, public sector banks (PSBs) with pension liabilities could also report better profits as the actuarial losses, which under the current accounting standards are charged off to profit & loss account, shall be taken to ECL under Ind AS. This will improve the profit numbers but will be equity/CRAR neutral.
D. Transitional arrangements for the impact of ECL accounting on regulatory capital
In view of the expected reduction in regulatory capital ratios as banks make a transition to ECL accounting, RBI believes that it may be appropriate to introduce transitional arrangements for the impact of accounting changes on regulatory capital. The primary objective of a transitional arrangement is to avoid a “capital shock”, by giving banks time to rebuild their capital resources following a potentially significant negative impact arising from the introduction of ECL accounting. As per the BCBS document, there are a number of high-level requirements for jurisdictions choosing to adopt a transitional arrangement, relating to the capital metric (CET 1) to which it should be referenced.
ANNEXURE IV
CAPITAL ADEQUACY RATIOS OF INDIAN BANKS—SOME COMPARATIVE CHARTS

ENDNOTES
- Jose A. C. Santos, ‘Bank Capital Regulation in Contemporary Banking Theory: A review of literature’, BIS Working Papers no. 90 (September 2000), Bank for International Settlements, Switzerland.
- This portion is patterned on the discussion by Timothy, W Koch and S Scott, MacDonald in their book titled ‘Bank Management’, Chapter 13, pages 501–544, 4th edition, the Dryden Press, USA.
- Source: RBI, ‘Trend and Progress of Banking in India— 2007–2008’ and ‘Report on Currency and Finance, 2006-2008’, Chapter V titled ‘Managing Capital and Risk’, both accessed at www.rbi.org.in
- Shubhashis Gangopadhyay and Gurbachan Singh ‘Bank Runs, Capital Adequacy and Line of Credit’, revised version of discussion paper presented at the Indian Statistical Institute (IST), Delhi Chapter (December 2003): 2.
- Various documents of the Bank of International Settlements from the Web site http://www.bis.org
- IMF Working Paper WP/12/90, March 2012, ‘Revisiting Risk weighted assets’, prepared by Vanessa Le Leslé and Sofiya Avramova, p. 5
- Basel Committee on banking supervision, 2011, Basel III: A global regulatory framework for more resilient banks and banking systems, revised version, June 2011.
- Basel committee on banking supervision, 2011, Global systemically important banks: assessment methodology and the additional loss absorbency requirement, Rules text, November 2011, accessed at www.bis.org
- Will be disclosed by banks from January 1, 2015. Parallel run between January 1, 2013 and January 1, 2017.
- BCBS, 2011, Global systemically important banks: assessment methodology and the additional loss absorbency requirement–Rules text, November 2011.
- The FSB’s document Reducing the moral hazard posed by systemically important financial institutions, FSB Recommendations and Time Lines, (20 October 2010) is available at www.financialstabilityboard.org/publications/r_101111a.pdf.
- The banking book represents assets and liabilities of the bank, contracted with the intention of building a relationship or for steady income or statutory obligations and are generally held till maturity. In contrast, the trading book assets are primarily held for generating profits on short term differences between prices/yields. Thus while price risk is of prime concern to banks on the trading book, earnings or economic value changes are the main focus of the banking book.
- http://www.bis.org/publ/bcbs279.pdf
- http://www.bis.org/bcbs/publ/d368.pdf
- http://www.bis.org/bcbs/publ/d347.pdf
- http://www.bis.org/bcbs/publ/d362.pdf
- http://www.bis.org/bcbs/publ/d374.pdf
- http://www.bis.org/bcbs/publ/d355.pdf
- http://www.bis.org/bcbs/publ/d306.pdf
- www.bis.org/bcbs/publ/d400.pdf
- This Section is based primarily on a) RBI Master circular—‘Prudential Guidelines on Capital Adequacy and Market Discipline—New Capital Adequacy Framework (NCAF)’ dated July 1, 2015, and b) Master circular-Basel III Capital regulations, dated June 1, 2015, both accessed at www.rbi.org.in
- RBI Master circular—Basel III Capital regulations, dated June 1, 2015, accessed at www.rbi.org.in.
- Both the Basel III document and the RBI guidelines call Tier 1 capital ‘going concern’ capital, and Tier 2 capital ‘gone concern’ capital. The rationale for this is that from regulatory capital perspective, going-concern capital is the capital which can absorb losses without triggering bankruptcy of the bank. Gone-concern capital is the capital which will absorb losses only in a situation of liquidation of the bank.
- There is no direct prescription for minimum common equity. However, non-common equity elements in Tier 1 are restricted to a maximum 40 per cent of Tier 1 capital. Accordingly, indirectly minimum common equity is considered as 3.6 per cent of Tier 1 capital for banks in India.
- Common Equity is recognized as the highest quality component of capital and is the primary form of funding which ensures that a bank remains solvent.
- A consolidated bank is defined by the RBI in the above circular as ‘a group of entities where a licensed bank is the controlling entity’. The RBI guidelines on consolidated banks issued in 2003 exclude group companies engaged in Insurance business and those not engaged in financial services.
- https://rbidocs.rbi.org.in/rdocs/notification/PDFs/331M CRA296F4F515B240D8BDBED90A77C89240.PDF
- These are recorded as on balance sheet exposures by the originating bank, representing valuation of future cash flows related to margin income to be derived from the underlying exposures and is subordinated to the claims of other parties to the transaction in terms of priority of repayment. (RBI circular): 30.
- Section 7 of the RBI Master Circular describes the guidelines to be followed by banks seeking capital relief for use of CRM techniques. An illustrative example for calculation of ‘exposure’ for calculating risk-weighted assets (RWA) is provided in Annexure 8.
- Short positions not permitted in India except in the case of derivatives.
- ‘Duration’ is not to be confused with the security’s maturity. It is the measure of the price sensitivity of a fixedincome security to an interest rate change of 100 bps. It represents the time period within which the investment can be recouped and is calculated as the weighted average of the present values of all cash flows over the life of the instrument or asset. Duration is measured in years. However, this is not to be confused with the security’s maturity. For all securities, duration is shorter than maturity except in the case of zero coupon bonds.
- ‘Duration’ as defined above is also called ‘Macaulay’s duration’. However, to assess the effect of a 1 per cent change in interest rate on the price of the security, ‘modified duration’ is used. ‘Modified duration’ follows the concept that interest rates and bond prices move in opposite directions. It is used to determine the effect that a 1 per cent change in interest rate will have on the price of a bond. The concepts of ‘duration’ and ‘modified duration’ have been discussed in more detail in the chapter on ‘Risk Management.’
- The illustrations have been adapted from Annexure II of the RBI’s ‘Master Circular—Prudential Norms on Capital Adequacy—Basel I Framework’ (1 July 2009).
- For more discussion on interest rate derivatives, please refer to chapter on ‘Risk Management’.
- Any deal which has not been settled by physical payment or reversed by an equal and opposite deal for the same date.
- Capital charge for general market risk for equities is 9 per cent. (Thus, general market risk capital charge on equities would work out to ₹27 crores).
- Capital charge on forex/gold position would be computed at 9 per cent. (Thus, the capital charge works out to ₹9 crores).
- Basel Committee on Banking Supervision, ‘International Convergence of Capital Measurement and Capital Standards—A Revised Framework’ (June 2006).
- The banking book represents assets and liabilities of the bank, contracted with the intention of building a relationship or for steady income or statutory obligations and are generally held till maturity. In contrast, the trading book assets are primarily held for generating profits on short-term differences between prices/yields. Thus, while price risk is of prime concern to banks on the trading book, earnings or economic value changes are the main focus of the banking book.
- The notations used by the Committee follow those used by Standard and Poor’s (S&P). The use of S&P ratings is indicative and the ratings of other accredited rating agencies could also be used.
- MDBs currently eligible for 0 per cent risk-weight are: the World Bank group which comprises the International bank for Reconstruction and Development (IBRD), the International Finance Corporation (IFC), the Asian Development Bank (ADB), the African Development Bank (AfDB), the European Bank for Reconstruction and Development (EBRD), the Inter American Development Bank (IADB), the European Investment Bank (EIB), the European Investment Fund (ElF), the Nordic Investment Bank (NIB), the Caribbean Development Bank (CDB), the Islamic Development Bank (IDB) and the Council of Europe Development Banks (CEDB).
- See chapters on ‘Credit Risk’ for a detailed discussion on CRM.
- Sources: Principles for the Sound Management of Operational Risk (2011) (http://www.bis.org/publ/bcbs195.pdf) and Review of the Principles for the Sound Management of Operational Risk (October 2014) (http://www.bis.org/publ/bcbs292.pdf)
- http://www.bis.org/publ/bcbs230.pdf