In Chapter 5, we saw how to work with graphics, including images from your hard drive and clip art. But there’s another kind of graphic that is really important to many presentations, and that would be the diagram. A good diagram can easily take the place of a hundred words, and can be understood by your audience at a glance.
Office 2007 completely revamps the way that you create diagrams, providing an easy-to-use diagramming feature called SmartArt. You can insert SmartArt in PowerPoint 2007, Word 2007, Excel 2007, and Outlook 2007. Once you create a SmartArt graphic, you can copy and paste it into documents from other programs as well.
One of the great things about SmartArt is that it provides a large prebuilt library of diagrams, and those diagrams automatically size, position, and most importantly, re-color themselves according to the design theme you’ve applied to your presentation. This automatic color coordination with the rest of your presentation is a tremendous timesaver.
You have your choice of converting bulleted text into a SmartArt diagram, or simply inserting SmartArt into a slide and adding text to it. In this chapter, you’ll see how to create and use SmartArt in your presentations.
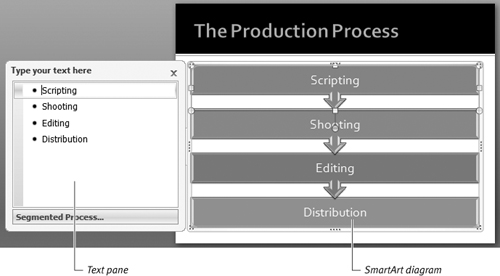
A SmartArt diagram consists of two parts. The diagram is made up of one or more graphic shapes, usually with text in each shape. The text can be entered directly in each shape, but it’s much easier to add it in the text pane, which is attached to the SmartArt when you create or modify it (Figure 6.1).
You can put SmartArt on any slide, but it’s a little easier to put it on slides with content boxes. You can also convert bulleted text in a content box to SmartArt, which is handy when you change your mind about a slide and decide you would prefer to show it as a diagram instead of plain text.
If you don’t want the SmartArt after all, it’s easy to get rid of it.
Procedure 6.1. To insert SmartArt directly on a slide:
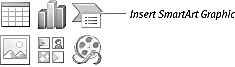
If the slide layout has a content box, click the Insert SmartArt Graphic icon (Figure 6.2).
or
If the slide layout does not have a content box, choose Insert > Illustrations > SmartArt.
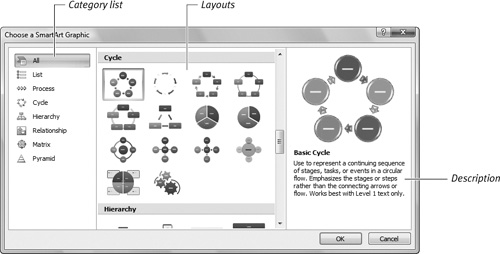
The Choose a SmartArt Graphic dialog appears (Figure 6.3). This dialog has three panes: the category list, the layouts, and the description.
In the category list, All is selected by default, showing you all of the different SmartArt varieties in a scrolling layout list. If you prefer, click one of the other categories to see layouts from just that category.
It’s possible to have more SmartArt categories than you see in Figure 6.3, if you have downloaded additional SmartArt from Microsoft or a third-party.
In the middle pane, select the SmartArt layout that you want.
The description pane shows details about the selected layout (Figure 6.4). Since the text pane of the SmartArt can contain multiple levels of bulleted text, the description often tells you where each level of the text will go on the diagram.
Click OK.
The SmartArt diagram appears on the slide, with the text pane displayed, ready for you to enter text.
Enter text in the text pane as you would any bulleted text.
Click to replace the placeholder text that PowerPoint puts in the text pane, then type your text. Press Enter to create a new entry (for Level 1 text, this creates a new shape in the diagram). Press the Tab key to indent text to Level 2 (Figure 6.5).
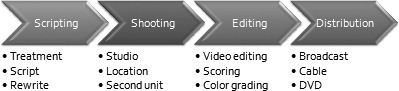
When you’re done, click elsewhere on the slide to dismiss the text pane and review your new SmartArt diagram (Figure 6.6).


✓ Tip
If you choose the wrong SmartArt layout, it’s easy to change. See “Modifying SmartArt,” later in this chapter.
Procedure 6.2. To convert bulleted text into SmartArt:
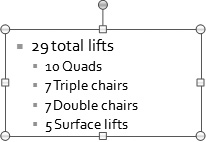
Select the bulleted text you would like to turn into SmartArt (Figure 6.7).
It doesn’t matter if you select the text or the whole text box that surrounds it.
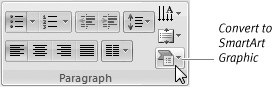
Choose Home > Paragraph > Convert to SmartArt Graphic (Figure 6.8).
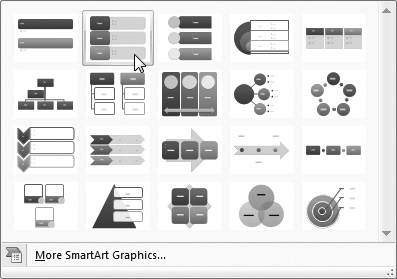
A gallery of SmartArt graphics appears (Figure 6.9).
Choose a layout from the gallery.
As you move your mouse cursor over the different layouts, PowerPoint shows you a live preview of what the new SmartArt graphic will look like on the slide.
Click to select a layout.
The bulleted text turns into the new SmartArt, and the text pane is filled with the bulleted text, in case you want to edit it (Figure 6.10).

Procedure 6.3. To delete SmartArt:
Select the SmartArt on your slide.
Press Backspace or Delete.
The SmartArt disappears.
✓ Tip
Of course, you can also cut, copy, and paste a SmartArt graphic, just like any other object in PowerPoint.
Working with the Text Pane
The text pane is useful, but sometimes it gets in the way. After you have entered your initial text, you usually don’t need to make much in the way of changes, and the text pane, extending as it does to the left of the slide, can often obscure the slide thumbnails in the Normal View pane.
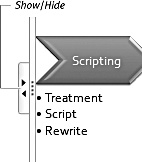
The first step in changing the text pane is to realize that even though it looks as though it is stuck to the left side of the SmartArt graphic, it really isn’t. It’s a floating window, and you can deal with that window the way you would any other window, including closing it by clicking in the X in its upper-right corner; growing and shrinking it by dragging any edge or the lower-right corner; moving it anywhere on your screen, even outside the PowerPoint window, by dragging the text pane’s title bar (where it says “Type your text here”).
When you close the text pane, you can get it back in two ways. You can click the Show/Hide control at the left edge of the SmartArt graphic (Figure 6.11). Or you can choose SmartArt Tools > Create Graphic > Text Pane. Both these controls toggle the text pane’s appearance and disappearance.
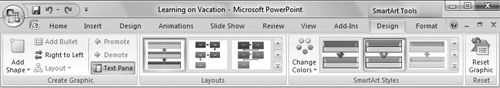
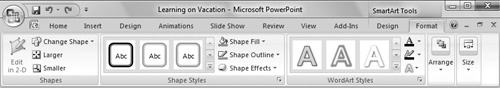
When a SmartArt graphic is selected on your slide, a new set of contextual tabs, the SmartArt Tools, appears on the Ribbon. These consist of two subtabs, Design and Format. On the Design tab, you can change the number of shapes in the graphic, switch to a different SmartArt layout, recolor the graphic, or apply some preset styles to give your SmartArt a whole new look (Figure 6.12). The Format tab allows you to modify the shapes in your graphic, apply styles to the individual shapes, apply WordArt and other text styling to the text in the SmartArt, and offers tools to set the alignment and size of the graphic (Figure 6.13).
In this section, we’ll focus on changing the look of a SmartArt graphic. In the next section, we’ll get into changing the structure and layout of SmartArt.
Procedure 6.4. To change the color of a SmartArt graphic:
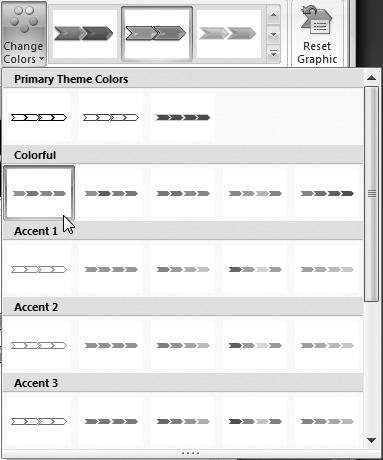
Choose SmartArt Tools > Design > SmartArt Styles > Change Colors.
The colors gallery appears (Figure 6.14). These color variations range from subtle to colorful. The gallery is likely to look different from the one shown here, because you’ll probably have used another SmartArt layout.
Roll your mouse cursor over a color variation in the gallery. As you roll over a variation, PowerPoint shows you a live preview of what the color will look like.
Click your mouse on a color variation to select it and apply it to the SmartArt.
The SmartArt graphic changes.
Procedure 6.5. To apply a SmartArt Style:
Select the SmartArt you want to restyle.
Choose SmartArt Tools > Design > SmartArt Styles, then choose a style from the gallery.
You can scroll through the gallery, or you can click the More button at the lower-right corner of the gallery to expand it and see all the styles (Figure 6.15). As usual, as you roll over a style in the gallery, PowerPoint shows you a live preview of what the style will look like. The gallery will probably look different from the one shown here, because your SmartArt will be different.
Click a style in the gallery to select it and apply it to the SmartArt.
The SmartArt graphic changes.

✓ Tip
If after further thought you don’t like the changes that you made to the SmartArt graphic, choose SmartArt Tools > Design > Reset > Reset Graphic. All of the formatting changes you made to the graphic will be stripped away, leaving the graphic as though you had just inserted it. It also resizes the graphic to its original dimensions.
Making changes to your SmartArt can mean any of a number of things. You might want to add a shape (or subtract one) from the shapes that appear when you insert the SmartArt. You might decide that a different layout would suit your diagram better. Some SmartArt layouts, the ones that show process in a horizontal direction, might benefit from reversing that direction. Or you might want to make your diagram bigger or smaller.
Procedure 6.6. To add a shape to SmartArt:
Insert a SmartArt graphic on your slide.
or
Select an existing SmartArt graphic.
Click the existing shape that is closest to where you want the new shape to appear.
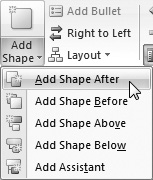
Choose SmartArt Tools > Design > Create Graphic, then click the arrow under Add Shape.
The Add Shape menu appears (Figure 6.16).
Choose one of the following:
Click Add Shape After to insert a shape at the same level as the selected shape, but following it.
Click Add Shape Before to insert a shape at the same level as the selected shape, but before it.
Click Add Shape Above to insert a shape one level above the selected shape.
Click Add Shape Below to insert a shape one level below the selected shape.
Click Add Assistant (only available if you are editing an organization chart) to add a shape one level below and connected to the selected shape.
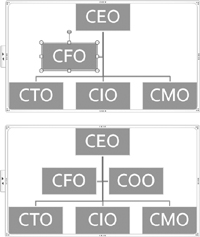
The shape is added to your SmartArt graphic (Figure 6.17).
✓ Tips
Some SmartArt layouts can contain only a limited number of shapes, and if you exceed the maximum number of shapes, the message “Anything above marked with a red X will not appear in this SmartArt graphic and will not be saved” appears at the bottom of the text pane in your SmartArt graphic. If you switch to a different layout that isn’t limited to a maximum number of shapes, the information below the red X will reappear in the SmartArt graphic.
To subtract a shape from SmartArt, simply select the shape and press Backspace.
Procedure 6.7. To switch to a different SmartArt layout:
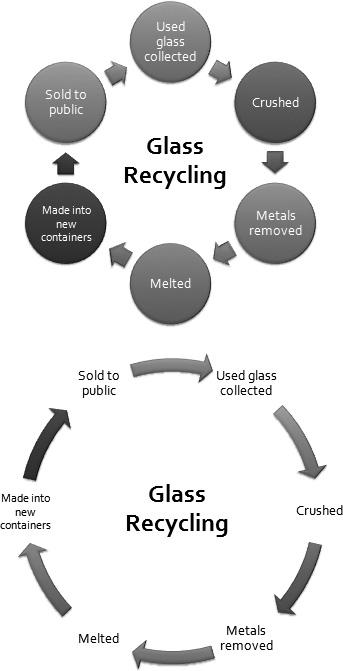
Choose SmartArt Tools > Design > Layouts, then choose a new layout from the gallery (Figure 6.18).
The SmartArt layout changes (Figure 6.19).

✓ Tip
If you have a layout with one of the embedded picture placeholders, and you have inserted pictures into the placeholders, the pictures will be lost when you switch to a different layout, and you will have to reinsert them if the new layout also has picture placeholders.
Procedure 6.8. To flip a SmartArt graphic:
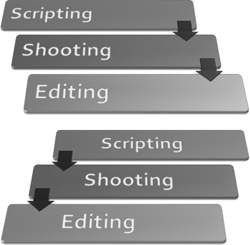
Click SmartArt Tools > Design > Create Graphic > Right to Left.
The SmartArt flips as you command (Figure 6.20). This button acts as a toggle, so you can switch back just by clicking on it again. PowerPoint keeps the text readable, even though the shapes have flipped orientation.
Procedure 6.9. To resize SmartArt:
Select the SmartArt you want to change.
Click and drag any of the edges or corners of the graphic.
or
Choose SmartArt Tools > Format > Size, then enter figures in the Height and Width fields (Figure 6.21).
The SmartArt resizes to your specifications.

As you’ve seen earlier in this chapter, SmartArt can look pretty great. So great, in fact, that you might want to reuse SmartArt in another program, such as a page layout program or a Web page editor. One way to do that is to create the SmartArt graphic in PowerPoint (or in Word, Excel, or Outlook), then copy and paste it into the other program. But you can also export the SmartArt as a stand-alone graphics file, in the standard PNG, JPG, TIF, GIF or Windows Metafile formats.
Procedure 6.10. To export a SmartArt as a picture:
Select the SmartArt graphic you want to export.
Right-click on the graphic, then choose Save as Picture from the shortcut menu (Figure 6.22).
The Save As Picture dialog appears (Figure 6.23).
Navigate to where you want to save the file, then type a name in the File name field.
Choose the graphic format you want for the exported file from the Save as type pop-up menu.
I recommend that you use PNG format. See the “Picking a Format” sidebar.
Click Save to save the file.

