
2. Take a guided tour
In this chapter
![]() Explore the Project user interface
Explore the Project user interface
![]() Manage files and set options in the Backstage view
Manage files and set options in the Backstage view
![]() Work with schedule details in views
Work with schedule details in views
![]() Use reports to check a plan’s status
Use reports to check a plan’s status
Practice files
For this chapter, use the TakeGuidedTour practice file from the Project2016SBSCh02 folder. For practice file download instructions, see the introduction.
This chapter leads you on a quick tour of Project 2016. You’ll see the essential features that make it such a powerful program. In this chapter, you’ll be introduced to many of the Project features and conventions that you’ll work with throughout this book.
This chapter guides you through procedures related to managing files and setting options in the Backstage view, working with schedule details in views, and using reports to check a plan’s status.
Explore the Project user interface
When you start Project, its Start screen appears. Here you can quickly open a plan that was recently opened, open another plan, or create a new plan. The new plan can be empty or it can be based on a template or on another plan.

The Project Start screen includes options for creating a new plan or opening a plan
![]() Tip
Tip
If the Start screen does not appear when you start Project, do the following: On the File tab, click Options. In the Project Options dialog box, click General, and under Start Up Options, click Show The Start Screen When This Application Starts.
You create a new plan by clicking the Blank Project option on the Start screen. Doing so creates the new plan in the main Project interface.

Here are the major parts of the Project interface; note the label of the active view along the left edge
![]() Tip
Tip
Some items you see on your screen, such as commands on the ribbon in the Project window, might differ from what’s shown in this book. This might depend on your screen resolution and any previous customizations made to Project on your computer.
Let’s walk through the major parts of the Project interface:
![]() The Quick Access Toolbar is a customizable area of the interface where you can add your favorite or frequently used commands. For more information, see Chapter 18, “Customize Project.”
The Quick Access Toolbar is a customizable area of the interface where you can add your favorite or frequently used commands. For more information, see Chapter 18, “Customize Project.”
![]() Use the Tell Me box to quickly find a Project command, or help about that command or feature.
Use the Tell Me box to quickly find a Project command, or help about that command or feature.
![]() The ribbon contains the commands you use to perform actions in Project. Tabs on the ribbon organize the major features and commands in Project into logical groups. The tabs on the Project ribbon are discussed in detail later in this topic.
The ribbon contains the commands you use to perform actions in Project. Tabs on the ribbon organize the major features and commands in Project into logical groups. The tabs on the Project ribbon are discussed in detail later in this topic.
![]() Groups are collections of related commands. Each tab is divided into multiple groups.
Groups are collections of related commands. Each tab is divided into multiple groups.
![]() Commands are the specific features you use to perform actions in Project. Each tab contains several commands. Some commands, like Cut on the Task tab, perform an immediate action. Other commands, like Change Working Time on the Project tab, open a dialog box or prompt you to take further action in some other way. Some commands are available only when you’re in a particular type of view or report.
Commands are the specific features you use to perform actions in Project. Each tab contains several commands. Some commands, like Cut on the Task tab, perform an immediate action. Other commands, like Change Working Time on the Project tab, open a dialog box or prompt you to take further action in some other way. Some commands are available only when you’re in a particular type of view or report.
![]() ScreenTips are short explanatory descriptions of commands, column headings, and many other items in Project. You can see an item’s ScreenTip by pointing to the item.
ScreenTips are short explanatory descriptions of commands, column headings, and many other items in Project. You can see an item’s ScreenTip by pointing to the item.

Information about commands and many other items throughout Project can be displayed in descriptive ScreenTips
![]() The active view (or report) is displayed in the main Project window. Project can display a single view or multiple views in separate panes. A multiple-view display is called a split view or combination view.
The active view (or report) is displayed in the main Project window. Project can display a single view or multiple views in separate panes. A multiple-view display is called a split view or combination view.
![]() The view label (or report label) appears along the left edge of the active view. Project includes dozens of views, so this is a handy reminder of what your active view is.
The view label (or report label) appears along the left edge of the active view. Project includes dozens of views, so this is a handy reminder of what your active view is.
![]() The status bar displays some important details like the scheduling mode of new tasks (manual or automatic) and whether a filter has been applied to the active view.
The status bar displays some important details like the scheduling mode of new tasks (manual or automatic) and whether a filter has been applied to the active view.
![]() You use view shortcuts to quickly switch between recently used views and reports.
You use view shortcuts to quickly switch between recently used views and reports.
![]() The Zoom Slider zooms the active view or report in or out.
The Zoom Slider zooms the active view or report in or out.
![]() Shortcut menus (also called context menus or right-click menus) and Mini Toolbars appear when you right-click most items in a view or report.
Shortcut menus (also called context menus or right-click menus) and Mini Toolbars appear when you right-click most items in a view or report.

Right-click a task’s name or other value to see available shortcut menu commands and the Mini Toolbar
Here’s a good general practice: when you’re not sure what actions you can perform with something you see in Project, right-click the item to see what commands are available for that item.

Right-clicking another item, such as a Gantt bar, displays different available commands and a different Mini Toolbar
Similar to other Microsoft Office programs, Project uses the interface commonly called the ribbon. The most prominent parts of this interface are the tabs and ribbon that span the top of the Project window.
These tabs logically group together the commands that apply to major areas of focus in Project:
![]() The Task tab includes commands for adding, formatting, and organizing tasks.
The Task tab includes commands for adding, formatting, and organizing tasks.
![]() Use the Resource tab to add resources to a plan, assign them to tasks, and manage their workloads.
Use the Resource tab to add resources to a plan, assign them to tasks, and manage their workloads.
![]() The Report tab contains commands you can use to view reports and compare two plans.
The Report tab contains commands you can use to view reports and compare two plans.
![]() The Project tab contains commands that usually apply to the entire plan, such as the command for setting the plan’s working time.
The Project tab contains commands that usually apply to the entire plan, such as the command for setting the plan’s working time.
![]() The View tab helps you control what you see in the Project window and how that information is displayed.
The View tab helps you control what you see in the Project window and how that information is displayed.
![]() Tool tabs include the Format tab, the Design tab, and the Layout tab, among others. A tool tab appears when a certain kind of information is displayed in the active view or report, or when a certain kind of item is selected. For example, when a task view like the Gantt Chart view is displayed, the commands on the Format tool tab apply to tasks and Gantt Chart items like Gantt bars. The current context of the Format tab is shown above the tab label—Gantt Chart Tools, for example.
Tool tabs include the Format tab, the Design tab, and the Layout tab, among others. A tool tab appears when a certain kind of information is displayed in the active view or report, or when a certain kind of item is selected. For example, when a task view like the Gantt Chart view is displayed, the commands on the Format tool tab apply to tasks and Gantt Chart items like Gantt bars. The current context of the Format tab is shown above the tab label—Gantt Chart Tools, for example.
![]() Tip
Tip
You can double-click a tab label to collapse or expand the ribbon. You can also view a collapsed tab by clicking the tab label and then selecting the command you want.
Let’s look more closely at the tabs.
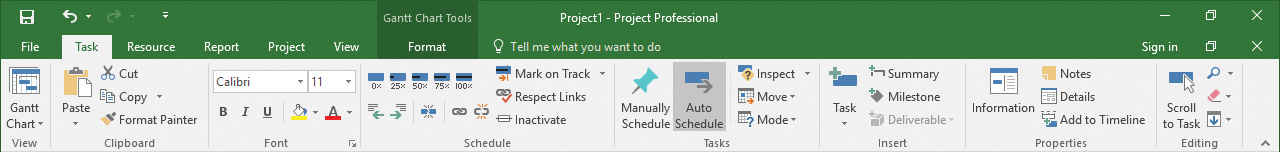
Commands on the ribbon are grouped on tabs
Like all tabs on the ribbon, the Task tab contains a large number of commands, and these commands are organized into groups. The Task tab includes the View, Clipboard, Font, and other groups.
If you enabled touch input (by clicking the button on the Quick Access Toolbar in the upper-left corner of the Project window), the commands on the ribbon appear larger and some lack text labels.

Turning on touch input makes the commands on the ribbon easier to tap
Some commands perform an immediate action, whereas other commands lead you to more options. One example of the second type of command is one that you will use frequently in Project: a split button. This type of command can either perform an immediate action or show you more options. A good example is the Gantt Chart button, which is described here:
![]() Clicking the image part of this command immediately switches to the previously viewed Gantt chart view.
Clicking the image part of this command immediately switches to the previously viewed Gantt chart view.
![]() Clicking the text label part of this command (or just the arrow, for commands that have an arrow but no text label) shows you the available settings for that command.
Clicking the text label part of this command (or just the arrow, for commands that have an arrow but no text label) shows you the available settings for that command.

The Gantt Chart command is an example of a split button
If you’re familiar with Office programs such as Microsoft Word and Excel, you should have no trouble navigating in the Project user interface.
Manage files and set options in the Backstage view
The Backstage view contains customization and sharing options that apply to the entire plan, in addition to the essential commands for file management such as Open, New, Print, and Save.

The options in the Backstage view are organized on tabs that appear along the left edge of the window
Here is a brief list of the pages in the Backstage view. In most cases, you can click the tab name to see more options:
![]() The Info page gives you access to the Organizer, a feature used to share customized elements like views between plans; the Organizer is described in Chapter 18, “Customize Project.” The Info page also displays information about the active plan, like its start and finish date, statistics, and advanced properties. You work with advanced properties in Chapter 3, “Start a new plan.” If you’re using Project Professional with the Project Web App, you can also manage Project Web App accounts here.
The Info page gives you access to the Organizer, a feature used to share customized elements like views between plans; the Organizer is described in Chapter 18, “Customize Project.” The Info page also displays information about the active plan, like its start and finish date, statistics, and advanced properties. You work with advanced properties in Chapter 3, “Start a new plan.” If you’re using Project Professional with the Project Web App, you can also manage Project Web App accounts here.
![]() The New page displays options for creating a new plan, either from scratch or based on a template.
The New page displays options for creating a new plan, either from scratch or based on a template.
![]() Open, Save, Save As, and Close are standard file-management commands.
Open, Save, Save As, and Close are standard file-management commands.
![]() The Print page includes options for printing a plan, in addition to the print preview. You’ll work with printing options in Chapter 7, “Format and share your plan” and in Chapter 16, “Format and print views: In-depth techniques.”
The Print page includes options for printing a plan, in addition to the print preview. You’ll work with printing options in Chapter 7, “Format and share your plan” and in Chapter 16, “Format and print views: In-depth techniques.”
![]() The Share page includes options for Microsoft SharePoint synchronization and attaching a plan to an email message.
The Share page includes options for Microsoft SharePoint synchronization and attaching a plan to an email message.
![]() The Export page includes options for generating a copy of the plan in PDF or XML Paper Specification (XPS) format, and other options for exporting content. You’ll work with these features in Chapter 19, “Share information with other programs.”
The Export page includes options for generating a copy of the plan in PDF or XML Paper Specification (XPS) format, and other options for exporting content. You’ll work with these features in Chapter 19, “Share information with other programs.”
![]() The Account page displays connected services and information about Project, such as version information. With a Microsoft account, you can use services such as Microsoft OneDrive file storage and roaming personal settings. When you are signed in, your user information appears in the upper-right corner of the Project window.
The Account page displays connected services and information about Project, such as version information. With a Microsoft account, you can use services such as Microsoft OneDrive file storage and roaming personal settings. When you are signed in, your user information appears in the upper-right corner of the Project window.
![]() Clicking Options opens the Project Options dialog box. This dialog box itself contains several pages through which you can adjust a wide range of default settings and behaviors in Project, such as whether you want to see the Start screen when Project starts.
Clicking Options opens the Project Options dialog box. This dialog box itself contains several pages through which you can adjust a wide range of default settings and behaviors in Project, such as whether you want to see the Start screen when Project starts.
Here are a few tips about files and settings:
![]() When you first start Project and are on the New page of the Backstage view, you can press the Esc key to open a new blank plan.
When you first start Project and are on the New page of the Backstage view, you can press the Esc key to open a new blank plan.
![]() You can pin recently opened plans to the Recent Projects list on the Open page. Right-click a plan name, and in the shortcut menu that appears, click Pin To List.
You can pin recently opened plans to the Recent Projects list on the Open page. Right-click a plan name, and in the shortcut menu that appears, click Pin To List.
![]() You can pin favorite templates to the New page by pointing to the template and clicking the pin that appears in the lower-right corner of the template preview.
You can pin favorite templates to the New page by pointing to the template and clicking the pin that appears in the lower-right corner of the template preview.
![]() If you are working offline, you’ll see templates only from your local computer.
If you are working offline, you’ll see templates only from your local computer.
![]() To exit the Backstage view, click the Back button in the upper-left corner of any Backstage page. You can also press the Esc key.
To exit the Backstage view, click the Back button in the upper-left corner of any Backstage page. You can also press the Esc key.
Templates: Avoid reinventing the wheel
Instead of creating a plan from scratch, you might be able to use a template that includes much of the initial information you need, like task names and relationships. Sources of templates include:
![]() Templates installed with Project These can vary depending on the installation options that were selected when Project was installed on your computer.
Templates installed with Project These can vary depending on the installation options that were selected when Project was installed on your computer.
![]() Online templates Microsoft makes a large number of Project templates available for free download via the web.
Online templates Microsoft makes a large number of Project templates available for free download via the web.
![]() Templates within your organization You might be in an organization that has a central library of templates. Often, such templates contain detailed task definitions, resource assignments, and other details that are unique to the organization.
Templates within your organization You might be in an organization that has a central library of templates. Often, such templates contain detailed task definitions, resource assignments, and other details that are unique to the organization.
To see available templates, click the File tab and then click New. Templates also appear on the Project Start screen.
In addition, Project can generate a new file based on an existing file from Project, or from another program via the Import Wizard. For more information, see Chapter 19, “Share information with other programs.”
You can also create templates from your plans for later use or to share. One common concern with sharing plans is that they might contain sensitive information like resource pay rates. When you create a template from a plan, you have the option to clear such information, in addition to schedule progress. The original plan is not affected.
To create a new plan as a blank project
1. Click the File tab to display the Backstage view.
2. Click New to display the New page.
3. Click Blank Project.
To create a new plan based on another plan or template, or on data in another file format
1. In the Backstage view, click New.
2. Do any of the following:
• Click New From Existing Project to create a new plan based on a previous plan.
• Click New From Excel Workbook to create a new plan based on an Excel list.
• Click New From SharePoint Tasks List to create a new plan based on a SharePoint list.
• Click the template you want, to create a new plan based on that template.
To open a plan
1. In the Backstage view, click Open. Project displays options for opening plans, in addition to a list of recently opened plans.
2. Select the location and plan you want to open.
To save a plan
1. In the Backstage view, click Save As.
2. Select the location and folder where you want to save the plan.
3. In the Save As dialog box, enter a file name, and then click Save.
To create a template from an existing plan
1. In the Backstage view, click Export.
2. Click Save Project As File.
3. Under Save Project As File, click Project Template.
4. Click Save As.
5. Navigate to the folder where you want to create the new template.
6. In the File Name box, enter the template file name that you want, and then click Save.
7. When the Save As Template dialog box opens, select the types of information, such as resource pay rates, that you want removed from the template.
8. Click Save.
Work with schedule details in views
You create and work with your plan’s data in views. Project includes many types of views. Examples of views include tables with graphics, tables with timescales, tables alone, charts and diagrams, and forms. In some views, you can filter, sort, or group data, and specify what types of data are displayed. You can use and customize the views that come with Project in addition to creating your own.
Project contains dozens of views, but most people usually work with one view (or sometimes two in a split view, also known as a combination view) at a time. You use views to enter, edit, analyze, and display your project information. The default view—the one you see when you create a new plan—is called the Gantt With Timeline view.
In general, views focus on task, resource, or assignment details. The Gantt Chart view, for example, lists task details in a table on the left side of the view and graphically represents each task as a bar in the chart on the right side of the view.

The Gantt With Timeline view is a split view with the Timeline view in the top pane and the Gantt Chart view below it
The Gantt Chart view is a common way to represent a schedule. This type of view is also useful for entering and fine-tuning task details and for analyzing your plan. You can adjust the timescale in the Gantt Chart view in several ways to see more or less of the plan.
The Timeline view is a handy way of seeing the “big picture” of the plan.

You can set up multiple timeline bars in the Timeline view
When you click in the Timeline view, the label above the Format tool tab changes from Gantt Chart Tools to Timeline Tools.

When the Timeline view is selected, its formatting commands are available on the Timeline Tools Format tab
In this case, the commands displayed on the Format tab are specific to the Timeline view. As you display or select different views, reports, or specific items in Project, note when the label above the Format tab changes accordingly.
Next we’ll examine sheet views. The Resource Sheet view displays details about resources in a row-and-column format (called a table), with one resource per row. Another sheet view, called the Task Sheet view, lists the task details. In most views in Project, many different tables are available, allowing you to focus on the type of data that most interests you.

A sheet view contains a table that organizes information into rows and columns
The Resource Sheet view doesn’t tell you much about the tasks to which resources might be assigned. To see that type of information, you need a different view.
The Resource Usage view groups the tasks to which each resource is assigned and shows you the work assignments per resource on a timescale, such as daily or weekly.

Usage views organize assignments per task or per resource, and present the assignment details against a timescale
As with the Gantt Chart timescale, you can adjust this timescale by using the Timescale command on the View tab or the Zoom Slider on the status bar in the lower-right corner of the Project window. In usage views, you can also switch to a different table to focus on the type of information that you’re most interested in.
Another usage view, the Task Usage view, flips the data around to display all the resources assigned to each task. You’ll work with usage views in Chapter 9, “Fine-tune task scheduling.”
A handy split view is the Task Form combined with a Gantt chart or other view.

In a split view like this one, details about the item selected in the primary pane are displayed in the secondary pane
In this type of split view, the Gantt Chart is the primary view and the Task Form is the details pane. Details about the selected task in the Gantt Chart view appear in the Task Form. You can also edit values directly in the Task Form. You will work with the Task Form in Chapter 6, “Assign resources to tasks,” and with the similar Resource Form in Chapter 5, “Set up resources.”
There are many other views in Project. Keep in mind that, in all views in Project, you are looking at different aspects of the same set of details about a plan. Even a simple plan can contain too much data to display at one time. Use views to help you focus on the specific details you want.
To switch between views
1. On the View tab, in either the Task Views or Resource Views group, do one of the following:
• If the button for the view you want is shown, click it.
• If the button for the view you want is not shown, click Other Views, and then click the view you want.
• If the view you want is not listed on the Other Views menu, click More Views, click the view you want, and then click Apply.
To adjust the timescale in a view
In views with a timescale, such as the Gantt chart, this action adjusts the timescale. In other views, it changes how much detail is displayed.
1. Do either of the following:
• On the View tab, in the Zoom group, click the Zoom command, and then click the zoom level you want.
• In the lower-right corner of the status bar, on the Zoom Slider bar, click Zoom Out or Zoom In.
To switch to another table in a view
This action applies only to views that include tables (such as the Gantt chart), not to views that lack tables (such as the Calendar view).
1. On the View tab, in the Data group, click Tables.
2. Do either of the following:
• If the table you want is listed, click the table.
• If the table you want is not listed, click More Tables, click the table you want, and then click Apply.
To display a split (combination) view
1. On the View tab, in the Split View group, click Details.
2. In the Details box, click the view you want to load into the bottom pane of the split view.
To display or hide the timeline view
1. On the View tab, in the Split View group, select or clear the Timeline check box.
Use reports to check a plan’s status
You can use reports to convey your plan’s data in compelling formats. Reports can include elements such as charts, tables, and images to communicate the status of your plan. Reports present task and resource data from your plan. You can view reports directly in the Project window or print them like any view. You can also copy reports and paste them into other programs such as Microsoft PowerPoint. Project includes several built-in reports, which you can use as-is or customize, and you can create your own reports.

Reports can contain a mix of charts, tables, and images
When you click a table or chart in a report, the Field List pane appears on the right side of the window.

Use the Field List to control what data appears in the selected chart or table in a report
You use the Field List pane to determine what data to include in the table or chart. You will customize reports in Chapter 7, “Format and share your plan,” and in Chapter 17, “Format reports: In-depth techniques.”
The tool tabs change when a report is displayed or when an item in a report is selected. Because a report can include a variety of items, such as charts and tables, Project includes tool tabs for both the report overall and for the specific types of items within the report.
The Report Tools Design tab includes commands you can use to control the overall design of a report.

When a report is displayed, the Report Tools Design tool tab is available
When you are working with a table in a report, the Table Tools Design tool tab is available.

Select a table in a report to access the Table Tools tabs
The Table Tools Layout tool tab is available when you are working with a table in a report.

Most commands on the Design tool tab apply to the entire table, whereas most commands on the Layout tool tab apply to the selected cells, rows, or columns
As with views, you can display a report and a view in a split view layout.

You can mix views and reports in split views
1. On the Report tab, in the View Reports group, click the report category and then click the specific report you want.
To display a report and a view simultaneously
1. Display the report you want.
2. Do either of the following:
• On the View tab, in the Split View group, click Details. In the Details box, click the view you want to display in the bottom pane of the split view.
• On the View tab, in the Split View group, click Timeline to display the Timeline in the top pane of the split view (if it’s not already visible).
Skills review
In this chapter, you learned how to:
![]() Explore the Project user interface
Explore the Project user interface
![]() Manage files and set options in the Backstage view
Manage files and set options in the Backstage view
![]() Work with schedule details in views
Work with schedule details in views
![]() Use reports to check a plan’s status
Use reports to check a plan’s status
 Practice tasks
The TakeGuidedTour practice file for these tasks is located in the Project2016SBSCh02 folder.
![]() Important
Important
If you are running Project Professional with Project Web App/Project Server, take care not to save any of the practice files you work with in this book to Project Web App (PWA). For more information, see Appendix C, “Collaborate: Project, SharePoint, and PWA.”
Manage files and set options in the Backstage view
Start Project, and then perform the following tasks:
1. Open the TakeGuidedTour plan in Project.
2. In the Backstage view, click Save As.
3. Navigate to the Ch02 practice file folder.
4. In the File name box, enter a unique name for the practice file, and then click Save.
Work with schedule details in views
The scenario: You’d like to see other parts of this plan’s data in other views. Continuing in the TakeGuidedTour plan, perform the following tasks:
1. Display the Resource Sheet view.
2. Switch to the Calendar view.

The Calendar view is a handy “month-at-a-glance” view
Use reports to check a plan’s status
The scenario: You’d like to see this plan’s data in a report. Continuing in the TakeGuidedTour plan, perform the following tasks:
1. Display the Project Overview report, which is located in the Dashboards report category.
2. Switch to the Resource Overview report.

See resources’ work status in the Resource Overview report