The K2 Workspace provides an interface for workflow participants to interact with the process-driven applications developed using K2 blackpearl. Participants are presented with a worklist displaying tasks that have been assigned to them, giving them the ability to manage their worklists and complete their tasks.
The K2 Workspace provides powerful reporting features, allowing for the creation of reports through a simple wizard process. Reports created on the K2 Workspace can be published to Microsoft SQL Server Reporting Services and be edited using any Report Definition Language (RDL)–compliant tools. Reports created by developers using the Reporting Services Report Designer in Microsoft Visual Studio can be imported and shared with the workflow participants.
The K2 Workspace also provides workflow participants, developers, and administrators with the ability to create and manage notification and custom events informing them of important server events that have been executed as the deployed processes run.
Accordingly, this chapter covers the following topics:
Using the K2 Workspace to complete the tasks assigned to you
Viewing and creating reports
Configuring Notification Events
The K2 Workspace is a browser-based interface allowing process participants to manage their worklist and giving them access to view or create workflow related reports. The K2 Workspace contains the K2 Management Console, which can be used by administrators to set security permissions.
Open the K2 Workspace by selecting Start
As you can see in Figure 20-1, the banner contains the name of current (logged on) participant. This is especially handy when testing and having multiple browser instances where you're signed in as different participants of the process. The Navigation Bar contains the tabs available, each described in more detail in the following table.

Description | |
|---|---|
Home | The K2 Home Page contains the reports and the participant's worklist with items assigned to the participant. |
Reports | The K2 for Reporting Services tab contains the Report Designer used to create and save dynamic Web-based reports. Common business objects can be exposed to the K2 platform through SmartObjects. Decision makers and workflow participants can create and save custom reports based on these objects. |
Management | The K2 Management tab contains the Management Console used for centralized administration of K2 servers, workflow process and instances, security settings, and environment library settings. For more information see Chapter 15. |
Notification Events | The K2 Notification Events tab contains the Notification Event Designer and Custom Event Designer. The Designers allow the developer to create customizable notifications that are raised when selected events occur. |
Security | The K2 Security tab contains the Workspace Permissions, which allows for an administrator to configure user access to the tabs contained on the Navigation Bar (excluding the K2 Home Page, which is available to all users). For more information see Chapter 16. |
The Navigation Page contains either menu items or tree views used for navigation depending on the displayed tab. To maximize real estate when working with the K2 Workspace, especially when interacting with the worklist and reports, you can minimize the Navigation Bar and Navigation Page by clicking the arrows on the left-hand side of each control.
The final section is the Workspace, which contains the information that you want to see depending on the displayed tab. In the case of the K2 Home Page, it displays the current participant's worklist and any tasks that have been assigned to them. In Figure 20-1 there are no current worklist items assigned to the user.
During the course of exploring the K2 Workspace, you will find that many of the tabs, wizards and windows contain the button shown in Figure 20-2. Click on the button at any time to get context-sensitive help.
The K2 Home Page is the default page that will be seen when you open the K2 Workspace (see Figure 20-3).
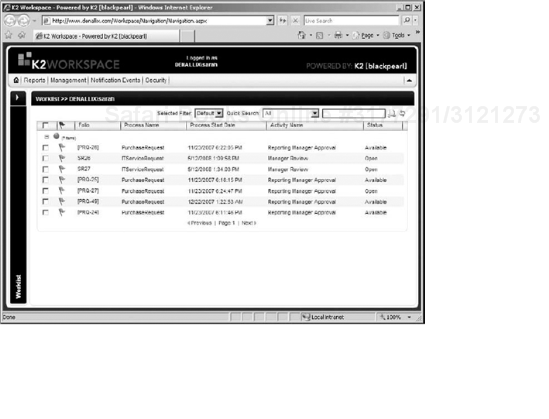
The Workspace by default shows the user's worklist containing items that have been assigned to them, and this space is used to participate in the workflow process.
There are multiple options open to the workflow participant when they want to complete a task assigned to them. The next sections discuss those options.
To use custom-developed forms to action the workflow instance, click on the worklist item. If the form associated with this activity is an ASP.NET page or an InfoPath form deployed to SharePoint running Forms Services, a new instance of your browser is launched to display the form.
In the case where the form has been created using InfoPath without Forms Services, the form is displayed in the InfoPath client application. Once the form has been opened, the workflow participant is able to action the activity and move the process instance along.
The worklist item can be opened by hovering over the Folio column and clicking on the drop-down arrow that appears. This displays a context menu. Select Open to open the form associated with the activity, allowing you to act on the task. Alternatively, the workflow can be actioned by selecting from one of the options available through the Action(s) menu item, as shown in Figure 20-4.

The action items contained in the Action(s) menu need to be made available by the process developer during the development of the process-driven application.
You can action multiple process instances at the same time. This is possible by checking the checkboxes of the respective instances (found on the left-hand side of the worklist). Once you select the checkboxes, a Batch Action drop-down list appears above the worklist (on the right-hand side) as shown in Figure 20-5.

The Batch Action drop-down list contains the same options available to the workflow participant as can be found in the Worklist Action Menu.
If you select process instances from different workflows for batch actioning, the Batch Action drop-down list will not contain any options to select.
You can suspend a worklist item for a period of time. To do this, hover over the Folio column and click on the drop-down arrow that appears. This displays a context menu. Select Sleep (shown in Figure 20-4). This opens the Perform Action — Sleep window as shown in Figure 20-6.

There are a couple of options available when suspending the activity.
Relative time: This allows you to select the duration for which the activity will be suspended. Available options are Days, Hours, Minutes, and Seconds.
Absolute time: This allows you to select a date and time until which the activity will be suspended.
Once an activity has been suspended, it disappears from the worklist. After the set duration or selected date has arrived, the item reappears in the worklist, ready for processing.
You can also redirect a worklist item. This option is used when a workflow solution allows other participants to assign tasks to a dynamic list of participants. Alternatively, should you be out of the office for a period of time you can clear your current list of assigned tasks prior to leaving the office.
To redirect the activity, hover over the Folio column and click on the drop-down arrow that appears. This displays a context menu. Select Redirect (shown in Figure 20-4). This opens the Perform Action — Redirect window, as shown in Figure 20-7.
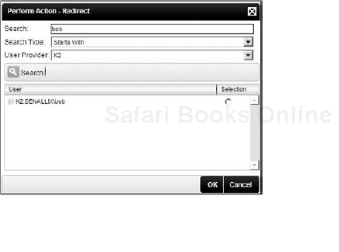
The Perform Action — Redirect window allows you to search for and select a user to redirect the worklist item to. Once the item has been redirected, it disappears from your worklist and appears inthe new user's worklist.
In the case where a worklist item has been redirected to a user and that user has not accessed the item, it can be released back to the original user for processing or reassignment. This can be done by hovering over the Folio column and clicking on the drop-down arrow that appears. This displays a context menu. Select Release (shown in Figure 20-4).
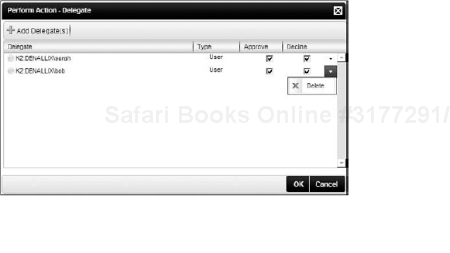
You can delegate tasks to one or more participants. This is quite useful when a batch of tasks has appeared in your worklist, and you need some assistance to complete them, especially if there is a deadline. To do this, hover over the Folio column and click on the drop-down arrow that appears. This displays a context menu. Select Delegate (shown in Figure 20-4). This opens the Perform Action — Delegate window as shown in Figure 20-8.

To add new participants, click the Add Delegate(s) button. This opens a new window allowing you to search for and select another user to delegate the activity to. Once the delegate(s) has been added, you can assign them permissions with regard to the actions they can perform on the activity. This is useful should you want delegates to be able to only approve tasks leaving the process of declining others to yourself.
To remove delegates, click the downward arrow on the right-hand side of the delegate in the Perform Action — Delegate window and select Delete, as shown in Figure 20-9.
During the process instance lifecycle, workflow participants and administrators have the ability to view process-related data. The process-related data is available through the drop-down arrow in the Folio column of the worklist (shown in Figure 20-4).
Data fields are variables contained within the running workflow. There are two levels of data fields: Process and Activity data fields.
To view the values of the data fields, hover over the Folio column and click on the drop-down arrow that appears. This displays a context menu. Select Data Fields to open the Data Fields window as shown in Figure 20-10.
The Click here to view hyperlink shown in Figure 20-10 denotes XML fields. Clicking the hyperlink opens the XML document or the XPATH node.
The values of the data fields cannot be edited using the Data Fields window.

The View Flow provides a graphical representation of the flow that the workflow has taken up to the current activity in the process. The View Flow can be seen by hovering over the Folio column and clicking on the drop-down arrow that appears. This displays a context menu. Select View Flow (shown in Figure 20-4). This will open the K2 View Flow window as shown in Figure 20-11.
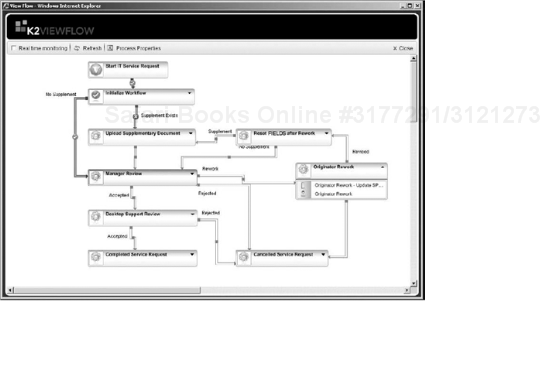
To understand the flow that the process has taken, the lines are color-coded:
Green: Lines whose Line Rules evaluated to true.
Red: Lines whose Line Rules evaluated to false.
No Color: Bypassed lines or lines that are yet to be evaluated.
Activities are color-coded, too:
Green: Activities that were successfully completed.
Blue: The activity that is currently waiting to be completed.
No Color: Bypassed activities or activities that are yet to be evaluated.
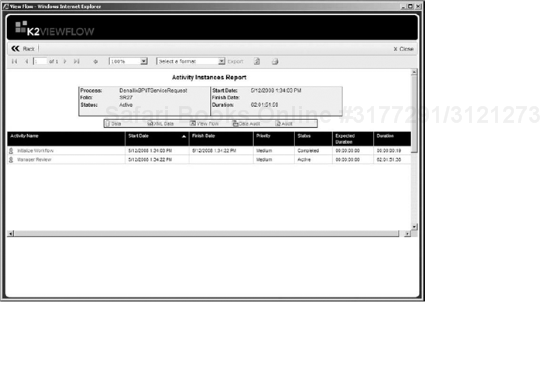
Checking the Real time monitoring checkbox at the top of the K2 View Flow window turns on real-time monitoring of the process. This obviously uses more system resources and should be done only when there is a need for it. Alternatively, select the Refresh button to refresh the View Flow. You also have available reports associated with the process instance. To view the Activity Instances Report (as shown in Figure 20-12), click the Process Properties button at the top of the K2 View Flow window or double-click on the View Flow diagram. Selecting the Activity Name causes the report to drill-down to view more information relating to the activity instance.
In some cases you can have hundreds of tasks to process, and finding a particular instance of the workflow can prove to be a daunting task. There are a few ways to find the elusive task that needs to be completed.
The columns in the worklist can be sorted in ascending or descending order by clicking on the worklist headers. Once a column has been sorted, an arrow appears next to the column name indicating whether the column contents are in ascending or descending order, as shown in Figure 20-13 where the worklist items are in ascending order by Folio.

Above the worklist items you have several controls available for filtering and searching through the worklist items.
To search through the worklist, select one of the options from the Quick Search drop-down list. It is used to restrict the search criteria against all or one of the columns in the worklist. To the right of the Quick Search drop-down list is a textbox used to enter the search criteria. Figure 20-14 shows the results of searching for "SR" within the Folio column.

Another control for filtering available to you is the Selected Filter drop-down list. It contains only one value by default — Default. To add new filters, you need to create them. This is done by clicking on the Configuration icon (the second icon from the right on the toolbar above the Worklist icons).
The following are the steps you take to create a new filter, in this case one that returns all active ITServiceRequest process instances.
Click the Configuration icon. It opens the Configuration window.
Click the Add button to open the Filter Criteria window. Enter a name for the filter in the Filter Name textbox.
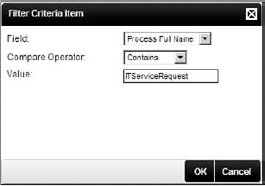
Click the Add button to open the Filter Criteria Item window shown in Figure 20-15. This allows you to further restrict the data you want to return in the filtered set.
Select the field you want to filter against, a compare operator, and enter the filtered value. You can add multiple filter criteria items to narrow down the list as much as needed.
Once you are done, the Filter Criteria window should look similar to Figure 20-16. Click the OK button to close the window.
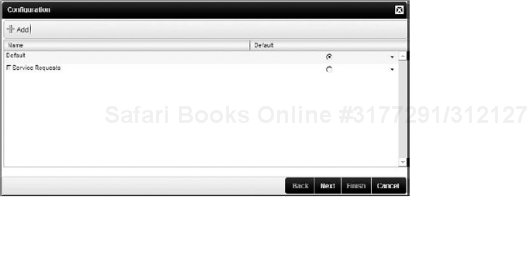
You are now back at the Configuration window, as shown in Figure 20-17. You have the option to set this new filter as the Default filter shown when we open the K2 Workspace. Click the Next button to go to the next step.
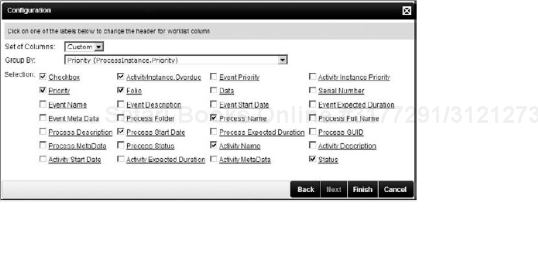
You now have the ability to set the layout of the worklist, as shown in Figure 20-18. The Set of Columns drop-down list allows you to select the columns to be displayed, and the Group By drop-down list allows you to select a property by which to group your worklist items. Selecting the Custom value in the Set of Columns drop-down list enables the list of columns with checkboxes allowing you to select the columns you want returned.

Changing the layout affects the displayed worklist items regardless of the filter selected.
To complete the configuration of the newly created filter, click the Finish button.
You can now select your new filter from the Selected Filter drop-down list, which should return an appropriately filtered worklist.
Managers have the ability to view the worklists of users who report to them. This is a useful tool in recognizing workers who are overburdened and gives managers the ability to make adjustments so that the process runs as efficiently as possible.
Viewing managed users' worklists requires users to have their manager configured in Active Directory.
Here's how you set this up.
Navigate to the Management Console on the Management tab of the Navigation Bar. Expand the server and right-click on the Workflow server to bring up the context menu. Select Edit Settings. This opens the Configuration Settings for the Workflow server.
Navigate to the Advanced Settings tab, and ensure that the Display Worklist of Managed Users checkbox is checked as shown in Figure 20-19.

The Reports tab allows you to create and run dynamic, Web-based reports using a series of steps to retrieve, filter, and display process data. Reports are created using the Report Designer. SmartObjects are exposed to the reports allowing for real-time data to be viewed.
K2 blackpearl makes use of Report Definition Language (RDL) for reports that are created by the Report Designer on the Reports tab. Report Definition Language is an XML schema used to define reports. Reports created by the Report Designer are saved to the Workspace database and do not require Microsoft SQL Server Reporting Services engine to execute. Reports are rendered by the Report Viewer hosted within the K2 Workspace.
Publishing a report requires Microsoft SQL Server 2005 Reporting Services to run the report going forward and allows you to share the report more easily. Furthermore, publishing a report allows you to edit the report in Report Builder or other SQL Server Reporting Services editors.
There are some preconfigured reports that have been created for you. These are known as Standard Reports and are visible on the K2 Home Page under the Reports menu in the Navigation Page, as shown in Figure 20-20. The reports have been published to Microsoft SQL Server Reporting Services and can be viewed in the Standard folder and Hidden sub-folder. They use the K2 BLACKPEARL data source, which is created at configuration time of K2 blackpearl. The reports provide statistical data at the process, activity, and workflow participant level.

The following table explains the five reports that come as Standard Reports in more detail:
Report Name | Description |
|---|---|
Activity Statistics | A graphical report that provides statistical data about the activities in each workflow process, including the number of activity instances and the average time it has taken to complete an activity. Can be filtered by date range and activity status. |
Process Information | A graphical report that provides date and process status filters for the selected processes. Can display the average duration of selected processes or the number of instances for each process. |
Process Overview | Provides the ability to drill-down into processes to see process, activity, and event information, such as slot and audit data. Also provides access to the View Flow report. |
Process Statistics | A graphical report that provides the ability to drill-down into processes to see statistical data, such as average duration or number of instances. Can be filtered by number of days, weeks, or months, or a particular date range. |
User Performance | A graphical report that provides the ability to drill-down into processes to display statistical data about process participants, including number of process instances the user actioned and the average time it has taken to complete a task. |
Because of the fact that some of the data in the reports can be sensitive, there are security permissions that need to be configured for each process to allow workflow participants to view the reports. These permissions are set in the Management Console on the Management tab. See Chapter 15 for more information regarding the Management tab.
When you are looking at reports, you have configuration options and drill-down abilities available to you. Above each report there is a Report Viewer Toolbar, as shown in Figure 20-21.
The toolbar functionality is explained in the following table:
Button | Name | Function |
|---|---|---|
First Page | Navigates to the first page in the report. | |
Previous Page | Navigates to the previous page in the report. | |
Current Page | Displays the current page of the report. | |
Next Page | Navigates to the next page in the report. | |
Last Page | Navigates to the last page in the report. | |
Parent Report | Navigates up the hierarchy to the parent report. This is the case when the user has drilled-down to a sub-report. | |
Zoom | Sets the size of the report. | |
Export | Exports the report in the format selected. Format options include XML, CSV, TIFF, PDF, Web, and Microsoft Excel. These options change depending on whether the report has been published or not. If published, then the configured SQL Server Reporting Services options are available. If not published, then the K2 Report Designer contains Microsoft Excel and PDF only. | |
Refresh | Refreshes the report with the latest data. | |
Opens a Print Dialog window for report printing. |
A few of the Standard Reports have a Configuration tab, shown in Figure 20-22, allowing for the creation of filters that can be saved for quick access to filtered data. Filters added here are available to all reports that show the Configuration tab.
You can take the following steps to configure a new filter:
Click on the Configure button. This opens the Configuration window, which provides you with the ability to add new filters.
Click the Add button to open the Filter Criteria window, as shown in Figure 20-23. Enter the following:
Filter Name: Used to describe your new filter.
Process Name: Used to filter against the processes.
Folder: The folder name to filter for.
Click the OK button to continue.
Back at the Configuration window you should see the newly added filter criteria. You have the option to set it as the default filter. Click the OK button to end the configuration. On the Configuration tab, the Selected Filter drop-down list should now contain a new filter to select.

To edit or delete a filter, click the Configuration button on the Configuration tab. In the Configuration window, click the downward-facing arrow in the default column, as shown in Figure 20-24, and select either Edit or Delete.

Now that you've created the report filter, it's time to take a look at the Activity Statistics Report in more detail. Select the Activity Statistics Report from the Navigation Page, as shown in Figure 20-20. From the Selected Filter drop-down list in the Configuration tab (shown in Figure 20-22), select the newly created filter. The report will look similar to Figure 20-25.

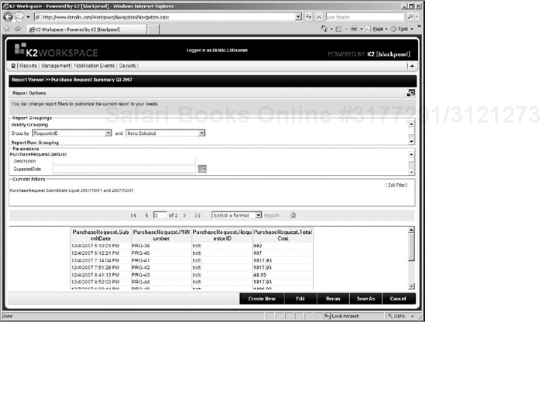
You can click on the hyperlink in the Process Name column to drill-down further, in this case into Purchase Request. Clicking on the link displays the Report Options page shown in Figure 20-26. The Report Options page enables you to select the data to display and the format in which to do so.
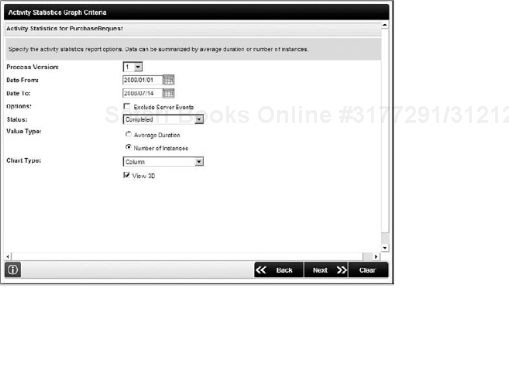
The Report Options page for each report in the Standard Reports differs slightly, depending on the report. They all give you the option to select a date range and a chart type. Once the options have been chosen, you click on the Next button to view the report. Figure 20-27 shows an example of the Activity Statistics Report.

Now that you understand how to use the reports, it's time to create a new report and save it for future use. You need to navigate to the Reports

The Report Designer lists all saved reports (in this case there aren't any to show yet). Reports can be accessed by all users with access to the Reports tab and with Admin, Start, View, or View Participant Process rights. The Report Designer contains the report name, a description of the report, the report owner, and the date saved. The columns can be sorted by clicking on the column headers. The Report Designer is made up of the three tabs, described in more detail in the following table.
Tab Name | Description |
|---|---|
Reports | Lists all reports with properties. |
Recently Saved | Lists 20 most recently saved reports. |
Recently Viewed | Lists 20 most recently viewed reports. |
The Report Designer also allows you to create a new report by clicking the Create Report button, and to import existing reports from Reporting Services by clicking the Import from Reporting Services button.
Use the following steps to create a new report:
Click the Create Report button. This launches the Create Report Wizard. The wizard contains a list of the steps it takes to create the report on the left-hand side in the Navigation Page. This changes, depending on the type of report being created. The following table describes the different report types available:
Report Type
Description
Tabular
Creates the report in a table structure.
Summary
Creates a summary report with totals and subtotals.
Matrix
Creates a report with vertical and horizontal axes.
The first step contains information regarding the report name, description, and report type. Enter a name and description for the report, and select a report type. Click the Next button to continue.
The second step allows you to select a SmartObject data source that forms the basis of the report. Expand the folder containing the desired SmartObject, and click on it. The Related Data pane will display the selected SmartObject properties. The properties returned depend on the selected radio button below the pane. There are a couple of choices, described in the following table:
SmartObject Relation
Description
Closest Related Data
Displays parent and child SmartObject properties based on the property association between the SmartObjects. For example, if there is a Purchase Order Details SmartObject and a child Purchase Order Items SmartObject, both sets of properties are returned.
All Related Data
Displays all SmartObject properties whether directly or indirectly associated to the selected SmartObject. In the Purchase Order example, if the Purchase Order Items SmartObject were selected, the Purchase Order Details SmartObject would be returned as the parent (a direct association) and the Invoice SmartObject would be returned (directly associated with the Purchase Order Details SmartObject, thus indirectly associated with the Purchase Order Items SmartObject).
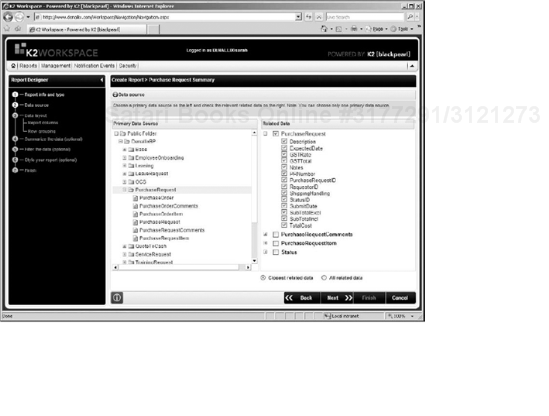
On the Related Data pane you check all the checkboxes next to the properties that you want available in the report. This step in the wizard should look similar to Figure 20-29. Click the Next button to continue.
The third step allows you to design the report layout by dragging-and-dropping the columns onto the report canvas. Drag the desired column to the right-hand side of where it says DROP HERE. Use the Search Report Data textbox to find the SmartObject property. When completed the step should look like Figure 20-30. Click the Next button to continue.
The following step allows you to set up the row grouping for the report. This is applicable only to Summary and Matrix reports. Drag the desired property to the report canvas where it says DROP HERE. This groups the report by the chosen property. The completed step should look similar to Figure 20-31.
When you are creating a Matrix report, a column grouping step appears next. It works in the same way as the row grouping step. Since you are creating a Summary report in this example, you won't see the column grouping screen. Click the Next button to continue.
The steps from here on are all optional and not required to create a report; thus, you can click on the Preview, Save As, and Save buttons at any step. The fourth step allows you to summarize the report data. Drag the desired Summary Filter option to the corresponding report column where it says DROP HERE. Click the Next button to continue.
The fifth step allows you to filter the data returned in the report. To create a filter, drag one of the items listed in the Summary Filters list to a Field on the Filter canvas (where it says DROP HERE). Select the appropriate operator value for the Operator drop-down list. The Value options are dependent on the selected property data type. In this example, the value options for a date property allow for the selection of a custom date range. Once all the filters have been added, you can add conditional statements to the filters.
The completed step should look like Figure 20-32. Click the Next button to continue.
The sixth step in the wizard allows you to set parameter values for the report. This step appears only if there is at least one SmartObject property that accepts parameters. Enter the parameter value in the Default Value column next to the applicable property. In this example, we are not setting any parameters. Click the Next button to continue.
The seventh step allows for setting the formatting style of the report. On the design canvas there is a Formatting Toolbar that allows you to set font, alignment, and color options. Click on a desired column and format the report using the Formatting Toolbar. Click the Next button to continue.
The final page of the wizard is a confirmation of the report being created. From here you can choose to view the report, design a new report or publish the report.
The Save As button is available. This is handy if you have edited an existing report and then want to save it with another name. Click the Finish button to continue.
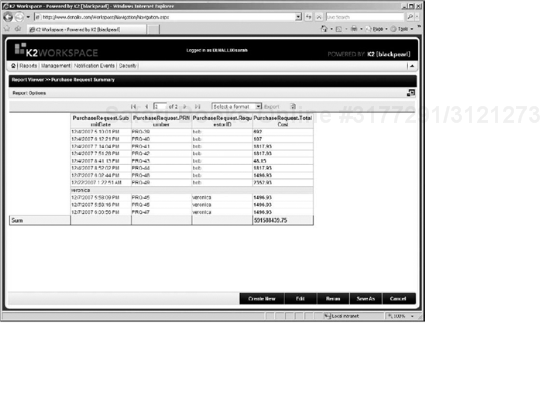
After clicking the Finish button, the report is displayed and looks similar to Figure 20-33.
Clicking on the Save As button brings up a Save Report As window. You are prompted to enter the Name of the report and to select a location to save it to. Click the OK button to save the report.


Once the report has been saved, it can be seen on the Reports tab.
You can easily edit, run, or delete existing reports by clicking on the downward arrow that can be found when you hover over the Date Saved column header in the reports list, as shown in Figure 20-34.

When you are viewing a report, you can alter some of the report configuration without editing the report. Click on the icon in the top-right corner of the report (you can see the icon back in Figure 20-33).
This displays the options (Figure 20-35) that can be altered so that you can run the report again using the new configuration settings.
You can also add reports to the user's Favorites Folder, allowing for quick access to frequently run reports. This is done by right-clicking on the report in the Public Folder and selecting Add to Favorites, as shown in Figure 20-36.

K2 blackpearl makes use of Report Definition Language (RDL) for reports that are created by the Report Designer on the Reports tab. It is used by Microsoft SQL Server 2005 Reporting Services and other RDL-compliant authoring tools such as SQL Server Business Intelligence Development Studio and some third-party reporting tools. This means that reports can easily be created in Microsoft Visual Studio 2005, using the Report Designer, and then imported into the K2 Workspace. Similarly, reports created in the K2 Workspace can be exported to Visual Studio 2005.
Reports that have been published can be exported to Microsoft SQL Server 2005 Reporting Services. Once exported, reports can be edited in Report Builder. This allows for the creation of reports touching multiple data sources, which is useful when the data sources are not exposed to the K2 platform through SmartObjects.
To do this open the Microsoft SQL Server Management Studio by selecting Start
When you are prompted to connect to the server, select Reporting Services from the Server type drop-down list and the desired server from the Server name drop-down list.
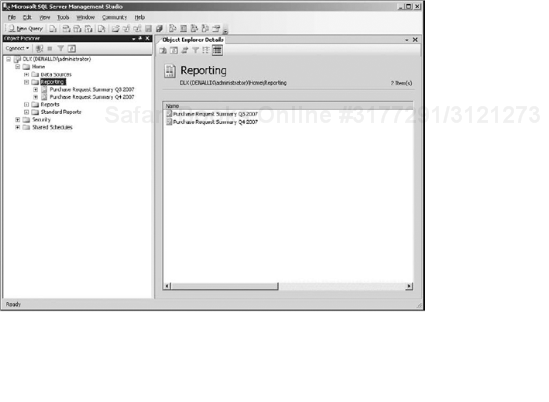
In the Management Studio expand to the Reporting folder in the Object Explorer, as shown in Figure 20-37. Right-click on the desired report and select Edit Report. This will open a Save Dialog box that can be used to save the report to the desired location. Once saved, the report has been exported and is available to be opened in Microsoft Visual Studio 2005.
You can create Microsoft SQL Server 2005 Reporting Services reports that use SmartObjects as data sources and that can be imported into the Reports tab on the K2 Workspace. Using Microsoft Visual Studio 2005 to create these reports allows you to use all of the features available through the Report Designer. The following section explains how to create such a report.
Open Microsoft Visual Studio 2005 by clicking Start

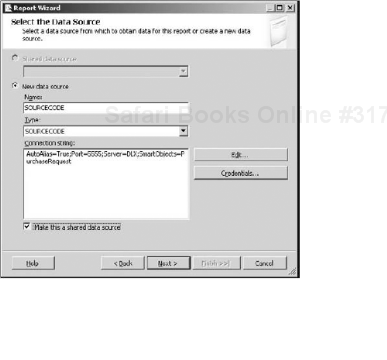
The next step deals with selecting the data source, as shown in Figure 20-38. Select the New data source radio button and enter SOURCECODE in the Name textbox. Ensure that SOURCECODE is selected in the Type drop-down list.
Click the Edit button to open the Connection Properties window, as shown in Figure 20-39. Set the connection properties to the K2 server, that is, Port Number, Server Name, and required SmartObjects.
If the OK button is disabled, click the Change button next to the Data Source textbox. Select the required data source, and click OK.
To set the SmartObjects, click on the. . . button next to the SmartObject property. This opens the Select SmartObjects window.
Once all of the desired SmartObjects have been selected, click the OK button to return the Report Wizard. Click the Next button to continue.
The next step in the wizard allows you to design the query that forms the basis of the dataset used for the report.
Click the Query Builder button to open the Query Builder, as shown in Figure 20-40. Write the query, and click the ! button to see the data returned.
Once the process has completed, click the OK button to return to the Report Wizard. Click the Next button to continue.
The next step allows you to select the Report Type. Select the report type, and click the Next button to continue.
The next step allows you to design the table used to format the report. Select the dataset fields and move them to the desired report field sections, as shown in Figure 20-41. Click the Next button to continue.
The next step allows you to choose the layout for the table used as the basis of the report. Choose the desired layout. Click the Next button to continue.
The next step allows you to choose the style for the table. Select the desired style, and click the Next button to continue.
The next step is the final step in the wizard. It allows you to enter a name for the report in the Report name textbox. Check the Preview report checkbox to display the final reportand click the Finish button to end the Report Wizard.
Microsoft Visual Studio 2005 displays the report, as shown in Figure 20-42. Using the Report Designer the report layout can be altered as desired.
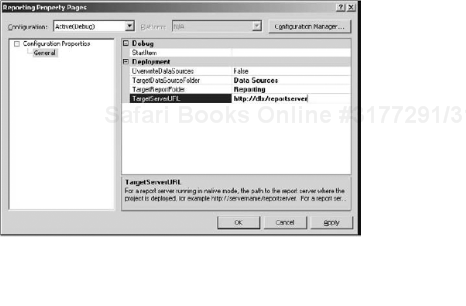
Once you're happy with the report, right-click the project in the Solution Explorer and select Properties. This opens the Property Page dialog, as shown in Figure 20-43. Ensure that the TargetServerURL property is set. Once that is done, right-click on the report in the Solution Explorer and select Deploy. This deploys the report the Reporting Server. It is now ready to be imported into the K2 Workspace.


To import reports running on Microsoft SQL Server 2005 Reporting Services into the K2 Workspace, click on the Import from Reporting Services button, as shown in Figure 20-44.

This opens the Import Reports window, as shown in Figure 20-45. Expand the Reporting Services folders on the left-hand side of the window and navigate to the report that you wish to import. Click on the report, and drag it to the Category in the Category System on the right-hand side of the window. Click OK to continue.

Once you've completed these steps, the report will be displayed along with the other reports in the Reports tab of the K2 Workspace.
The Notification Events tab of the K2 Workspace allows for the creation of Notification Events that notify users by e-mail of events that occur on the K2 and third-party servers. The events can be raised by third-party servers, from K2 processes, and from single and recurring scheduled tasks. This section gives a brief overview of the notification events and how to create Notification and Custom Events.
There are a number of components that deal with the execution of events and thus Event Notifications. The first is the Custom Event Recorder, which subscribes to the server events, using event handlers. Once an event executes, the event is raised in the Generic Client Recorder.
The Generic Client Recorder retrieves the custom events associated with the event that executed, resolves any actions associated with the custom events, and handles the queuing of the resolved events.
Queuing is processed using transactional queues in Microsoft Message Queuing (MSMQ). From there the events are persisted to the Event database through the Event Bus. Once persisted to the Event database, the resolved events are mapped to action policies. These policies in turn are responsible for sending the notification e-mail and raising any configured custom events.
For more information on the Event Bus see Chapter 21.
There are two types of events that the user can create and be notified about upon their execution, Notification Events and Custom Events. Events are created using the Notification Event Designer or Custom Event Designer. These events are simple to create and can be created by workflow participants, developers, or administrators. They can be added to monitor deployed processes without the need for redeploying the workflow solution. It provides a great way to trigger events when you are troubleshooting a deployed process or returning information at peak periods.
Notification Events can also be created when developing the workflow process. Each activity has a set of Event Notifications Settings that can be configured during the development phase. Setting these sends a notification e-mail to the activity destination users.
Notification Events are created using the Notification Event Designer found on the Notification Events tab in the K2 Workspace. Figure 20-46 shows the Notification Event Designer. The Notification Event Designer displays existing events and allows for the creation of new events.
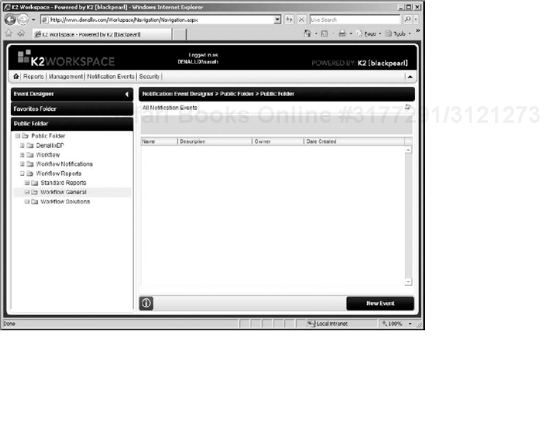
New events can be created by clicking the New Event button. This is done with the aid of the Add Notification Event Wizard, which walks you through the following steps:
The first step in the wizard requires the Notification Event name and description. After entering a name and description, select the location for the Notification Event to be displayed. Click the Next button to continue.
The second step in the wizard deals with selecting the source for the Notification Event, as shown in Figure 20-47. Select the event that you want to subscribe to. It can be from a K2 server or a third-party server. In this example it is from the K2 Workflow server and relates to a deployed process. Click the Next button to continue.
The third step in the wizard deals with configuring the e-mail notification, as shown in Figure 20-48. You specify the e-mail properties, including the sender, recipient, subject, and body. The body can be formatted in HTML or be plain text. When configuring the e-mail, you can use the Object Browser to drag process fields, data fields, and XML fields to assist in personalizing the e-mail content. Click the Finish button to continue.
The final step in the wizard gives you the option of creating another event or returning to the location that the event has been saved to.


Creating a Custom Event is done by using the Add Custom Event Wizard. This wizard is similar to the Add Notification Event Wizard, apart from the third step. In the Add Custom Event Wizard the third step is the Custom Event step (as opposed to the Notification step), although it deals with the same functionality, that is, sending a notification e-mail. Figure 20-49 shows the Custom Event step.

To complete this step you click the Add Action button to add an action that will occur when the event subscribed to has executed. The Add Action button opens a dialog that allows you to search for an assembly that you want to reference, the class within the assembly selected, and the method to call. Once you have made a selection, the Action Parameters are populated with the method input parameters. In this case the Send method requires Recipient and Message parameters.
In this chapter you've become familiar with the K2 Workspace and all of the functionality it brings with it. First, the chapter covered the K2 Home Page, the page that most visitors to the K2 Workspace see and use. You saw the options available to the workflow participants to manage worklists.
You also were introduced to the reporting capabilities of K2 blackpearl. The K2 Workspace provides simple yet powerful report creating capabilities. The reports are easily imported and exported to Microsoft SQL Server Reporting Services.
You were also introduced to Notification and Custom Events and how to create them. They can provide timely information to participants and administrators alike.
The next chapter introduces the Event Bus. It is a component of the K2 platform that allows notifications and custom assemblies to be called when an event occurs. These events can be raised by third-party servers, from a process, or from a single or recurring schedule.