
I was perhaps too hasty proposing this solution to Mr Clough—he is a great professional, but I have never heard of one of his requests going unsatisfied. Moreover, his words made me think is not excluding the hypothesis of fraud. And this makes me even more nervous, if that's possible.
Nevertheless, we have to do this as if it is business as usual. The point is that we need some kind of data related to default events in the past and the companies that experimented this status. What? They also gave you a dataset about past default events? And you already cleaned it? That is what I call good news. OK, just send it to me and we can start to work on it immediately.
clean_casted_stored_data_validated_complete, uh? You don't fear long names, do you? Just run glimpse on it and see what is inside:
glimpse(clean_casted_stored_data_validated_complete)

Observations: 11,523
 Variables: 16
 $ attr_3 <dbl> 0, 0, 0, 0, 0, 0, 0, 0, 0, 0, 0, 0, 0, 0, 0, 0, 0, 0, 0, 0, 0, 0, 0, 0, 0, 0, 0, 0, 0, 0, 0, 0, 0, 0, 0, 0, 0, 0, 0, 0, ...
 $ attr_4 <dbl> 1, 1, 1, 1, 1, 1, 1, 1, 1, 1, 1, 1, 1, 1, 1, 1, 1, 1, 1, 1, 1, 1, 1, 1, 1, 1, 1, 1, 1, 1, 1, 1, 1, 1, 1, 1, 1, 1, 1, 1, ...
 $ attr_5 <dbl> 0, 0, 0, 0, 0, 0, 0, 0, 0, 0, 0, 0, 0, 0, 0, 0, 0, 0, 0, 0, 0, 0, 0, 0, 0, 0, 0, 0, 0, 0, 0, 0, 0, 0, 0, 0, 0, 0, 0, 0, ...
 $ attr_6 <dbl> 1, 1, 1, 1, 1, 1, 1, 1, 1, 1, 1, 1, 1, 1, 1, 1, 1, 1, 1, 1, 1, 1, 1, 1, 1, 1, 1, 1, 1, 1, 1, 1, 1, 1, 1, 1, 1, 1, 1, 1, ...
 $ attr_7 <dbl> 0, 0, 0, 0, 0, 0, 0, 0, 0, 0, 0, 0, 0, 0, 0, 0, 0, 0, 0, 0, 0, 0, 0, 0, 0, 0, 0, 0, 0, 0, 0, 0, 0, 0, 0, 0, 0, 0, 0, 0, ...
 $ default_numeric <chr> "0", "0", "0", "0", "0", "0", "0", "0", "0", "0", "0", "0", "0", "0", "0", "0", "0", "0", "0", "0", "0", "0", "0", "0", ...
 $ default_flag <fctr> 0, 0, 0, 0, 0, 0, 0, 0, 0, 0, 0, 0, 0, 0, 0, 0, 0, 0, 0, 0, 0, 0, 0, 0, 0, 0, 0, 0, 0, 0, 0, 0, 0, 0, 0, 0, 0, 0, 0, 0,...
 $ customer_code <dbl> 8523, 8524, 8525, 8526, 8527, 8528, 8529, 8530, 8531, 8533, 8534, 8535, 8536, 8537, 8538, 8539, 8540, 8541, 8542, 8544, ...
 $ attr_10 <dbl> -1.000000e+06, 7.591818e-01, -1.000000e+06, 6.755027e-01, 1.000000e+00, 1.000000e+00, 9.937470e-01, 1.000000e+00, 3.7204...
 $ attr_11 <dbl> 3.267341e-02, 4.683477e-02, 4.092031e-02, 1.482232e-01, 3.383478e-02, 6.593393e-02, 6.422492e-02, 2.287126e-02, 4.475434...
 $ attr_12 <dbl> 7598, 565, 50000, 1328460, 389, 25743, 685773, 27054, 48, 648, 1683, 5677342, 322, 775, 150000, 1054413, 116014, 4424, 2...
 $ attr_13 <dbl> 7598, 565, 50000, 749792, 389, 25743, 1243, 27054, 48, 648, 1683, 1358, 322, 775, 150000, 16351, 115937, 4424, 273, 827,...
 $ attr_8 <dbl> -1.000000e+06, 4.365132e-01, 8.761467e-01, 1.000000e+00, 6.800000e-01, 9.530645e-01, 2.065790e-01, 7.828452e-02, 2.06512...
 $ attr_9 <dbl> 10000.83, 10000.84, 10000.70, 10000.78, 10000.28, 10000.15, 10001.00, 10000.00, 10000.00, 10000.00, 10000.89, 10000.99, ...
 $ commercial_portfolio <chr> "less affluent", "less affluent", "less affluent", "less affluent", "less affluent", "less affluent", "less affluent", "...
 $ business_unit <chr> "retail_bank", "retail_bank", "retail_bank", "retail_bank", "retail_bank", "retail_bank", "retail_bank", "retail_bank", ...
glimpse is a function provided by dplyr to quickly inspect the content of a data frame and gain basic information about it, such as the number of variables and the kinds of variables for each column.
Uhm... I can see this table doesn't have exploitative labels for every attribute. Nevertheless, these attr_...s remind me of an email I received some time ago about a standard report the IT department was trying to create to merge information related to customers from different legacies. I should still have it here in the mailbox. Here it is:
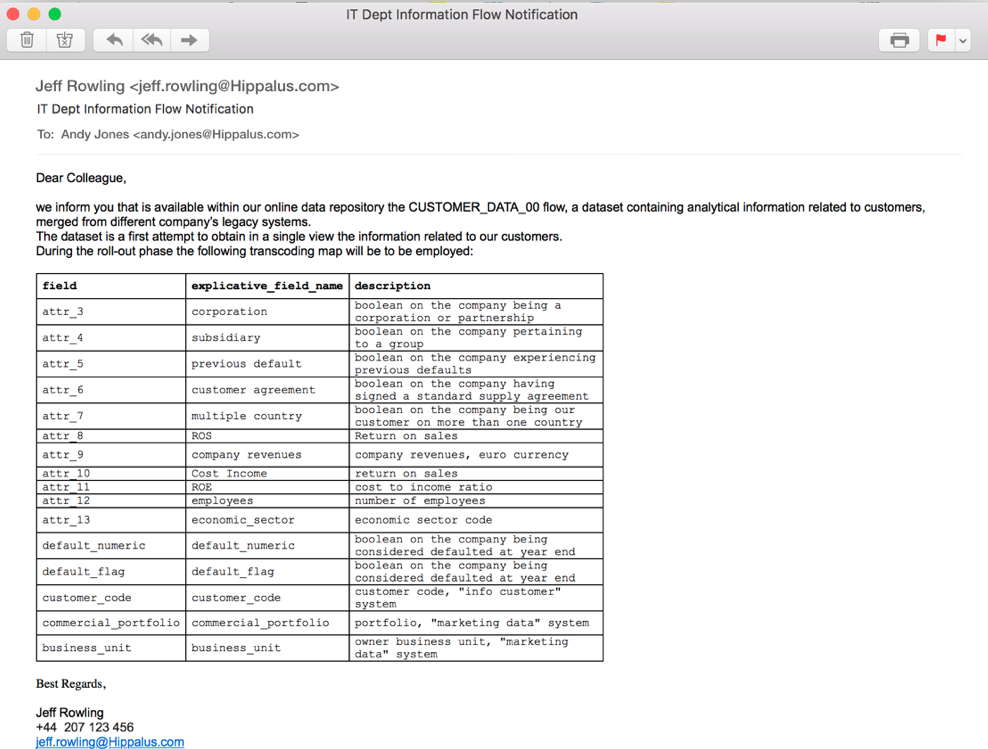
We have here our transcoding map. Let us reassign column names based on this table. First of all we need to check for the actual names and the order of columns. We can use the colnames() function for that:
colnames(clean_casted_stored_data_validated_complete)

 [1] "attr_3"
 [2] "attr_4"
 [3] "attr_5"
 [4] "attr_6"
 [5] "attr_7"
 [6] "default_numeric"
 [7] "default_flag"
 [8] "customer_code"
 [9] "geographic_area"
 [10] "attr_10"
 [11] "attr_11"
 [12] "attr_12"
 [13] "attr_13"
 [14] "attr_8"
 [15] "attr_9"
 [16] "commercial_portfolio"
 [17] "business_unit"
We can now change those names, leveraging the same function and an assignment operator:
colnames(clean_casted_stored_data_validated_complete) <- c("corporation",
                                          "subsidiary" ,
                                          "previous_default",
                                          "customer_agreement",
                                          "multiple_country",
                                          "default_numeric",
                                          "default_flag" ,
                                          "customer_code",
                                          "cost_income",
                                          "ROE",
                                          "employees",
                                          "economic_sector",
                                          "multiple country",
                                          "ROS" ,
                                          "commercial_portfolio",
                                          "business_unit")
While on the first line of code, we are asking to R to show us the column names, on the second block, we are actually telling R what the names are. Calling the same function for the third time will let us appreciate intervened changes.
We now have a dataset containing historical information about our customers, including the relevant information of default status. The next step is defining a data mining plan. They told me you are familiar with the CRISP-DM methodology. I should have here a typical representation of the CRISP-DM cycle:
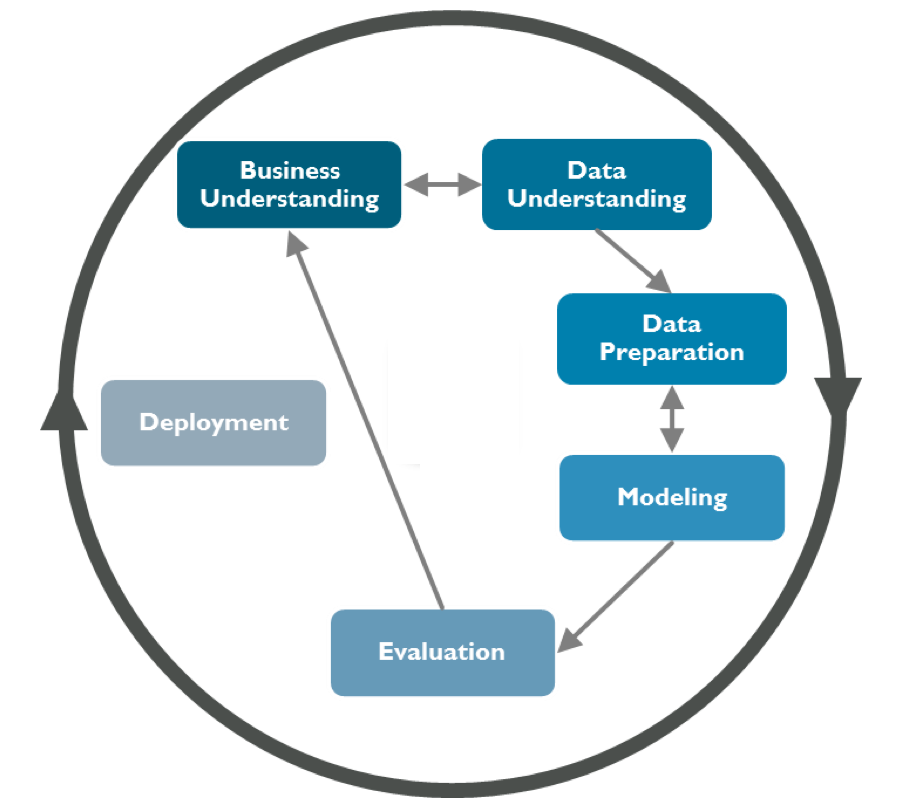
We performed data understanding through our exploratory data analysis (EDA), and we did data preparation when dealing with data cleaning and validation. It is now time to proceed to the modeling phase.
As you know, the first step here is to define a data modeling strategy. Since the problem here is to understand what common features are shared by customers going into default, we are not focused here on the prediction of future defaults, but rather on the analysis of the past.