
One hypothesis we could make is that these companies, or at least a good part of them, are from the same industry. Is that true?
We actually have the data to figure this out. If we look back at our information dataset, we can easily see that some of the records start with the industry token. These are the records reproducing the line related to the customer's industry, which is contained within every customer card.
Let's filter out all the other records to retain only those records that specify the industry of the company:
information %>%
 filter(grepl("industry", text))

This is fine; nonetheless, we still have that industry: token, which is meaningless. Let's remove it by using the gsub() function. This function basically substitutes a pattern with a replacement within a character vector. Therefore, to apply it, you have to specify the following:
- The pattern to look for, through the argument pattern
- The replacement to put where the pattern is found
- The vector where the pattern has to be searched
information %>%
filter(grepl("industry", text)) %>%
mutate(industry = gsub("industry: ","",text))-> industries
We can now easily visualize the result in a nice bar plot. To obtain a readable result, we will filter out the industries occurring less than twice:
industries %>%
count(industry) %>%
filter(n >1) %>%
ggplot(aes(x = industry, y = n)) +
geom_bar(stat = 'identity')+
coord_flip()

It looks nice and the industry labels are easily readable. Yet there is not much insight in it; nearly all industries have the same frequency, meaning that this attribute is not what correlates the companies we are analyzing. Let's hope for a better result with the shareholders list.
First of all, let's isolate all the records related to shareholders from the information data frame, also removing the share holders token:
information %>%
 filter(grepl("share holders", text)) %>%
 mutate(shareholders = gsub("share holders: ","",text))

What is the problem now? I guess it is that we have at least two different shareholders for every record, which makes it impossible to perform further analysis on them. We have to fix it by separating the shareholders into columns and then gathering the result into a single column. If you know a bit about the tidy data framework, we are going to make our data wide at the beginning here and then make it long by employing the gather function.
Let's start with the widening phase, which we can perform by employing the separate function from the tidyr package:
information %>%
 filter(grepl("share holders", text)) %>%
 mutate(shareholders = gsub("share holders: ","",text)) %>%
 separate(col = shareholders, into = c("first","second","third"),sep = ";")
We specify here that we want to take the shareholders column and split it into three new columns, named first, second, and third. To make the function understand when to split, we specify ; as a separator.

This is close to what we were looking for, even if there are still some NAs to be dealt with in the third column. It comes from some companies having two rather than three shareholders.
Let's now make our data long using the gather function. We specify that we want to create a new key column to store the labels of columns first, second, and third, and a value column to store the names of the shareholders:
information %>%
 filter(grepl("share holders", text)) %>%
 mutate(shareholders = gsub("share holders: ","",text)) %>%
 separate(col = shareholders, into = c("first","second","third"),sep = ";") %>%
 gather(key = "number",value ="shareholder",-company,-text)
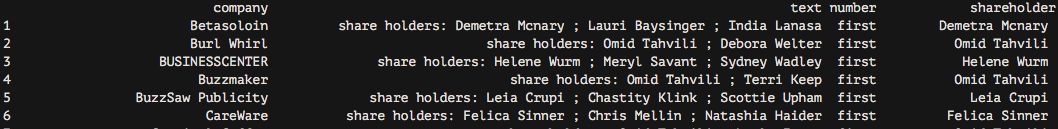
Because we specified -company and -text, the two corresponding variables are used as grouping variables. The very last step is to select only the columns we are interested in, the company and the shareholder columns:
information %>%
 filter(grepl("share holders", text)) %>%
 mutate(shareholders = gsub("share holders: ","",text)) %>%
 separate(col = shareholders, into = c("first","second","third"),sep = ";") %>%
 gather(key = "number",value ="shareholder",-company,-text) %>%
 filter(!is.na(shareholder)) %>%
 select(company,shareholder)-> shareholders
Nice! What's next? We have a list of companies and shareholders. Shouldn't we try to check if there are common shareholders? We can simply do this with another bar plot, but this could make us miss some relevant information, Industries where exclusive among each other, meaning that a company could pertain to only one industry at the time. This is not true for shareholders. Since every company can have one to three shareholders, we should try to find out a convenient way to visualize this information without losing its richness and complexity.
A great way to do this is via network analysis.