Using the Resource Center
The Resource Center provides detailed information about enterprise resources stored in the enterprise resource pool, allowing managers to quickly view and analyze resource attributes, assignments, utilization, and availability.
The Resource Center can be accessed from either Microsoft Project Web Access (by selecting Resources) or from Microsoft Project Professional (by selecting Collaborate, Resource Center).
NOTE
When accessing the Resource Center via Project Professional, you can see only the View Enterprise resource in the Resource Center display, as described in “Viewing Enterprise Resources in the Resource Center,” later in this chapter. You can use Web Access to see and take advantage of all of the Resource Center’s features.
The administrator establishes permissions to see resource assignments in order for resource information to display.
There are three options available under the Resource Center:
View Enterprise Resources in Resource Center
Analyze Resources in Portfolio Analyzer
View Resource Assignments
Each of these options is described in more detail in the following sections.
NOTE
By default project managers can see only the View Resource Assignments option. When the project manager chooses the option, only resources that have been assigned to projects the project manager has permission to view display.
Viewing Enterprise Resources in the Resource Center
 | To view enterprise resources in the Resource Center, select Resources, View Enterprise Resources in Resource Center in Web Access, or select Collaborate, Resource Center in Project Professional. |
The Resource Center is installed with a single predefined view named Resources Summary, as shown in Figure 27.15.
Figure 27.15. You can use the Resource Center’s default view to get enterprise resource information details.

The resources that are visible to the user in Resource Center views depend on the user’s specific authorization with Microsoft Project Server. That is, the list of resources you are able to view depends on the level of authorization you have with the Project Server.
CAUTION
Resources that are local to any of the project plans in the Project server database do not display in a Resource Center view.
The Microsoft Project Server administrator can modify this default view or define additional views by selecting Admin, Manage Views.
On the initial Resource Center view are two extremely useful views: Edit Resource Details and View Availability. You can select more than one resource for the Availability View by highlighting multiple entries while holding down the Shift or Ctrl keys.
Using the Resource Center’s View Options
You can use the Resource Center’s View Options tab to refine the contents of the data being displayed. You can click on the View Options tab to see the list of View options that are available, or you can click the + and - icons at the left side of the tab to expand or collapse the View Options display. All of the Resource Center View Options are listed here, organized by View.
Under View Enterprise Resources in Resource Center you will find:
Show Time with Date— The Show Time with Date view option adds the time, in HH:MM:SS format, to the date in each of the appropriate date values when the box is checked. If the box is not checked, only the date is displayed.
Under View Availability you will find:
Date range— You can specify the date range by either typing the date into the box or selecting the date from the calendar that is displayed if the drop-down list box is selected.
Units— You can select the units of either days or weeks by using the drop-down list box and choosing the desired option. When the date range and units options are selected, you generate the graph timeframe by clicking the Set Dates button.
Under View Resource Assignments you will find:
Show Time with Date— The Show Time with Date view option adds the time, in HH:MM:SS format, to the date in each of the appropriate date values when the box is checked. If the box is not checked, only the date is displayed.
Show Summary Tasks— The Show Summary Tasks view option either shows (if the box is checked) or does not show (if the box is unchecked) all summary tasks, where summary tasks are defined as tasks that are marked with Yes in the Summary field in Microsoft Project.
Show To-Do Lists— You can check the Show To-Do Lists check box if you want to see the contents of each resource’s to-do lists added to the list of displayed tasks.
Nonproject Time— You can check the Nonproject Time check box if you want any non-project time values that have been defined by the administrator added to the list of displayed tasks for each resource.
Show scheduled work— You can check the Show scheduled work check box if you want to add the Work field to the display of each task or milestones.
Show overtime work— You can check the Show scheduled work check box if you want to add the Overtme Work field to the display of each task or milestones.
Show (Outline Levels)— The Show (Outline Levels) pull-down list restricts the display to tasks that are at or above the specified outline level. For example, if Level 2 is specified, any task that has three or more entries in its Work Breakdown Structure code will be excluded.
Date range— You can specify the date range by either typing the date into the box or selecting the date from the calendar that is displayed if the drop-down list box is selected.
Using the Resource Center’s Filter, Group, Search Tab
You select the Filter, Group, Search tab to display or hide the Resource Center’s filtering, grouping, and searching options.
The options associated with the Resource Center’s Filter, Group, Search tab are identical to that of the Project Center, the only difference being that you are operating on resource data instead of project data. See “Using the Project Center’s Filter, Group, Search Tab”, page xxx, for details on filtering, grouping and searching related to resources.
The Edit Resource Details View
By selecting a resource from the initial Resource Center view and selecting Edit Resource Details, you can see and edit (if you have the appropriate permissions) the resource’s enterprise resource outline codes, as shown in Figure 27.16.
Figure 27.16. You can use the Edit Resource Details screen to view and edit enterprise resource outline codes.
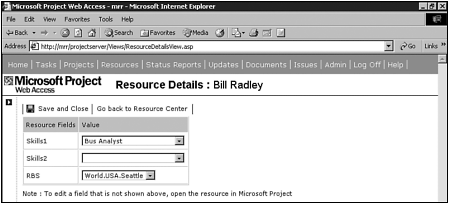
You can have only one resource selected when you navigate to the Edit Resource Details screen. If you have more than one resource selected, you are prompted with an error message.
The View Availability View
By selecting one or more resources from the initial Resource Center view and selecting the View Availability link, you gain access to several useful resource work and availability views. By default, the Assignment Work by Resource view is always the initial view displayed.
The four Resource Availability views have the following common characteristics:
If multiple resources have been selected for the Availability view, you can switch individual resources into or out of the graph by selecting or deselecting resources via the check boxes next to the resources’ names.
At the top of the Resource Availability view is the View Options box, which you can collapse or expand by clicking the + or - buttons. The View Options box allows you to select the timeframe for the graph. This selection appears in the three parts—the start date, the end date, and the units—as shown in Figure 27.17.
Figure 27.17. You can use the View Options box to select the timeframe for a graph.

You can specify the date range by either typing the date into the box or selecting the date from the calendar that is displayed if the drop-down list box is selected.
You can select the units of either days or weeks by using the drop-down list box and choosing the desired option.
When the date range and units options are selected, you generate the graph timeframe by clicking the Set Dates button.
NOTE
For the Resource Availability view a week is defined as starting on a Sunday and ending on a Saturday. One column is displayed for each week or part of a week that is covered by the start and finish dates. For example, if the dates selected ran from one Wednesday to the next Tuesday, there would be two columns. The first column would contain data for Wednesday to Saturday, and the second column would contain data for Sunday to Tuesday.
You can move through the timescale of the graph by clicking the back or forward arrows displayed at the ends of the date range.
Four predefined Resource Availability Views are available from the Choose a View pull-down list:
Assignment Work by Resource— The Assignment Work by Resource view, shown in Figure 27.18, displays assignment work by the resources that have been selected for this view, where assignment work is the total work currently defined for the resource(s) from all Published projects.
Figure 27.18. The Assignment Work by Resource view displays all the work currently defined for the selected resource(s) from all Published projects, by resource.
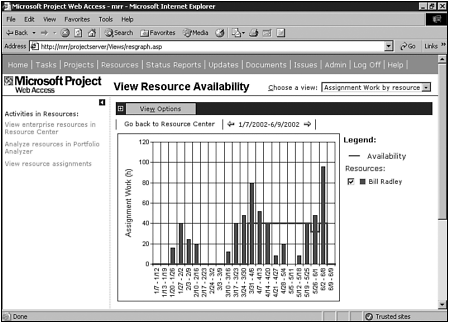
Resource capacity is also shown on the graph, making it easy to determine whether and when the selected resources are underallocated or overallocated. Resource Capacity is the total amount of effort that can be assigned to the resource without overallocation, and it is based on the resource’s availability and resource calendar.
Assignment Work by Project— The Assignment Work by Project view, shown in Figure 27.19, displays assignment work by the resources that have been selected for this view, but instead of the assignments displayed by resource (regardless of project), this chart shows the data by project.
Figure 27.19. The Assignment Work by Project view displays all the work currently defined for the selected resource(s) from all Published projects, by project.
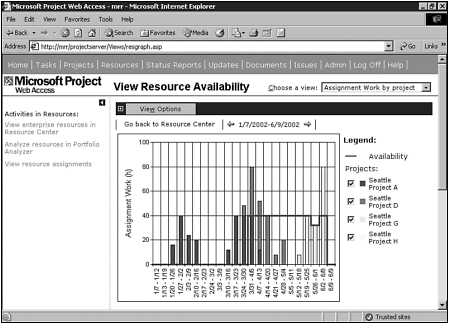
Figure 27.19 shows the assignment work for Margaret Radley, but this is difficult to know because the resource’s name is not visible on the display. You have to remember which resources were selected before you select this view.
Remaining Availability— The Remaining Availability view, shown in Figure 27.20, displays the amount of time that the selected resource(s) has available for work, over time.
Figure 27.20. The Remaining Availability view displays the amount of time that the selected resource(s) has available for work, over time.

Work— The Work view, shown in Figure 27.21, displays the amount of work that the selected resource(s) is assigned to do over time.
Figure 27.21. The Work view displays the amount of work that the selected resource(s) is assigned to do, over time.
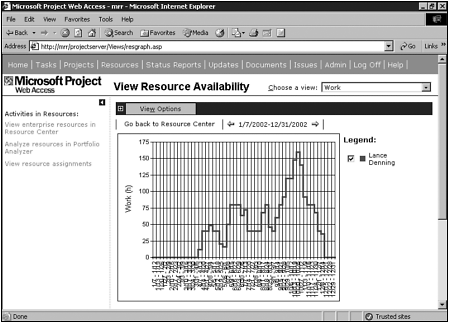
The Resource Center views provide ways for you to look at resource utilization across the enterprise. If you select the Elkhart Company’s Denver Tester (that is, Lance Denning) and click the View Availability button, for example, you can immediately see Lance’s overallocation displayed graphically, as shown in Figure 27.21.
Analyzing Resources in Portfolio Analyzer
If you navigate to Projects, Analyze Projects in Portfolio Analyzer, you get exactly the same view, and tools, as if you were in Web Access and selected Resources, Analyze Resources in Portfolio Analyzer.
→ For descriptions of the Analyze Projects in Portfolio Analyzer view, see “Analyzing Projects in the Portfolio Analyzer,” p. 1079.
Viewing Resource Assignments
The Viewing Resource Assignments screen is similar to Project’s Task Usage view in that it displays details for each assignment (for example, task name, percentage of work complete) per resource, as shown in Figure 27.22. This view is useful for those who need access to this type of information but don’t have access to Microsoft Project.
Figure 27.22. Assignments for the selected resource(s) are grouped by resource, by project.

After selecting a task, you can click the Link to Issues icon to navigate to the Issues page for the selected task. From the Issues screen you can create a new issue or create a link to an existing issue. After changes have been saved via the Save Changes tab, you can return to the Resource Assignments screen by selecting the Go Back to Assignments option.
After selecting a task you can click the Link Documents icon to navigate to the Documents page for the selected task. From the Documents screen you can upload a new document, or you can link the task to an existing one. After changes have been saved via the Save Changes tab, you can return to the Resource Assignments screen by selecting the Go Back to Assignments option.
Resource assignments can be shown in either a Gantt Chart format or a timesheet format. The Show Assignments Using section assumes a Gantt Chart format, with items that are unique to a timesheet format.
You have the option of displaying all assignments or restricting the view to current assignments, where current assignments are defined as those already in progress or that start within a specified number of days from the current date. The specified number of days is set by the administrator.
The assignments are displayed in a grouped structure of tasks by resource, by projects. Both generic and specific named resources are displayed.
For each resource within each project, the tasks are sorted in the same sequence in which they would be found in the project plan (by task ID). If you click on the Task Name column heading cell, the fields are sorted into alphabetically ascending sequence within project. If you click the cell again, the sort sequence is changed to alphabetically descending.
Viewing Resource Assignments in Timesheet Format
Resource assignment data can also be displayed in timesheet format, which shows the actual effort recorded against each assignment.
There are two differences between the Timesheet format view and the Gantt Chart view:
The standard Office Zoom buttons and the Go To option are replaced with start and end dates for the window in which timesheet data will be displayed (the date range and arrows that will move this window forward and backward in time). If these arrows are used, the date range is automatically set to two weeks and the dates in the View Options tab are updated
The Gantt Chart is replaced with a tabular report showing actual effort for each assignment. The data is displayed in the units specified in the View Options tab, and there are as many columns as there are units in the specified data range.
