
17. Multi-Touch, UIResponder, and Using Instruments
In Chapter 6, you created a UIScrollView that dealt with multi-touch events to translate and scale your view. You have also used UIControl, when you set a target/action pair to be triggered for certain types of events. What if you want to do something else, something special or unique, with touch events?
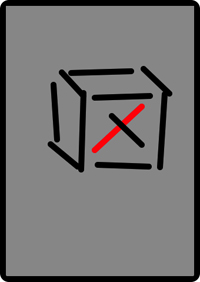
In this chapter, your are going to create a view that lets the user draw lines by dragging across the view (Figure 17.1). Using multi-touch, the user will be able to draw more than one line at a time. Double-tapping will clear the screen and allow the user to begin again.
Figure 17.1. A drawing program
Touch Events
A UITouch object represents one finger touching the screen. Because you can use multiple fingers simultaneously, touches are processed in sets. NSSet is a container class like NSArray, but it has no order and an object can only appear in a set once.
As a subclass of UIResponder, your view can override four methods to handle touch events:
• a finger or fingers touches the screen
- (void)touchesBegan:(NSSet *)touches
withEvent:(UIEvent *)event;
• a finger or fingers move across the screen (This message is sent repeatedly as a finger moves.)
- (void)touchesMoved:(NSSet *)touches
withEvent:(UIEvent *)event;
• a finger or fingers is removed from the screen
- (void)touchesEnded:(NSSet *)touches
withEvent:(UIEvent *)event;
• a system event, like an incoming phone call, interrupts a touch before it ends
- (void)touchesCancelled:(NSSet *)touches
withEvent:(UIEvent *)event;
When the user touches the screen, a UITouch instance is created. The same UITouch object is updated and reused for all touch events associated with an individual finger. It holds all of the information about that finger: where it is, its state, when its state last changed, the view it is on, the number of times it has tapped the screen, and where it has been most recently. When that finger is removed from the screen, the UITouch is discarded.
After the UITouch instance is created, it is sent to the UIView on which the touch occurred via the message touchesBegan:withEvent:. This method has two arguments: an NSSet and a UIEvent. The NSSet instance contains the touch object. Why send an NSSet and not a UITouch? An NSSet is necessary in case two (or more) fingers touch the screen at the exact same time. (In practice, this is very unlikely; we humans are not as precise as we think we are.) If simultaneous touches occur, multiple UITouch instances can be sent in the NSSet.
(Apple could have used NSArray instead of NSSet, but the implementation of NSSet makes it faster to use in this context. The good news is you can iterate over an NSSet in the same way you do an array using fast enumeration in Objective C 2.0.)
Creating the TouchTracker Application
Now let’s get started with your application. In Xcode, create a new Window-based Application and name it TouchTracker. Create a new UIView subclass called TouchDrawView.
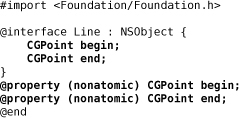
The TouchDrawView is going to need an object that can hold the two end points of a line. Create a new NSObject subclass named Line. In Line.h, declare two CGPoint instance variables and the accessors for setting and getting them:
In Line.m, synthesize the accessors:

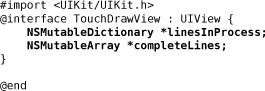
In TouchDrawView.h declare two collections: an array to hold complete lines and a dictionary to hold lines that are still being drawn.
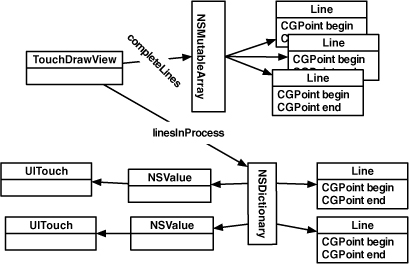
You might be surprised to see that you are using a dictionary to hold the lines that are in the process of being drawn. What do lines have to do with key-value pairs? In this case, you’re using a dictionary to keep track of which UITouch created which Line. So you’ll want to use the UITouch as the key and the Line as the value. However, only objects that have a copyWithZone: method (from the NSCoding protocol) can be used as keys in a dictionary. UITouch does not implement this method, so you can’t use UITouch instances themselves as keys. However, you can wrap a pointer to the UITouch in an NSValue instance and use the NSValue as the key.
Figure 17.2 shows the object diagram for TouchTracker. Take a moment to look it over before continuing on with the creation of your view.
Figure 17.2. Object diagram for TouchTracker
In Chapter 6, you instantiated your custom view programmatically. This time, you will instantiate a custom view in Interface Builder. Open up MainWindow.xib. From the Library, drag an instance of UIView onto the window. In the Identity panel of the Inspector, set its class to TouchDrawView as shown in Figure 17.3.
Figure 17.3. Identity Inspector

Views created programmatically have their initWithFrame: method called; views created in Interface Builder are unarchived using initWithCoder:. Thus, for TouchDrawView, you will override initWithCoder: instead of initWithFrame:.
Save MainWindow.xib and return to Xcode. In TouchDrawView.m, take care of the creation and destruction of the two collections:

Notice that you had to explicitly enable multi-touch events. Without this, only one touch at a time can be active on a view.
Now edit the drawRect: method:
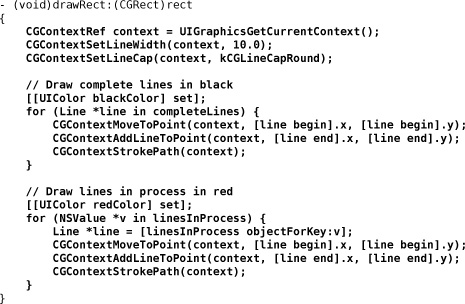
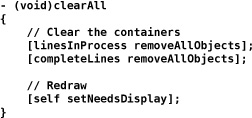
Finally, create a method that clears the collections and redraws the view:
Turning Touches Into Lines
When a touch begins, you will create a new Line instance and store it in an NSMutableDictionary. The key to retrieve the line is the address of the UITouch object stored in an NSValue.
Override touchesBegan:withEvent: in TouchDrawView.m.

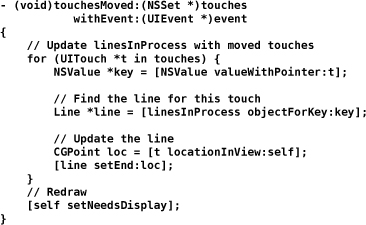
In touchesMoved:withEvent:, you will update the end point of the line associated with the moving touch. Override this method in TouchDrawView.m.
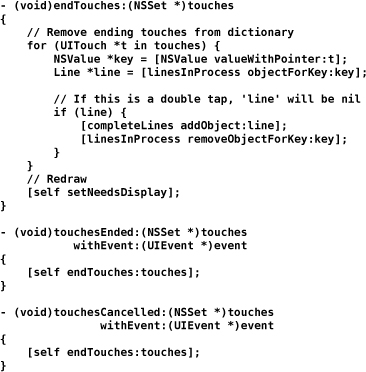
When a touch ends, you need to finalize the line. However, a touch can end for two reasons: the user lifts the finger off the screen or the operating system interrupts your application. A phone call, for example, will interrupt your application. In many applications, you’ll want to handle these two events differently. However, for TouchTracker, you’re going to write one method to handle both cases. Implement these methods in TouchDrawView.m.
Build and run the application. Then draw lines with one or more fingers.
The Responder Chain
Every UIResponder can receive touch events. UIView is one example, but there are many other UIResponder subclasses including UIViewController, UIApplication, and UIWindow. You are probably thinking, “But you can’t touch a UIViewController. It’s not an on-screen object!” And you are right – you can’t send a touch event directly to a UIViewController. (And you get two bonus points for keeping the view controller and its view separate in your brain.)
In Chapter 4, you learned a little about the responder chain. When a responder doesn’t handle an event, it passes it to its nextResponder. How does a UIResponder not handle an event? For starters, the default implementation of methods like touchesBegan:withEvent: simply passes the message to the next responder. So if a method is not overridden, you ensure its next responder will attempt to handle the touch event.
You can explicitly send a message to a next responder, too. Let’s say there is a view that wants to track touches, but if a double tap occurs, its next responder should handle it. The code would look like this:

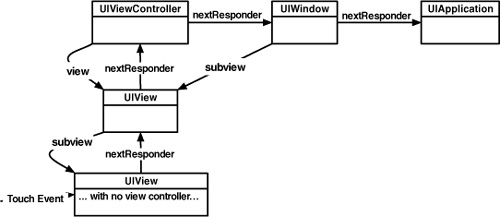
Figure 17.4 shows the objects that make up the responder chain. An event starts at the view that was touched. The nextResponder of a view is its UIViewController. If that view has a view controller that owns it, then the controller is next in line. After that, the superview of the view is given a chance to handle the event. If the touch runs out of views and view controllers, it goes to the window. If the window doesn’t handle it, the singleton instance of UIApplication does. (Note that the window and application objects won’t do anything with an event unless you subclass them.) If the application doesn’t handle the event, then it is discarded.
Instruments
After Xcode and Interface Builder, the most important tool that Apple gives developers is Instruments. When you run your applications in Instruments, it shows you the objects that are allocated, where the CPU is spending all its time, file I/O, network I/O, etc. Instruments has plug-ins that enable you to inspect these issues in more detail. Each plug-in is known as an Instrument. Together, they can help you track down inefficiencies in your application and optimize your code.
The ObjectAlloc Instrument
There is a memory leak in TouchTracker. When the user double-taps, the screen clears. At this point, all instances of Line should be deallocated, but they aren’t. You’re now going to use the ObjectAlloc instrument to confirm this.
While you can profile the application running on the simulator, you’ll get more accurate data on the device. So, build the application for the device, and under the Run menu, choose Run with Performance Tool -> Object Allocations.
Instruments will launch, and, as you interact with your application, it will keep track of every object created and destroyed. Draw a while, double-tap a few times to clear the lines, switch back to Instruments, and click the Stop button to stop recording.
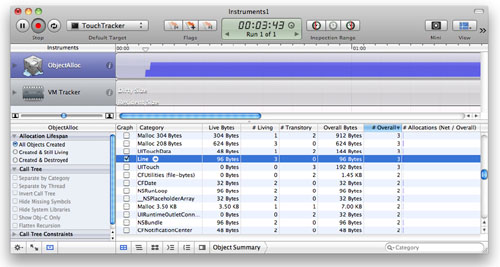
In the Instruments window, find the row for instances of Line by scrolling through the table or using the search bar underneath the table. Notice two counts for the instances, Overall and Living.
Overall is a count of all the instances of Line that have been created during this run of the application. It is the number of times alloc has been sent to the class Line. Living is a count of all the instances of Line that have been created minus those that have been deallocated (the number of Line objects that exist currently). Because the overall and living Line counts are the same in this sampling, you know that no instances of Line were deallocated when you double-tapped to clear lines from the screen. These Lines were leaked.
At the top of Instruments, there is a graph next to the ObjectAlloc instrument. Right now, it is graphing all memory allocations. You can modify that list by checking and unchecking the boxes in the Graph column of the table. Uncheck the box next to “* All Allocations *” and check Line, as shown in Figure 17.5. (If you don’t see “* All Allocations *”, clear the search bar.)
Figure 17.5. Basic ObjectAlloc
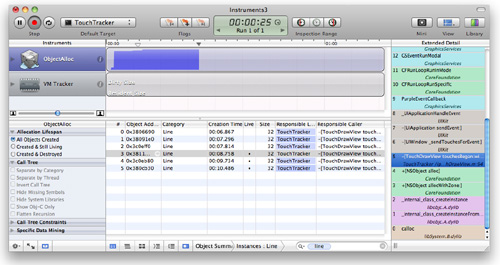
If your Line objects were being properly deallocated, the graph would drop to zero when you double-tapped to clear the drawing. Want to know more about those pesky Line instances that won’t die? If you select the row for Line, a small arrow will appear in the Category column next to the word Line. Click that arrow to see the detailed view (Figure 17.6). Select a particular instance to see the call stack as it appeared when the instance was allocated. If you don’t see the stack, choose View -> Extended Detail from the menu. Also, if the stack does not show the names of the methods being called, make sure your application is being built with the most recent version of the SDK. (In Xcode, choose the most recent version from the Project menu’s Set Active SDK menu item and rebuild.)
Figure 17.6. Detail of one instance’s allocation
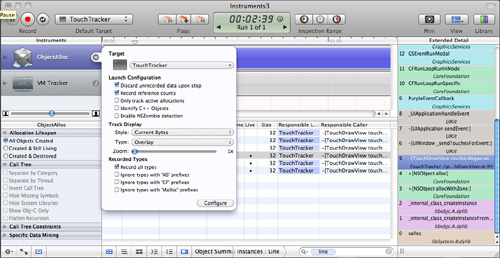
You can also set Instruments to show you every retain and release. While Instruments is not recording, open the Inspector for the ObjectAlloc instrument by clicking on the info button next to it. Check Record Reference Counts as shown in Figure 17.7. Run the application again by clicking the Record button.
Figure 17.7. Record reference counts
Now when you browse the instances, you can see how the stack appeared for every retain and release (Figure 17.8).
Figure 17.8. Inspecting a release

OK, time to fix the memory leak. In touchesBegan:withEvent:, release newLine after you add it to the dictionary:

The Sampler Instrument
Now that you have hunted down wasted memory, let’s look for wasted CPU cycles using the Sampler instrument. Add the following CPU wasting code to the end of your drawRect: method:

Build your application. (Make sure you do this; otherwise Instruments will use the previously built application.) Under the Run menu, select Run with Performance Tool->CPU Sampler to install the application on your device and launch Instruments with the Sampler and the CPU Monitor instruments. Run your application by clicking the Record button and then draw something pretty.
CPU Sampler is useful for finding bottlenecks in your code. The time that your application takes to call each function is compared to the total running time of your application and expressed as a percentage. In a responsive application, the majority of time will be spent in a function called mach_msg_trap. This is the function your application sits in when it is doing nothing. Therefore, you want most of your application’s time to be spent in this function.
Many developers using Instruments for the first time will be concerned over this mach_msg_trap function. Don’t worry about it — a responsive application may report near 100% for this function. However, just because your application does not spend near 100% of its time in mach_msg_trap does not mean it is performing poorly. An application might spend a lot of time performing a task that requires no user input — like processing an image after the user takes a picture. This application would report a lot of time spent in some image processing method. Therefore, there is no rule that says, “If X percentage is spent in this function, your application has a problem.”
Without a handy rule, how do you determine if you have a problem, then? You need to use the results of Instruments in conjunction with the user experience of your application. If, for example, you draw a line in TouchTracker and the application feels unresponsive, you should be concerned with the amount of time being spent in methods while your finger is on the screen. When you want to look at a specific time interval (like when your finger is on the screen), you can drag the playhead on top of the graph and click on the Inspection Range buttons to set the start and stop time of the interval you are interested in.
Now, TouchTracker purposely wastes CPU time by calling the sin function over and over again every time the view is redrawn. Find the number of samples that your CPU spent running the sin function by locating sin symbol name in the table (Figure 17.9).
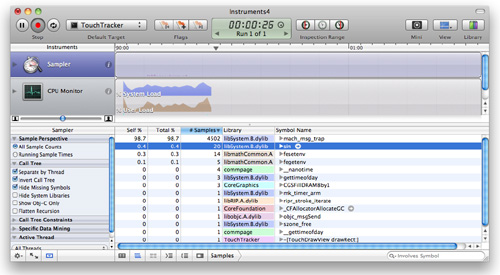
You will notice that a small percentage of time is spent in this function; however, relative to the rest of the function calls, the percentage is very high. You can select the row with sin in it and click the arrow next to it to see the call stack trace for when this function is called. This will show you where you can optimize your code. In this case, you aren’t using sin for anything other than learning how to use Instruments, so the optimization is just to delete the CPU wasting code from drawRect:.
When you get more comfortable with Instruments, you will see some common function calls that always use a lot of CPU time. Most of the time, these are harmless and unavoidable. For example, the objc_msgSend function will occasionally creep up to the top of the list when you are sending lots of messages to objects. (It is the central dispatch function for any Objective-C message.) Usually, it’s nothing to worry about. However, if you are spending more time dispatching messages than actually doing the work in the methods that are triggered and your application isn’t performing well, there is a problem that needs solving.
As a real world example, some Objective-C developers might be tempted to create classes for things like vectors, points, and rectangles for drawing. These classes would likely have methods to add, subtract, or multiply instances in addition to accessor methods to get and set instance variables. When such classes are used, however, the drawing code has to send a lot of messages to do simple things, like creating two vectors and adding them together. These messages add excessive overhead to the simple operation that is being performed. Therefore, the better alternative is to create data types like these as structures and access their memory directly. (This is why CGRect and CGPoint are structures and not Objective-C classes.)
This should give you a good start with the Instruments application. The more you play with it, the more adept at using it you will become. However, there is one final word of warning before you invest a significant amount of your development time using Instruments: if there is no performance problem, don’t fret over every little row in Instruments. It is a tool for finding problems, not for creating them. Write clean code that works first; then, if there is a problem, you can find and fix it with the help of Instruments.
Challenge: Saving and Loading
Save the lines when the application terminates. Reload them when the application resumes.
Challenge: Circles
Use two fingers to draw circles. Try having each finger represent one corner of the bounding box around the circle. (Hint: This is much easier if you track touches that are working on a circle in a separate dictionary.) You can simulate two fingers on the simulator by holding down the option button.
For the More Curious: UIControl
The class UIControl is the superclass for many objects in Cocoa Touch: UIButton, UISlider, UITextField, etc. These objects seem magical — when a touch event occurs in one of these views, an action message is dispatched to a target. But there is no magic to any of these; UIControl simply overrides UIResponder methods.
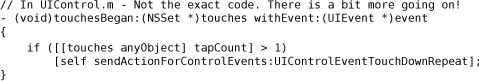
Consider a very common control event: UIControlEventTouchUpInside. You’ve used this control event for the target-action pairs of all of the buttons in this book. Now it’s time to see how UIControl implements it:

Pretty simple, right? Let’s look at UIControlEventTouchDownRepeat:
Those are easy. What about a UISlider? When a touch is dragged across a slider, the control knob moves, and then all targets are sent their action message for UIControlEventValueChanged.

So how do these actions get sent to the right target? The method sendActionsForControlEvents: sends the message sendAction:to:from:forEvent: to the singleton UIApplication instance for each target-action pair registered for that event. UIApplication then delivers the message to the appropriate target.
The controls could send the action messages to the target on their own, but controls can also have nil-targeted actions. In fact, having nil-targeted actions can be very useful. If a UIControl’s target is nil, UIApplication finds the first responder of its UIWindow and sends the action message to it. This is exactly how keyboard input works — each of the buttons on the keyboard has nil-targeted actions, and UIApplication sends the action message to the first responder, which is the active UITextField. How cool is that?