6
Dealing in Practice with Memory Hierarchy Effects and Instruction Level Parallelism
In the first section, we study memory disambiguation mechanisms in some high-performance processors. Such mechanisms, coupled with load/store queues in out-of-order processors, are crucial to improving the exploitation of instruction-level parallelism (ILP), especially for memory-bound scientific codes. Designing ideal memory disambiguation mechanisms is too complex in hardware because it would require precise address bit comparators; thus, microprocessors implement simplified and imprecise ones that perform only partial address comparisons. We study the impact of such simplifications on the sustained performance of some real high-performance processors. Despite all the advanced micro-architecture features of these processors, we demonstrate that memory address disambiguation mechanisms can cause deep program performance loss. We show that, even if data are located in low cache levels and enough ILP exist, the performance degradation may reach a factor of x21 slower if care is not taken on the generated streams of accessed addresses. We propose a possible software (compilation) technique based on the classical (and robust) load/store vectorization.
In the second section, we study cache effects optimization at instruction level for embedded very long instruction word (VLIW) processors. The introduction of caches inside processors provides micro-architectural ways to reduce the memory gap by tolerating long memory access delays. Usual cache optimization techniques for high-performance computing are difficult to apply in embedded VLIW applications. First, embedded applications are not always well structured, and few regular loop nests exist. Real-world applications in embedded computing contain hot loops with pointers, indirect arrays accesses, function calls, indirect function calls, non-constant stride accesses, etc. Consequently, loop nest transformations for reducing cache misses are impossible to apply by compilers, especially at the backend level. Second, the strides of memory accesses do not appear to be constant at the source code level because of indirect accesses. Hence, usual software prefetching techniques are not applicable by compilers. Third, embedded VLIW processors are cheap products, and they have limited hardware dynamic mechanisms compared to high-performance processors: no out-of-order executions, reduced memory hierarchy, small direct mapped caches, lower clock frequencies, etc. Consequently, the code optimization methods must be simple and take care of code size. This chapter presents a backend code optimization for tolerating non-blocking cache effects at the instruction level (not at the loop level). Our method is based on a combination of memory preloading with data prefetching, allowing us to optimize both regular and irregular applications at the assembly level.
6.1. The problem of hardware memory disambiguation at runtime
6.1.1. Introduction
Memory system performance is essential for today’s processors. Therefore, computer architects have made, and are still making, great efforts in inventing sophisticated mechanisms to improve data access rate in terms of latency and bandwidth: multilevel and non-blocking caches, load/store queues for out-of-order execution, prefetch mechanisms to tolerate/hide memory latencies, memory banking and interleaving to increase the bandwidth, etc.
One key micro-architectural mechanism to tolerate/hide memory latency is the out-of-order processing of memory requests. With the advent of superscalar processors, the concept of load/store queues has become a micro-architectural standard. The basic principle is simple: consecutive issued memory requests are stored in a hardware queue and simultaneously processed. This allows the memory requests with shorter processing time (in the case of cache hits) to bypass requests with a longer processing time (in the case of cache misses, for example). Unfortunately, data dependences may exist between memory requests: for example, a load followed by a store (or vice versa) both addressing exactly the same memory location have to be executed strictly in order to preserve program semantics. This is done on-the-fly by specific hardware mechanisms whose task is, first, to detect memory request dependences and, second, to satisfy such dependences (if necessary). These mechanisms are under high pressure in memory-bound programs because numerous in-flight memory requests have to be treated.
In order to satisfy this high request rate, hardware memory dependence detection mechanisms are simplified at the expense of accuracy and performance [JOH 91]. To be accurate, the memory dependence detection mechanism must compare between all the bits of in flight accessed memory addresses: such precise address comparison is an expensive hardware design in the micro-architecture. In practice, the comparison between two accessed memory locations is carried out on a small portion of the addresses: usually, few low order bits are compared to detect data dependence or not. If these low-order bits match, the hardware takes a conservative action, i.e. it considers that the whole addresses match and triggers the procedure for a collision case (serialization of the memory requests).
In this chapter, we show how to study in detail the dynamic behavior of memory request processing. We provide examples on three superscalar processors (Alpha 21264, Power 4 and Itanium 2). Because of the high complexity of such analysis, our study is focused on the different memory hierarchy levels (L1, L2 and L3), excluding the main memory. Our micro-benchmarking codes are simple floating-point vector loops (memory-bound) that account for a large fraction of execution time in scientific computing. In addition, the structure of their address streams is regular, making possible a detailed performance analysis of the interaction between these address streams with the dependence detection mechanisms and bank conflicts. Our aim is not to analyze or optimize a whole program behavior, but only small fractions that consist of simple scientific computing loops. One of the reasons is that the load/store queue conflicts that we are interested in deal with local phenomena because, first, they strictly involve in-flight instructions (present in a limited instructions window). Second, they are not influenced by the context of a whole application as other events such as caches activities. So, it is useless to experiment complete complex applications to isolate these local events that we can highlight with micro-benchmarking. Finally, the number of side effects and pollution of the cache performance in whole complex applications (such as SPEC codes) makes the potential benefits smoothened out. We show that our micro-benchmarks are a good diagnostic tool. We can precisely quantify the effects of load/store vectorization on poor memory disambiguation. It allows us to experimentally reveal the limitations of dynamic hardware memory dependences check that may lead to severe performance loss and make the code performance very dependent on the order of access in the address streams.
This section is organized as follows. Section 6.1.2 presents some related work about the problem of improving load/store queues and memory disambiguation mechanisms. Section 6.1.3 gives a description of our experimental environment. Then, section 6.1.5 shows the most important results of our experiments that highlight some problems in modern cache systems, such as memory dependence detection mechanisms and bank conflicts. We propose in section 6.1.6 an optimization method that groups the memory requests in a vectorized way. We demonstrate by our experiments that this method is effective; then we conclude.
6.1.2. Related work
Improving load/store queues and memory disambiguation mechanisms is an issue of active research for micro-architects. Chrysos and Emer in [CHR 98] proposed store sets as a hardware solution for increasing the accuracy of memory dependence prediction. Their experiments were conclusive, demonstrating that they can nearly achieve the peak performance with the context of large instruction windows. Park et al. [PAR 03] proposed an improved design of load/store queues that scale better, i.e. they have improved the design complexity of memory disambiguation. A speculative technique for memory dependence prediction has been proposed by Yoaz et al. [YOA 99]: the hardware tries to predict colliding loads, relying on the fact that such loads tend to repeat their delinquent behavior. Another speculative technique devoted to superscalar processors was presented by Onder [OND 02]. The author presented a hardware mechanism that classifies the loads and stores to an appropriate speculative level for memory dependence prediction.
All the above sophisticated techniques are hardware solutions. In the domain of scientific computing, the codes are often regular, making it possible to achieve effective compile time optimizations. Thus, we do not require such dynamic techniques. In this section, we show that a simple load/store vectorization is useful (in the context of scientific loops) for solving the same problems tackled in [CHR 98, PAR 03, YOA 99, OND 02]. Coupling our costless software optimization technique with the actual imprecise memory disambiguation mechanisms is less expensive than pure hardware methods, nonetheless giving good performance improvement.
6.1.3. Experimental environment
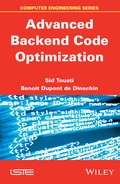
In order to analyze the interaction between the processors (typically the cache systems) with the applications, we have designed a set of micro-benchmarks. Our set of micro-benchmarks consists of simple vector loops (memory-bound) that consume large fractions of execution times in scientific numerical applications. Besides their representativity, these vector loops present two key advantages: first, they are simple and, second, they can be easily transformed since they are fully parallel loops. We divide our micro-benchmarks into two families:
Despite the fact that we have experimented other BLAS 1 codes with various number of arrays, we chose these simple ones as illustrative examples, since they clearly exhibit the pathological behavior that we are interested in.
6.1.4. Experimentation methodology
The performance of our micro-benchmarks is sensitive to several parameters that we explore. In this study, we focus on two major parameters:
1) Memory array offsets: the impact of each exact starting virtual memory address of each array2 is analyzed. This is because varying such offsets changes the accessed addresses of the vector elements, and thus it has an impact on load/store queues behavior. This is because we know that the memory address of the double floating point (FP) element X(i) is Offset(X) + i × sizeof (type X), where type X is floating point (FP) in our case (8 bytes per element in our experiments).
2) Data location: since we are interested in exploring the cache performance (L1, L2 and L3), we parameterize our micro-benchmarks in order to lock all our arrays in the desired memory hierarchy level. By choosing adequate vector lengths, and by using dummy loops that flush the data from the non-desired cache levels, we guarantee that our array elements are located exactly in the experimented cache level (checked by hardware performance counters).
Some other parameters, such as prefetch distances and modes, have also been carefully analyzed (see [JAL 06]). However, in order to be synthetic, we restrict ourselves in this chapter to the two parameters described above. Prefetch distances and modes are fixed to those that produce the best performances. Note that in all our experiments, the number of TLB misses is extremely negligible.
After presenting the experimental environment, the next section studies the performance of the cache systems in some target processors.
6.1.5. Precise experimental study of memory hierarchy performance
This section presents a summary of our experimental results on three micro-processors given as examples: Alpha 21264, Power 4 and Itanium 2. Alpha 21264 and Power 4 are two representative out-of-order superscalar processors, while Itanium 2 represents an in-order processor (an interesting combination between superscalar and VLIW).
In all our experiments, we focused on the performance of our micro-benchmarks expressed in terms of number of clock cycles (execution time), reported by the hardware performance counters available in each processor. Our measurements are normalized as follows:
One of the major points of focus is the impact of array offsets on the performance. Since most of our micro-benchmarks access only two arrays (except vsum that accesses three arrays), we explore the combination of two dimensions of offsets (offset X versus offset Y). Therefore, 2D plots (ISO-surface) are used. A geographical color code is used: light colors correspond to the best performance (lowest number of cycles) while dark colors correspond to the worst performance.
In the following sections, we detail the most important and representative experiments that allow us to make a clear analysis of each hardware platform.
6.1.5.1. Example with Alpha 21264 processor (superscalar)
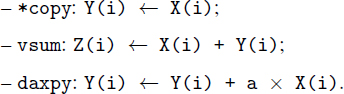
Figure 6.1(a) plots the performance of the LxSy micro-benchmark. As it can be seen, depending on the array offsets, the performance may be dramatically degraded (the worst case is 28 cycles instead of 1.3). Two clear diagonal zones appear. The main diagonal corresponds to the effects of the interactions between a stream of a load followed by a store, both accessing two distinct memory locations (Load X[i] followed by Store Y[i]). However, the hardware assumes that these memory operations are dependent because they have the same k address lower-bits (the hardware does not carry out a complete address comparison). This diagonal is periodic (not reported in this figure) and arises when the offset of X (respectively Y) is a multiple of 32 KB, which means that k = 15 bits. The magnitude of performance degradation depends on the frequency of the false memory collisions, and the distance between them: the nearer the issue time of two false colliding memory addresses, the higher the penalty. The second diagonal (upper-left) of Figure 6.1(a) corresponds to the effects of interactions between the prefetch instructions of X elements and the stores of Y elements. The periodicity of this diagonal is also 32 KB.
These performance penalties occur for all BLAS 1 micro-benchmarks. This is due to the compiler optimization strategy. Indeed, the Compaq compiler (version 6.3) generates a well-optimized code (loop unrolling with fine-grain acyclic scheduling) but keeps the same order of memory access as described by the C program (Load X[i] followed by Store Y[i]). This code generation allowed to reach peak performances only with ideal combination of array offsets, which is not controlled by the compiler.
Figure 6.1. Example of Alpha 21264 processor
6.1.5.2. Example with Power 4 processor (superscalar)
For this processor, we show the performance of some BLAS 1 micro-benchmarks because the other micro-benchmarks showed similar behaviors. The IBM compiler (version 5.02) also generates a well-optimized code. The loops were unrolled and optimized at the fine-grain level, but they perform the same order of the memory accesses as described by the source program (Load X[i] followed by Store Y[i] for copy micro-benchmark, and Load X[i], Load Y[i] followed by Store Z[i] for vsum). Prefetch instructions are not inserted by the compiler, since data prefetching is automatically done by hardware.
Figure 6.2(a) shows the performance of vsum code when the operands are located in L3. This figure is more complex:
In all cases, the bad vertical and diagonal zones appear periodically every 4 KB offset. It confirms that the processor performs partial address comparison on 12 low-order bits.
Figure 6.2. Example of Power 4 processor

6.1.5.3. Example with Itanium 2 processor (EPIC/IA64)
Contrary to the two previous processors, Itanium 2 is in-order. The ILP is expressed by the program using instruction groups and bundles. Thus, analyzing the behavior of the memory operations is little easier. In this section, we show that the banking architecture of the distinct cache levels and the memory disambiguation mechanisms may cause deep performance degradation.
While the memory stress micro-benchmarks are coded at assembly level, we used the Intel compiler (version 7.0) to generate optimized codes for our BLAS 1 loops. Software pipelining, loop unrolling and data prefetching are used to enhance the fine-grain parallelism. The experiments are performed when data are located in L2 and L3, since on Itanium 2, L1 cannot contain FP operands (this is a design choice of the Itanium family architecture).
First, let us examine the impact of L2 banking architecture. Figure 6.3(a) plots the performance of the LxLy micro-benchmark (two streams of independent loads). The best execution time is 0.6 clock cycle, which is the optimal one. However, some regions exhibit performance loss, depending on the array offsets. Basically, two types of phenomena can be observed:
Both phenomena can be easily attributed to bank conflicts resulting from the interactions between the L2 interleaving scheme and the address streams.
Figure 6.3. Cache behavior of Itanium 2 processor

All the performance bugs observed in L2 still exist in L3 level. Figure 6.3(b) shows the performance of the copy micro-benchmark. The memory disambiguation problem is more visible (wider diagonal stripes) because of the interaction between independent loads and stores. Another problem is highlighted by the upper-left diagonal zone, which is in fact due to the interferences between prefetch instructions (that behave as loads) and the store instructions.
6.1.5.4. Summary of the experiments on cache behavior
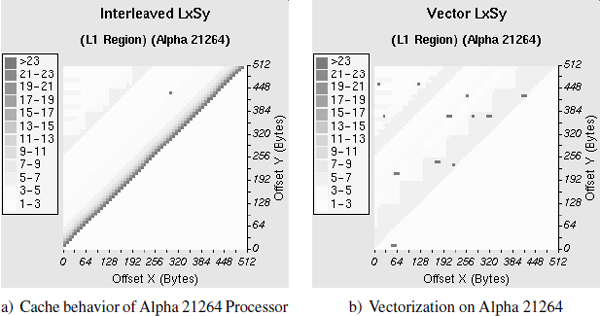
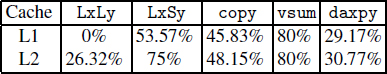
This section presented the behavior of the cache systems in Alpha 21264, Power 4 and Itanium 2 processors. We showed that the effectiveness of an enhanced instruction scheduling is not sufficient to sustain the best performance even in very simple codes, when we expect a maximal ILP extraction. We demonstrated that memory disambiguation mechanisms cause deep performance loss depending on array offsets. Bank conflicts in Itanium 2 are also an important source of performance troubles. Table 6.1 recapitulates the performance degradation factors caused by these micro-architectural restrictions, counted as the ratio between the best and worst performances.
We can use many code optimization techniques to reduce the performance penalties previously exposed (for instance, array padding, array copying and code vectorization). In the next section, we investigate the impact of load/store vectorization.
Table 6.1. Examples of measured performance degradation factors
6.1.6. The effectiveness of load/store vectorization
The performance degradation depicted in the last section arises when a program performs parallel memory accesses to distinct arrays. Theoretically, if the processor has enough functional units (FUs), and if the different caches have enough ports, such memory operations can be executed in parallel. Unfortunately, for micro-architectural implementation reasons (design complexity), memory disambiguation mechanisms in actual ILP processors do not perform complete comparisons on address bits. Furthermore, some caches, such as those implemented on Itanium 2, contain several banks and do not allow sustaining full access bandwidth. Thus, parallel memory operations are serialized during execution, even if enough FUs and ILP exist, and even if data are located in low cache levels.
Let us think about ways to avoid the dynamic conflicts between memory operations. One of the ways to reduce these troubles is load/store vectorization. This is not a novel technique indeed, and we do not aim to bring a new one; we only want to show that the classical vectorization is a simple and yet robust solution to a difficult problem. Our load/store vectorization schedules memory access operations not only according to data dependences and resources constraints, but we must also take into account the accessed address streams (even if independent). Since we do not know the exact array offsets at compile time, we cannot precisely determine all memory locations (virtual memory addresses) that are accessed by the source code. However, we can rely on their relative address locations as defined by the arrays. For instance, we can determine at compile time the relative address between X(i) and X(i+1), but not between X(i) and Y(i) since array offsets are determined at linking time in the case of static arrays, or at execute time in the case of dynamically allocated arrays. Thus, we are sure at compile time that the different addresses of the elements X(i), X(i+1), …, X(i+k) do not share the same lower-order bits. This fact makes us group memory operations accessing the same vector since we know their relative addresses. Such memory access grouping is similar to vectorization, except that only loads and stores are vectorized. The other operations, such as the FP ones, are not vectorized, and hence they are kept free to be scheduled at the fine-grain level to enhance the performance.
Vectorization may be a complex code transformation, and many studies have been performed on this scope. In our framework, the problem is simplified since we tackle fully parallel innermost loops. We only seek a convenient vectorization degree. Ideally, the higher this degree, the higher the performance, but the higher the register pressure too. Thus, we are constrained by the number of available registers. We showed in [JAL 06] how we can modify the register allocation step by combining load/store vectorization at the data dependence graph (DDG) level without hurting ILP extraction. This previous study [JAL 06] shows how we can seek a convenient vectorization degree which satisfies register file constraints and ILP extraction. To simplify the explanation, if a non-vectorized loop consumes r registers, then the vectorized version with degree k requires at most k × r registers. Thus, if the processor has ![]() available registers, a trivial valid vectorization degree is
available registers, a trivial valid vectorization degree is ![]() . The following sections explore the effectiveness of load/store vectorization.
. The following sections explore the effectiveness of load/store vectorization.
6.1.6.1. Example with Alpha 21264 processor
Figure 6.1(b) shows the impact of vectorization on the LxSy micro-benchmark (compare it to Figure 6.1(a)). Even if all the performance troubles do not disappear, the worst execution times in this case are less than 7 cycles instead of 28 cycles previously.
The best performance remains the same for the two versions, that is 1.3 cycles. This improvement is confirmed for all BLAS 1 micro-benchmarks and in all cache levels. Table 6.2 presents the gain of the worst performance resulted from vectorization. It is counted as the gain between the worst performance of the vectorized codes and the worst performance of the original codes. The best performance of all the microbenchmarks is not altered by vectorization.
Table 6.2. Worst-case performance gain on Alpha 21264
6.1.6.2. Example with Power 4 processor
Figure 6.2(b) shows the performance of vectorized vsum micro-benchmark when the operands are located in L3 cache level (compare it to Figure 6.2(a)). As can be seen, all the stripes of bad performance disappear. Vectorizing memory operations improves the worst performance of all our micro-benchmarks in all cache levels by reducing the number of conflicts between the memory operations. The best performance of all the micro-benchmarks is not degraded by vectorization.
6.1.6.3. Example with Itanium 2 processor
The case of the Itanium 2 processor needs more efforts since there are bank conflicts in addition to imprecise memory disambiguation. Thus, the load/store vectorization is not as naive as for out-of-order superscalar processors. In order to eliminate bank conflicts, memory access operations are packed into instruction groups that access even or odd vector elements. For instance Load X(i), Load X(i+2), Load X(i+4), … and Load X(i+1), Load X(i+3), Load X(i+5), etc. Thus, each instruction group accesses a distinct cache bank. Since each bank can contain 16 bytes of consecutive data, two consecutive double FP elements may be assigned to the same bank. This fact prohibits accessing both elements at the same clock cycle (bank conflict). This is why we grouped the accesses in an odd/even way.
Figure 6.4(a) shows the performance of the vectorized LxLy micro-benchmark (compare it to Figure 6.3(a)). As can be seen, all bank conflicts and memory disambiguation problems disappear. The sustained performance is the peak one (optimal) for any vector offsets. When stores are performed, Figure 6.4(b) shows the L3 behavior for the vectorized copy micro-benchmark (compare it to Figure 6.3(b)). The original grid patterns are smoothed.
Figure 6.4. Vectorization on Itanium 2

This improvement occurs for all our micro-benchmarks and in all cache levels. Table 6.3 shows the performance gain resulted from vectorization, counted as the gain between the worst performance of the vectorized codes and the worst performance of the original codes. Again, load/store vectorization does not alter the peak performance in all cases.
Table 6.3. Worst-case performance gain on Itanium 2
6.1.7. Conclusion on hardware memory disambiguation mechanisms
Memory-bound programs rely on advanced compilation techniques that try to keep data in the cache levels, hoping to fully utilize a maximal amount of ILP on the underlying hardware functional units. Even in ideal cases when data operands are located in cache, and when compilers generate codes that can statically be considered as good, our study demonstrates that this is not sufficient for sustaining the peak performance at execution time.
First, the memory disambiguation mechanisms in ILP processors do not perform comparisons on whole address bits. If two memory operations access two distinct memory locations but have the same lower-order bits in their addresses, the hardware detects a false dependence and triggers a serialization mechanism. Consequently, load/store queues cannot be fully utilized to reorder the independent memory operations.
Second, the banking structure of some caches prevent from sustaining entire access bandwidth. If two elements are mapped to the same cache bank, independent loads are restricted to be executed sequentially, even if enough FUs are idle. This fact is a well-known source of troubles, but backend compilers still do not take it into account, and the generated codes can be much slower than expected.
The experimental study of this section demonstrates that a simple existing compilation technique can help us to generate faster codes that can reduce the load/store queue conflicts. Consecutive accesses to the same array are grouped together since their relative addresses are known at compile time. Coupling a simple vectorization technique with other classical ILP scheduling methods is demonstrated to be effective to sustain the peak performance. Even if we do not avoid all situations of bad relative array offsets in all hardware platforms, and thus few memory disambiguation penalties persist, we showed that we still get high-performance gains in all experimented processors. Slightly modifying the code of an application is a simple software solution that deals well with an imprecise memory disambiguation mechanism. It would be less expensive than proposing a precise memory disambiguation hardware mechanism.
Load/store vectorization is not the only way that we may solve the performance bugs highlighted in this section. Array padding for instance can change the memory layout in order to produce better array offset combinations. However, array padding may require us to analyze the whole source code application. In the case of scientific libraries on which we are focusing, we cannot apply this technique since the arrays are declared outside the functions (not available at the compilation time of the library).
In the next section, we will study another aspect of memory hierarchy, which is cache misses penalties.
6.2. How to deal in practice with memory latency by software data preloading and prefetching
6.2.1. Introduction
Program transformations for reducing cache penalties are well-established techniques in high-performance computing and desktop applications. Nowadays high-performance processors offer many hardware mechanisms helping either to hide or to tolerate memory latencies: multiple cache levels, higher cache sizes and degrees of associativity, memory banking and interleaving, non-blocking caches and out-of-order execution, etc. All these hardware mechanisms combined with program transformations at the loop nest level produce speedups in general.
In addition to a better harmony between hardware and software, cache optimization has been also introduced at the operating system (OS) level. Due to multitasking combined with multi-core architectures, we can now envisage methods where an independent parallel thread or OS service can prefetch application data. The OS can also detect some situations when dynamic recompilation during execution is necessary to generate better codes regarding cache miss penalties.
Consequently, nowadays cache optimization strategies for high-performance and desktop applications require increasingly conjunction between multiple complex techniques at various levels: application (loop nest, regions or control-flow graphs), OS and hardware (processor and memory).
The case of embedded applications is quite different. First, an embedded VLIW processor is at least hundred times cheaper than a high-performance processor: few hardware mechanisms for cache optimization exist (if any); the computation power is also reduced, there is little margin for tolerating code optimization based on aggressive speculation. Second, some embedded systems execute with a light OS, or even at bare mode (without any OS): no dynamic services or tasks can be used in parallel to improve cache effects. Third, embedded applications are rarely statically controlled programs with regular control or regular data accesses: such applications cannot meet the model requirements for loop transformations [ALL 02] and for usual software prefetching with regular strides. Finally, code size growth is an additional constraint to deal with.
In this section, we present a method to reduce processor stalls due to cache misses in presence of non-blocking cache architectures. We implement our method at the backend level where loop structures disappear. Our principal aim is not to reduce cache misses (as usually done with loop transformations) but to reduce the processor stalls due to them. It is a combination of software data prefetching (inserting special prefetch instructions) and preloading (increasing static load latencies). As we will explain later, it is especially designed for VLIW in-order processor that would include non-blocking caches instead of blocking caches.
6.2.2. Related work
Improving the cache effects at instruction level is an already a studied topic. We can classify related work following two directions: a theoretical direction, where some studies were done on instruction-level scheduling taking into account the cache constraints. The second direction is more practical. As a theoretical work, we quote the contribution published in [TOU 01]. It is the first intLP model that included the impact of the compulsory misses in an optimal acyclic scheduling problem in a single basic block. We model the exact scheduling problem by including the constraint of data dependences, functional units, registers and compulsory misses. Our current section will present a practical study, we try to cover all kinds of cache misses (compulsory, capacity and conflict). Also, we do not restrict ourselves to a single directed acyclic graph (DAG) (basic block) only, we are interested in optimizing a function as a whole.
Here, we are interested in practical ways that handle reducing cache miss penalties with two techniques: prefetch and instruction scheduling techniques. Using the prefetch solution, Al-Sukhni et al. [ALS 06] classified the load operations as intrinsic and extrinsic streams and developed a prefetch algorithm based on automaton taking into account the density and the affinity of these streams. The experiments were done on a simulator of a superscalar out-of-order processor: out-of-order execution helps us to hide cache miss penalties at execution time, in opposition to our case that is an in-order VLIW processor. Abraham et al. [ABR 93] proposed a prefetch technique. They described their technique by automaton: the first step of this automaton is profiling of load instructions, and the second step is the selection phase of loads that miss the cache. The final state is the prefetching of these delinquent loads. Another prefetch solution is dynamic prefetching as proposed by Beyler et al. [BEY 07]. They studied a dynamic prefetch mechanism using the load latency variation to classify the loads. The framework is based on finite state machine. They obtained positive results on the Itanium processor where the Intel compiler (icc) automatically generates prefetch instructions. Regarding dynamic prefetching, we always quote Lu et al. [LU 03] who developed a framework called ADORE. The authors proceed through three steps: tracking delinquent loads, selecting the data references and finally prefetching these loads. This solution is based on hardware monitor of the Itanium processor. The two previous works [BEY 07] and [LU 03] were done on Itanium architecture, which is used for high-performance computing. This section will present a technique done on a light embedded VLIW processor which generally executes a single task; so, the dynamic prefetch mechanism is an inappropriate solution for a target VLIW architecture.
We target two cache architectures: a blocking cache architecture and a non-blocking cache architecture. In the case of blocking cache architectures, only the prefetch method will be used (preloading is useless in this case). If non-blocking cache is present, prefetching is combined with preloading (as will be explained later). This latter case is more interesting because some VLIW processors include non-blocking caches. Blocking cache architecture and optimizations have been covered in many studies. Tien et al. [CHE 92] studied the effects of pipelined loads and prefetch in MIPS3000 single issue processor, and tried some compiler optimizations such as changing static load latencies to exploit the pipelined execution of loads. In our case, we study the cache effects for a VLIW (multiple issue) processor.
For anon-blocking cache architecture, Oner et al. [ÖNE 93] made a study of kernel scheduling on an MIPS processor. The authors increased the load-use dependency distance in loop kernel using loop pipelining. In addition to loop kernels, our method is applied to basics blocks, functions and whole applications. In other words, we have no code granularity restrictions.
Ding et al. [DIN 97d] based their work on data reuse information, i.e. they made a first step static analysis to collect load statistics of selected kernels. Then, they used the collected statistics to combine data prefetching and instruction scheduling techniques to hide cache effects. Contrary to the work of Ding et al., we do not restrict ourselves to loops and we do not use a virtual superscalar machine. Our target architecture is a real VLIW processor in the market (used in many real-world embedded systems).
The authors in [FAR 94] did a performance evaluation to study the hardware complexity of non-blocking cache architecture using SPEC92 benchmarks. They showed that a simple hit-under-miss non-blocking cache implementation (i.e. only two overlapped loads at the same time) is a good trade-off between hardware cost and performance. However, the work done by Ammenouche et al. [AMM 08] showed that non-blocking caches do not provide any performance improvement in the case of embedded VLIW processors because execution is in order and no dynamic instruction scheduling is done to hide cache miss penalties as in the case of superscalar processors. However, Ammenouche et al. showed [AMM 08] on two applications that non-blocking caches may provide good performance improvement if low-level code optimization based on preloading is used. Our current study extends the previous work by adding a prefetch method and making a more complete experimental study using MEDIABENCH and SPEC2000 benchmarks.
To clearly explain the position of the technique presented in this section, we say that our study aims to improve (at the software level) the efficiency of the non-blocking cache architecture on VLIW processors. We combine data prefetching and preloading in conjunction with a global instruction scheduler that handles an entire function. Such a global instruction scheduler does not necessarily target regular codes, such as loop nests. As we will explain later, our technical framework is based on profiling and trace analysis. The next section starts by explaining the problem of cache effects at the instruction level.
6.2.3. Problems of optimizing cache effects at the instruction level
Nowadays, cache memory is widely used in high-performance computing. It is generally organized in a hierarchical way making a trade-off between hardware cost and code performance. The drawback of this memory architecture is the unpredictability of the data location. Indeed, at any time during the program execution, we are uncertain about the data location: data may be located in any cache level, or in the main memory or in other buffers. This situation can be acceptable in high-performance architectures, but cannot be appreciated in embedded soft real-time systems because data access latencies are unpredictable. We focus our attention on embedded systems, especially those using VLIW processors. In this case, instruction scheduling is one of the most important sources of improving code performance. A static instruction scheduling method considering a cache model would be ideal for hiding/tolerating the unpredictability of execution times. Nowadays, general purpose compilers like gcc, icc and the st200cc do not manage cache effects: memory access latencies are considered fixed during compilation because the latencies of the load instructions are unknown at compile time. Many instruction scheduling techniques are developed and have been commented upon in the literature, but they always suppose well-defined latencies for all kinds of instructions. The fact is that the proposed models are simplified because of our lack of knowledge about data location and thus about load latencies.
Loop scheduling is a good example to assert our idea: software pipelining is a well-matured scheduling technique for innermost loops. Its aim is usually to minimize the Initiation Interval (II) and the prologue/epilogue length. The compiler assumes that the total execution time of the pipelined loop is the sum of the prologue and epilogue length and the kernel (II) multiplied by the number of iterations. Since almost all scheduling techniques assume fixed instructions latencies, the compiler has an artificial performance model for code optimization. Furthermore, the compilers quoted above schedule the load instructions with optimistic latencies, since they assume that all data reside in lower cache levels, and they schedule the consumer of the loaded data close to the load operation. Consequently, the instruction schedulers of compilers have optimistic view of the performance of their fine-grain scheduling. The case of the st200cc is relevant; this compiler schedules the consumers of a load only 3 cycles after the load (3 corresponds to the L1 cache hit latency, while a cache miss costs 143 clock cycles). If a load misses the L1 cache, the processor stalls for at least of 140 cycles, since a VLIW processor has no out-of-order mechanism. The icc compiler for Itanium also has the same behavior and schedules all loads with a fixed latency (7 cycles), a latency between the L2 (5 cycles) and L3 (13 cycles) levels of cache.
Another problem of instruction scheduling taking into account cache effects is the difficulty to precisely predict cache misses in the frontend of the compiler. While some cache optimization techniques are applied on some special loop constructs, it is hard for the compiler frontend to determine the cache influence on fine-grain scheduling and vice versa. Sometimes, this fact makes compiler designers implement cache optimization techniques in the backend, where the underlying target micro-architecture is precisely known (cache size, cache latencies, memory hierarchy, cache configuration and other available buffers). However, in the compiler backend, the high-level program is already transformed to a low-level intermediate representation and high-level constructs such as loops and arrays disappear. Consequently, loop nest transformations can no longer be applied to reduce the number of cache misses. Our question becomes how to hide the cache miss effects rather than how to avoid the cache misses.
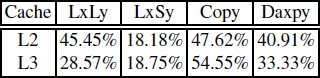
Another important criterion for applying cache optimizations at different levels is the regularity of the program. At compilation, regularity can be seen on two orthogonal axes: regularity of control and regularity of data access (see Table 6.4, for example). Due to the orthogonality of these two axes, four scenarios are possible:
Note that while data prefetching usually requires some regularity in data access, preloading can always be applied at the instruction level.
Table 6.4. Examples of code and data regularity/irregularity

The next section recalls the underlying architecture that we target in this study.
6.2.4. Target processor description
In the study used in this section, we use the ST231 core which is a VLIW processor from STmicroelectronics. These VLIW processors implement a single cluster derivative of the Lx architecture [FAR 00]. ST231 is an integer 32-bit VLIW processor with five stages in the pipeline. It contains four integer units, two multiplication units and one load/store unit. It has a 64 KB L1 cache. The latency of the L1 cache is 3 cycles. The data cache is a four-way associative. It operates with a write-back no-allocate policy. A 128-byte write buffer is associated with the Dcache. It also includes a separated 128-byte prefetch buffer that can store up to eight cache lines. As for many embedded processors, the power consumption should be low, hence limiting the amount of additional hardware mechanisms devoted to program acceleration. In addition, the price of this processor is very cheap compared to high-performance processors: a typical high-performance processor is more than one hundred times more expensive than the ST231.
Regarding the memory cache architecture, ST231 includes a blocking cache architecture. In [CHE 92], the non-blocking cache is presented as a possible solution for performance improvement in out-of-order (OoO) processors. So, several high-performance OoO processors use this cache architecture. The interesting aspect of this cache architectures is the ability to overlap the execution and the long memory data access (loads). Due to the non-blocking cache, when a cache miss occurs, the processor continues the execution of independent operations. This produces an overlap between bringing up the data from memory and the execution of independent instructions. However, the current embedded processors do not yet include this kind of memory cache because the ratio between its cost (in terms of energy consumption and price) and its benefit in terms of performance improvement was not demonstrated till our results published in [AMM 08]. Furthermore, in order to efficiently exploit the non-blocking cache mechanism, the main memory must be fully pipelined and multiported while these architectural enhancements are not necessary in case of blocking cache. Kroft [KRO 81] proposed a scheme with special registers called Miss Information Status Hold Registers (MSHRs), also called pending load queue. MSHRs are used to hold the information about the outstanding misses. He defines the notion of primary and secondary miss. The primary miss is the first pending miss requesting a cache line. All other pending loads requesting the same cache line are secondary misses – these can be seen as cache hits in a blocking cache architecture. The number of MSHR (pending load queue size) is the upper limit of the outstanding misses that can be overlapped in the pipeline. If a processor has n MSHRS, then the non-blocking cache can service n concurrent overlapped loads. When a cache miss occurs, the set of MSHRs is checked to detect whether there is a pending miss to the same cache line. If there is no pending miss to the same cache line, the current miss is set as a primary miss; if there is an available free MSHR, the targeted register is stored. If there is no available free MSHR, the processor stalls.
The next section shows a practical demonstration that optimizing cache effects at instruction level brings good performances.
6.2.5. Our method of instruction-level code optimization
Our method aims to hide the cache penalties (processor stalls) due to cache misses. We want to maximize the overlap between the stalls due to Dcache misses with the processor execution. For this purpose, we focus on delinquent loads, whether they occur in loops or in other parts of the code. We do not limit our method to a certain shape of code, we consider both regular and irregular control flow and data streams. We study two techniques, each of them corresponding to a certain case:
It is well known that combining many optimization techniques does not necessarily yield better performances. This may lead to a hard phase ordering problem. Our methodology shows how to solve this problem for the two combined optimizations. Since these two techniques are complementary, we can also combine them in the same compiler optimization pass. Let us explain in detail the usage of these two techniques, which are data prefetching and data preloading.
6.2.5.1. Data prefetching method at instruction level
The cache penalty is very expensive in terms of clock cycles (more than 140 cycles in the case of the ST231). The current hardware mechanisms fail to fully hide such long penalties. In the case of a superscalar processor, the OoO mechanism can partially hide the cache effects during few cycles (up to the size of a window of instructions in the pipeline). Rescheduling the instructions, with a software (compilation) method or hardware technique (execution), cannot totally hide a cache penalty.
The data prefetching technique is an efficient way to hide the cache penalty. However, the usual prefetching methods work well for regular data accesses that are analyzed at the source code level. In many embedded applications, data accesses do not appear to have regular strides when analyzed by the compiler because of indirect access, for instance. Furthermore, the memory accesses are not always performed inside a static control loop. Consequently, the usual prefetching techniques fail. In the method we are presenting, we analyze the regularity of a stride due to a precise instruction-level profiling.
Our data prefetching is based on predicting the addresses of the next memory access. If the prediction is correct the memory access will be costless. In the case of bad prediction, the penalty is low (ST231 includes a prefetch buffer, so the bad prefetched data does not pollute the cache). The only possible penalty consists of adding extra instructions in the code (code size growth) and executing them. However, in case of VLIW processors, we can take care of inserting these extra instructions inside free slots because not all the bundles contain memory operations. Consequently, no extra cost is added, neither in terms of code size nor in terms of executions. So, the most important aspect of this technique is the memory address predictor, or the generation of a code that computes the address of the next prefetched data.
Our method of prefetching requires us to perform three phases before generating an optimized code: profiling the code to generate a trace, then selecting some delinquents loads and finally inserting the prefetch instructions.
Phase 1: application profiling at instruction level – this step is the most expensive in terms of processing time, because we have to perform a precise instruction level profiling of the code by generating a trace. Classical profiling, as done with the gprof tool for instance, operates at medium coarse grain level (functions). In our case, we proceed in the finest profiling granularity, that is at the instruction level. To do this, we use a special software plug-in device, which can manage the execution events and statistics. This plug-in is an interface with the ST231 simulator, which is completely programmable. We use the plug-in to select all the loads which miss the cache, and for each load, collect its accessed addresses inside a trace. This trace highlights the delinquent loads. A load is said to be delinquent if it produces a large number of cache misses. In practice, we sort the loads according to the number of cache misses they produce, and we define the top ones as delinquents. The result of this profiling phase is a precise cartography of the accessed memory data addresses, tagged with the delinquent loads.
The next phase is to select the right loads to prefetch within the set of delinquent loads.
Phase 2: load selection – selecting which delinquent loads to prefetch depends on two parameters: the number of cache misses and the regularity of memory accesses. The most important criterion is the number of cache misses induced by a load. Indeed, in order to maximize the prefetch benefit, it is important to prefetch loads with a high frequency of cache misses. Choosing loads that produce many cache misses allows us to hide the cost of extra prefetch instructions, since prefetch instructions may introduce some additional bundles in the original code. Increasing the code size or changing the code shape may produce very undesirable effects and may slow down the performance because of the direct mapped structure of instruction cache. Consequently, for a given identified delinquent load, the higher the number of cache misses it produces, the better the performance can be achieved. We do not care about the ratio of hit/miss of the delinquent load; we only measure the frequency of cache misses and sort the loads according to this value.
Once a delinquent load is selected as a good candidate for prefetching, we should analyze the second parameter, which is the memory access regularity. Wu in [WU 02] classified the load with the next data stride patterns:
On the basis of this simple classification, only strong single stride and some phased multistride are selected by our method. An example of strong single stride is shown in Figure 6.5(a). In this figure, we can observe a unique stride of a single delinquent load instruction from jpeg benchmark. In this figure, the x-axis corresponds to the numerous load instances of a unique selected delinquent load instruction (a load instance is a dynamic execution of a static load instruction), the y-axis is the stride between the addresses of consecutive data accesses. We recall that these regular strides do not appear when analyzing the source code at compilation time, but they appear with application profiling at the instruction level.
Figure 6.5. Stride pattern classification

Figure 6.5(b) corresponds to the phased multiple stride of delinquent load instruction from 181.mcf benchmark (SPEC2000 benchmark suite). Here we can clearly observe two regular strides.
In Figure 6.5(c), we observe fully irregular strides for a single load, this kind of load is not prefetched, but can be preloaded, as we will explain later.
Once we select delinquent loads with strong single stride or with phased multistride, we can proceed to the last step of prefetch instruction insertion.
Phase 3: prefetch instruction insertion – this step consists of adding a single or many prefetch instructions in the code. The syntax of a load instruction on the ST231 is: LD Rx= immediate[Ry]. The first argument of the instruction is Rx, the destination register, while the second argument is the memory address defined as the content of the index register Ry plus an immediate offset. The prefetch instruction has the same syntax pft immediate [Ry] except that it does not require a destination register. Executing a prefetch instruction brings data to the prefetch buffer (not to the cache) and does not induce any data dependence on a register. However, we should take care not to add an extra cost of the added prefetch instruction. In order to achieve this purpose, the prefetch instruction should be inserted inside a free issue slot inside a VLIW (each bundle may contain up to one memory access instruction). If no free slot is available, we could insert a new bundle but with the risk of increasing the code size and altering the execution time (making the critical path longer in a loop, disturb the instruction cache behavior, etc.).
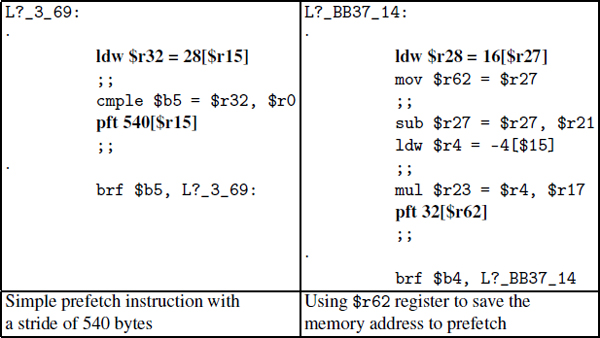
Now, let us give more details on the inserted prefetch instruction. If the delinquent load has this form LD Rx = immediate[Ry] and has a single stride s, then we insert a prefetch instruction of the form pft s[Ry]. If the delinquent load has multiple strides s1, s2, …, then we insert a prefetch instruction for each stride. However, our experiments indicate that it is not efficient to prefetch more than two distinct strides. The left column of Table 6.5 shows an example of prefetching with a data stride equal to 540 bytes. The bundle following the load includes the prefetch instruction: it prefetches the data for the next instance of the load.
Now, if the used index register Ry is altered/modified by the code after the delinquent load, this index register cannot be used as a base address for the prefetch instruction. We provide two solutions:
The right column of Table 6.5 shows an example. Here, the base register $r27 is changed in the bundle after the load. The register $r27 is saved on a free register, say $r62. Then the prefetch instruction is inserted in a free VLIW slot.
Table 6.5. Examples of prefetch: simple case and using extra register case
As mentioned before, the prefetch technique is an efficient low-level code optimization that reduces the frequency of cache misses. Its main weakness is the difficulty in making an efficient address predictor. It is especially hard to predict the right addresses to prefetch in irregular data accesses. For this case, the prefetch technique cannot be applied. Thus, we propose in the next section the preloading technique that can be applied for the case of irregular data access.
6.2.5.2. Data preloading method
The preloading technique is used if the processor includes a non-blocking cache. We have already published experiments in [AMM 08] to check the efficiency of nonblocking cache architectures on in-order processors (such as VLIW). Our results can be summarized in four points:
In high-performance OoO processors, replacing a blocking cache with a nonblocking cache provides speedup even if the binary code is not optimized. In the case of VLIW in-order processors, the benefit of non-blocking caches is close to zero if the code is not modified. In order to understand this fact, we need to introduce the two following definitions:
In [AMM 08], we showed that the static load-use distance in the set of experimented benchmarks is short, about 3 bundles, i.e. the st200cc compiler has an optimistic compilation strategy regarding load latencies. It assumes that all data are in the L1 cache. The VLIW compiler schedules the consumer of data too close to its producer (load) in order to keep the register pressure low. In the case of an in-order processor with non-blocking cache architecture, it would be ideal if the compiler could generate codes with longer load-use distance. The problem is computing the right latency for each load i.e. considering the delinquent loads with higher latencies during instruction scheduling. This instruction scheduling method is called preloading. Of course, the purpose of preloading is not to increase the static load latencies of all load operations, otherwise this would increase the register pressure. Our preloading strategy selects a subset of delinquent loads as candidates. We proceed in two phases explained below.
The first phase of our preloading technique is the same used for the prefetching, i. e. we start with a precise profiling phase at instruction level. This profiling allows us to detect delinquent loads as well as the code fragment to which they belong (function or loop).
The second phase of our preloading technique defines the right load-use distance to each load. This is a major difficulty in practice: a compile time prediction of the probability of cache misses and hits is difficult (if not impossible) at the compiler backend level. This is why the first phase of fine-grain profiling provides useful information. Depending on ratio of hit/miss for each load, we compute a certain probability of dynamic load latencies that we set at compile time. For instance, if a load misses the cache 30% of the times (143 cycles of latency) and hits 70% of the time (3 cycles of latency), then its static latency is set to 0.3 × 143 + 0.7 × 3 = 45. If the register pressure becomes very high because of this long static latency, the compiler cannot extract enough ILP to hide this latency, then we reduce the latency to avoid inserting spill code. Our preloading method iterates on different values of static load latencies until reaching a reasonable performance gain estimated at compile time. For the case of embedded systems, the compilation time is allowed to last during such iterative processes.
Due to the preloading technique, we can achieve a very good performance increase. However, we must be aware of the following points:
The preloading technique is efficient and practical because it can be applied to irregular codes with or without irregular data strides. It can also be applied in combination with other high- or low-level code optimization techniques. An ad hoc algorithm in [AMM 09] details our whole methodology of data prefetching and preloading.
6.2.6. Experimental results
Appendix 6 summarizes our experimental results. Playing with the micro-architectural effects of caches at the instruction level is a complex task, especially for real applications such as FFMPEG, SPEC2000 and MEDIABENCH. Our method of data prefetching selects one or two delinquent loads per application that access a regular data stream that is not possible to analyze statically. Then, we insert one or two prefetch instructions into a VLIW bundle for bringing data before time to prefetch buffer or to cache. This simple method is efficient in the case of blocking and non-blocking caches, where we can get a whole application performance gain up to 9%. The code size does not increase in this situation.
Our method of preloading consists of increasing the static load distance inside a selected loop or a function. This method allows the instruction scheduler to extract more ILP in order to be exploited in the presence of a non-blocking cache. With preloading, we can get a minor code size growth (up to 3.9%) with an application performance gain up to 28.28% (FFMPEG). The advantage of preloading against prefetching is the fact that it is not restricted to regular data streams. When we combine data prefetching with preloading in the presence of a non-blocking cache, we get a better overall performance gain (up to 13% in jpeg) compared to optimized codes with -O3 compilation level. These performances are satisfactory in our case since they are evaluated on the whole application execution time and not on code fractions.
In order to demonstrate that preloading can also be combined with high-level loop nest restructuring methods improving data locality (tiling and blocking), we studied the case of a square matrix-matrix multiply (512 × 512 integer elements). We used a non-naive implementation, using loop tiling. We tuned the tile size manually to get the fastest code compiled with -O3 flag: we found that a block of 64 × 64 integer elements provides the best performance. When we combined preloading with this best code version, we obtained an additional speedup of 2.6.
6.2.7. Conclusion on prefetching and preloading at instruction level
We present an assembly-level code optimization method for reducing cache miss penalties. We target embedded VLIW codes executing on an embedded processor with non-blocking cache architecture. For experimental purpose, we used an embedded system based on a VLIW ST231 core. Contrary to high-performance or computationally intensive programs, the embedded applications that we target do not have regular data access or control flow, and the underlying hardware is cheap and simple. Our code optimization method is based on a combination of data prefetching and preloading.
The results of our study clearly show that the presence of non-blocking caches inside VLIW processors is a viable architectural improvement if the compiler applies some low-level code optimizations. Otherwise, introducing a non-blocking cache inside a VLIW does not produce performance improvement.
We have already defined a formal scheduling problem using integer linear programming that combines compulsory cache effects with fine-grain instruction scheduling [TOU 01]. However, we think that our theoretical model does not exactly define the practical problem because reducing the cost of compulsory cache misses would not be sufficient to observe performance gains. This section showed two techniques that produce real speedups but they are inherently ad hoc, because they need to be adapted to the micro-architecture. Our low-level study allows us to understand the phenomena that connect between ILP and cache misses. The performance improvement that we obtained makes us think that defining a good theoretical scheduling problem is possible in the future. We mean a scheduling problem that combines the classical instruction scheduling constraints (registers, functional units, VLIW bundling and data dependences) and cache effects (cache misses and memory disambiguation mechanisms).
1 In this context, the peak performances refer to the ideal ones, that is the maximal theoretical performances as defined by the hardware specification.
2 It is the address of the first array element that we simply call the array offset. The address zero is the beginning of a memory page.