A New Strong and Fast Emerging Market
Overview
Until recently, the best notorious work of Goldman Sach’s economist Jim O’Neil was probably the development of the BRIC* acronym. Now, however, the new grouping of Colombia, Indonesia, Vietnam, Egypt, Turkey, and South Africa countries, dubbed CIVETS also is becoming well known. Although it is not certain who created the acronym –some assert HSBC’s chief executive Michael Geoghegan while others claim the Economist Intelligence Unit – all parties believe this new bloc is becoming the next big strategy for growth, foreign investments, and global policy influence.
The authors believe the future of robust global growth and development are being concentrated in the emerging markets. These emerging economies don’t have the debt problems with which advanced economies are dealing. We also believe most of the world’s consumption will continue to grow with emphasis on emerging market as the merging middle class demands also continue to grow.
While advanced economies, including the UK, those in Europe and North America are deemed to be in a long period of stagnation, much like the BRICS and MENA, the CIVETS countries are home to large youth populations and a fast-growing middle class. These new emerging economies are becoming the perfect storm for Western capital investment seeking new opportunities.
According to HSBC, in its Business Without Borders1 newsletter, while the past decade was all about the BRICS countries the next will be focused on the CIVETS. The article goes as far as suggesting that CIVETS “rising middle class, young populations and rapid growth rates make the BRICs look dull in comparison.”* In concept, we tend to agree with HSBC’s assessment of the CIVETS and BRICS. Figures 8.1 and 8.2 provide some evidences. Although we believe in the strength and positive factors surrounding the BRICS in relation to advanced economies, we also acknowledge that there is little in the way of shared interests to unite the BRICS countries. Russia and China are authoritarian states, while Brazil and India are noisy democracies. Brazil and South Africa, both big agricultural and mineral resources exporters seeking freer trade, have little in common with India, which protects its farmers with high tariff barriers. Russia, whose economy is based largely on energy exports, has little in common with China, a net oil importer. China, with over 1.3 billion people, is more than 25 times bigger than South Africa’s 50 million. But the BRICS are a model of solidarity when compared to the CIVETS.
The organization of the CIVETS into a cohesive coherent group could be analogous to herding cats; interesting enough, the word civet also is used to refer imprecisely to a number of catlike creatures of different genii and species. We also worry that some countries that should have been part of the bloc are not, such as Mexico, Myanmar, Nigeria, and Kenya.
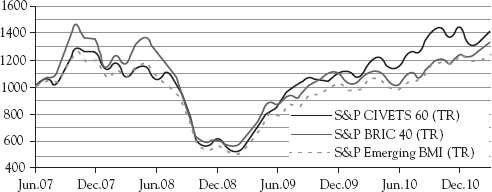

Figure 8.2 A comparison between the BRIC and the CIVETS economies
Source: WealthOpinion, Knowledge@Wharton3
For instance, Thailand, with a population of 69 million, an average age of 34, and a GDP growth forecast of more than six percent in 2012 is not part of the group. Egypt’s poor economic performance of late can be considered temporary fallout from the Arab Spring upheavals, but what about South Africa, which in the nearly 18 years since the advent of majority rule has chalked up an average annual GDP growth of 3.3 percent? If compared to South Africa, Bangladesh could have been included, as it boasts a population of 150 million with a median age of 23, and GDP growth averaging six to eight percent. Let’s not forget Nigeria, with a population of 140 million people, an average age of 19, and a GDP growth of 6.9 percent since 2005. Nonetheless, according to the HSBC, “the six countries in the group are posting growth rates higher than five percent, with the exception of Egypt and South Africa, and are trending upwards. Lacking the size and heft of the BRICs, these upstarts nevertheless offer a more dynamic population base, with the average age being 27, soaring domestic consumption and more diverse opportunities for businesses seeking international expansion.”*
Governments in advanced economies are taking notice of such positive trends and making commitments to expand their presence in those emerging markets and assist their own multinational companies to access these markets in order to hit ambitious export-led growth targets. In England, for example, the Department for Business, Innovation and Skills is offering assistance to 50,000 small and medium size enterprises (SMEs) to expand their exports into these high-growth markets by 2015.4 The government is offering financial and diplomatic levers to assist those businesses. As discussed in Chapter 7, the United States is pushing for a Pivot of Asia strategy, and in the EU, Martin Hutchinson, a noted commentator, author, and longtime international merchant banker, tells the European Business Review magazine that the next hot emerging-market economies is in fact the CIVETS, or the “new” BRICs.5
Despite the various opinions, including ours, on which countries should have been part of the CIVETS acronym, the bloc’s economies are being considered the new strong and fast growth markets in the world. Reasons for that are easily illustrated by its economic figures. As depicted in Figure 8.1, CIVETS markets have been outperforming the BRICS since 2009. Half of Turkey’s 72 million inhabitants are under the age of 28 and its economy is expected to be the second-fastest growing in the world by 2018. To date, there are more than 900 British companies already operating in Egypt, a country poised to expect a doubling of its population over the next 25 years. South Africa’s infrastructure investment programs are providing a huge opportunity to companies that can contract expertise, goods, and services into them over a generation or more. Advanced economies are benefiting from this boom by way of bolstering their own growth.
Notwithstanding historic political upheaval in Egypt over the last year, large amounts of FDI are finding its way to that country. The UK remains the country’s largest investor, with investments of about £13 billion pounds (US$20.8 billion). Egyptian’s transition government has signaled a wish to speed up economic reform along with the formation of a new democracy in order to attract more outside investment, but already high inflation alongside political uncertainty tops the agenda for the immediate future. That said, thereafter it is expected that the Egyptian economy will grow at a rate of three percent annually.
Its highly mobile, well-educated youth is an important part of Egypt’s business opportunity. But a second reason economies like those of Egypt or Turkey are appealing is that they provide a relatively hospitable back door into the emerging potential in neighboring, harder-to-access countries in the BRICS, ASEAN, and the MENA regions. We argue that these blocs are in many ways interdependent. Figure 8.2 provides a comparison between the BRICS and the CIVETS countries. Looking closely one can identify a multitude of ways in which these economies intertwine land resources and opportunities to each other, and open up nontraditional ways to many other emerging and advanced economies.
For instance, a British company, Faun Trackway, landed a contract to supply temporary helipads to the Colombian government’s anti-narcotraffic forces, which provided them a gateway into the U.S. market because those forces are bankrolled by American state budgets. In South Africa, the British Prime Minister David Cameron, backed an African Union’s idea to launch an African free trade area by 2017, which would in turn simplify and standardize trade tariffs and infrastructure among member states, allowing investors to benefit not only from the South African economy, but also many other leading economies in Africa, such as the MENA bloc.
The following is a breakdown of the CIVETS countries, their economies’ threats, opportunities, and challenges.
Colombia
Colombia is emerging as an attractive driving force in the South American region. The country boasts 44 million people and a GDP of $231 billion, which certainly positions itself for future growth. In a world in which resources prices are likely to tick upwards due to Chinese and Indian demand, Colombia’s agricultural and natural-resources orientation is in high demand globally. In addition, should the U.S. Congress ever actually ratify the U.S.-Colombia Free Trade Agreement, which was signed back in November 2006, there should be a further boost to the Colombian market.
Colombia is the oldest democracy in Latin America,6 but it has suffered several conflicts with guerrilla groups for more than 40 years, threatened its stability. This has changed dramatically, however, since the implementation of the policy seguridad democrática7 (democratic security) implemented in 2003, which has improved significantly the reputation of the country around the world. Improved security measures have led to a 90 percent decline in kidnappings and a 46 percent drop in the murder rate over the past decade, which has helped per-capita GDP double since 2002. As of 2011 and depicted in Figure 8.3, Colombia’s GDP growth has been larger than Latin America, the eurozone, and the United States, with only China surpassing it. Colombia’s sovereign debt was promoted recently to investment grade by all three ratings agencies (Fitch, S&P, and Moody’s). In addition, Colombia has substantial oil, coal, and natural gas deposits, and as of 2010, a total FDI of $6.8 billion in 2010, with the United States as its principal partner.
Colombia’s economy is slowly returning to growth, over 3.5 percent on average for the past few years. Its unemployment rate, however, is among the highest in the region. Its currency, the peso, is rising on the country’s commodities boom, and fiscal deficit remains a challenge. As of August 2010, Colombia had a budget deficit of 3.6 percent of its GDP, which according to The Daily Market,8 is still reasonable. Inflation rate in 2013 was 2.6 percent and external debt a modest 47 percent of GDP.
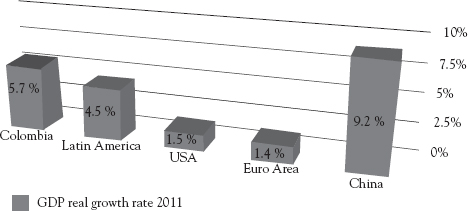
Figure 8.3 Colombia GDP growth rate
Source: IMF
There has been a surge of new policies favoring entrepreneurism and creation of businesses, which allow foreigners to integrate into this market.9 Foreign investment in Colombia has increased five-fold between 2002 and 2010,10 increasing significantly its infrastructure. The oil boom since 201011 has provided a major boost to its economic recovery, and the country is being proactive in devising strategies to avoid the Dutch disease as billions of dollars in FDI are injected in the country’s economy.
Indonesia
Indonesia is a country with 243 million people and a GDP of $521 billion. The country boasts a substantive and well-diversified economy, with agriculture, natural resources, and substantial manufacturing. The level of corruption in the government and society, however, is very high, but still lower than in Russia. The country is situated strategically between China and India, meaning it should benefit as both those behemoths grow.
After emerging as the third-fastest-growing member of the G-20 in 2009, Indonesia has continued to display strong growth performance. For the past half-decade, Indonesia’s annual GDP growth rate has averaged about six percent, the fastest in Southeast Asia, due in large part to a consumer-spending boom, which according to Moody’s, the compound credit loan growth rate in the country has been over 22 percent for the past six years, while non-mortgage consumer credit nearly tripled in the last five years. During this time, credit card use has greatly proliferated, with the number of credit cards jumping by 60 percent, while the actual value of transactions almost tripled. This prompted the Bank of Indonesia, the country’s central bank, fearing a consumer debt crisis, to limit the number of credit cards a single person is allowed to hold, while barring Indonesians who earn less than $330 dollars a month from being issued any credit cards.
In addition, the ultra-low interest rates in ailing advanced economies, combined with the United States Federal Reserve’s multi-trillion dollar QE programs, that has led to a $4 trillion tsunami of hot money* flowing into emerging market assets since 2008, and has enabled Indonesia to grow at a very fast pace, following the footsteps of China and India’s fast economic growth. (See Figure 8.4.)
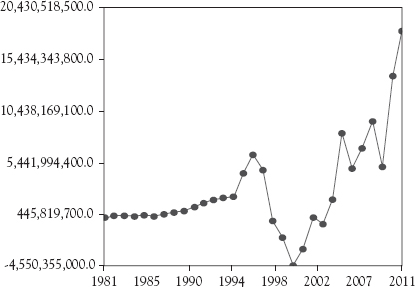
Figure 8.4 Foreign direct investment in Indonesia more than tripled since 2008
Source: IndexMundi.com
Multinational corporations from advanced economies have taken notice of Indonesia’s consumer spending boom. Automakers including Nissan, Toyota, and General Motors have committed to spend up to $2 billion to expand their manufacturing operations in the country in the next few years. Cheap financing also has been fueling a surge in motorcycle sales, which grew 13.9 percent in August 2013 from a year earlier. Retail sales that have been growing at an annual rate of 10–15 percent in recent years have attracted numerous Western consumer brands like L’Oreal, Unilever, and Nestle that are seeking to cash in on Indonesia’s consumer spending boom.12
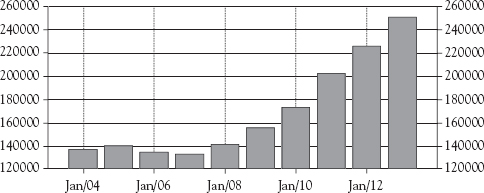
Figure 8.5 Indonesia external debt has nearly doubled since 2008
The huge inflows of hot money into the country have benefitted many foreign holders of Indonesian local currency government bonds, which rose from 14 percent to 34 percent, while the country’s external debt nearly doubled, as depicted in Figure 8.5. These massive capital inflows into Indonesia, however, have contributed to a nearly 50 percent strengthening of the rupiah currency’s exchange rate against the U.S. dollar. It also pushed the country’s ten-year government bond yields down to record lows of five percent from its 10–15 percent before the 2008 global economic crisis range. This was bad for the local economy, which experienced a major rise in inflation rates, causing the Bank of Indonesia, to cut their benchmark interest rate from 12.75 percent to just 5.75 percent to stem export-harming currency appreciation.
Infrastructure spending and high commodity prices boosted most of the investment growth in 2009, but such record low interest rates have also fueled an increasing credit and consumption boom in Indonesia, with domestic consumer spending accounting for nearly 60 percent of the country’s overall economy. In addition, the country has the lowest unit labor costs in the Asia-Pacific region, and a very ambitious government committed to attract even higher FDI into its economy, in an attempt to turn the nation into a manufacturing hub. But despite all the positive trends, corruption is still a major problem in the country.
Vietnam
Vietnam, while new to global trade, only becoming a member of the WTO in 2007, has been one of the fastest-growing economies in the world for the past 20 years, with the World Bank projecting an average of 7.2 percent, annually in 2013 and the next few years. Its membership in the ASEAN, and its proximity to China may very well lead the country to become a new potential manufacturing hub as its labor costs are lower than those of China. Foreign investors rank Vietnam as an attractive destination for future investments. The country is one of the most popular destinations for expansion within the ASEAN region.13 It has been hailed as the next China, and with good reason: Vietnam has a culture that’s similar to the Red Dragon in that it’s an ex-Communist, one-party state, and attracts FDI due to its cheap labor costs.
After the death of its leader Le Duan in 1986, Vietnam began making the transition from a planned economy to a socialist-oriented market economy after suffering an inflation rate of 700 percent and a stagnant economy.14 The Communist Party launched a broad economic reform package called Doi Moi (“Renewal”), very similar to the Chinese model (economic openness mixed with communist politics), achieving similar results. Between 1990 and 1997 Vietnam’s economy grew at 8 percent per annum, with similar results in the following years.
This rapid growth from the extreme poverty of 1986 has given rise to advanced economies—especially Westerns—consumerist habits, particularly among the new rich of Vietnam, causing a widening gap of social inequality and rise in inflation up to 12 percent. In light of stable increases in GDP per capital and average disposable incomes during recent years, the still high percentage of food in the CPI basket emphasizes the substantial, negative impact of high inflation on Vietnam’s economy. The rise of food and fuel prices in the world market also imposes a burden on Vietnamese consumers. About 43 percent of disposable income is spent on food and eating activities, which means that the majority of people’s consumption budget currently goes to the food sector, giving it substantial revenues as compared to other industries. As the wet markets serve as the main retail channel of most types of food, it is fair to say that nearly 40 percent of people spending will go to these wet markets for food purchases. Revenue of food “industry” will mostly be concentrated in the traditional markets, not on fast-food chains, restaurants, or retail chains as in the United States.
In Vietnam, the stronger integration with the world economy gives rise to sprawling of modern commercial centers, luxurious shopping complexes, and gigantic malls in big cities. The traditional consumption habits, however, still prevail and steer most people to traditional markets, sometimes called flea markets or wet market. These traditional markets are the major channel of retail dating back more than a thousand years ago since the very first urban areas arose and society formed an organized structure under the rule of dynasties. According to Vietnam Association of Retail,15 there are now approximately 9000 traditional markets nationwide and up to 80 percent of all retail sales are conducted through these traditional channels. In all, as depicted in Figure 8.6, retail businesses in Vietnam continues to soar.
According to statistics from the Ministry of Industry and Finance, as of May 2012,16 there are approximately 638 supermarkets and 117 malls across the nation. The number of newly established supermarkets and malls after five years of joining the WTO (2007–11) is 27 percent higher than in the five-year period prior to the WTO integration. Hence, the Communist Party leaders are very keen on maintaining the growth rate, so that within the next ten years the nation can attain the status of an industrialized country.* Whether the country will be able to achieve this status within such timeframe is yet to be seen, but Vietnam has unquestionably attained relatively stable macroeconomic conditions.
According to the World Bank,17 as of 2013, the country has been able to maintain a moderate level of inflation at 6.7 percent, while also maintaining a stable exchange rate. The dong depreciated by 1.6 percent in the past 12 months, based on average exchange rates by commercial banks. Simultaneously, the government has been able to significantly increase foreign reserves. It has grown from 2.2 months of import cover at the end of first quarter of 2012 to 2.8 months at the end of first quarter of 2013. This while reducing sovereign risks, with the country’s credit default swap (CDS) about 250 basis points in June 2013 compared to about 350 in June 2012.
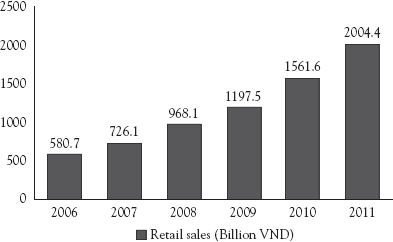
Figure 8.6 Revenue from retail sales and services in Vietnam 2006–11
As a result of strong foreign investment, which accounted for 66 percent of Vietnam total exports, Vietnam’s solid export growth has been significant. The total export value rose by 16 percent in the first half of 2013 compared to the same period last year, with a wider diversification of export composition although more concentrated on high-tech products, such as cell phones and parts, surpassing the country’s traditional exports of crude oil, garment, and footwear. In fact, cell phones, electronics, and computers, combined now account for nearly a fifth of Vietnam total exports. Most significantly, in 2012, Vietnam achieved its first ever surplus in trade balance since 1992.
But there are some concerns looming over Vietnam’s economic outlook. The total FDI ratio has recently declined from a record 11.8 percent in 2008 to about 7.7 percent in the first half of 2013, and other ASEAN countries, such as Indonesia and Thailand, are performing better, while new competitors, such as Myanmar, closing in. Vietnam’s growth has slowed down since the onset of economic reforms in the late-1980s. Real GDP grew by 5.25 percent in 2012, which although impressive if compared to advanced economies, is the lowest level since 1998.
At this pace, the World Bank has predicted that the country’s economy during 2010–13, for the first time in nearly two decades, would grow at a slower pace than Indonesia and the Philippines. The main cause for the slowdown is the decline in FDI and consequently, low Purchasing Managers Index (PMI), which has remained below 50 marks for most of 2012 and 2013; PMI below 50 signals contraction in production. There has also been a slowdown in retail sales and services, from 24 percent in 2011 to 16 percent in 2012, and to 11.9 percent in the first half 2013. Figure 8.7 provides a snapshot of Vietnam’s economic achievements and challenges.

Figure 8.7 Vietnam’s economic achievement and challenges as of July 2013
Source: The World Bank
Egypt
Occupying the northeast corner of the African continent, Egypt is bisected by the highly fertile Nile valley, where most economic activity takes place. Egypt’s economy was highly centralized during the rule of former President Gamal Abdel Nasser but opened up considerably under former Presidents Anwar El-Sadat and Mohamed Hosni Mubarak. Cairo, from 2004 to 2008, aggressively pursued economic reforms to attract FDI and facilitate GDP growth. Notwithstanding the relatively high levels of economic growth in recent years, living conditions for the average Egyptian remains poor, which has contributed to major public discontentment.
The first year after the fall of the Egyptian president, Hosni Mubarak, in February 2011 was very disruptive for Egypt’s economy. After 30 years of dictatorship, elections brought to power the Muslim Brotherhood, who promised to be inclusive and tolerant. But since the Brotherhood Muhammad Morsi became president at the end of June of 2012, the political climate in the country has become even more chaotic. Egyptian society is ever more polarized, and protests frequently turned into violence. The security forces vacillates between support for the Islamists and deep-seated suspicion of them. All the while Egypt’s economy has continued to slide toward major disarray, as most economic indicators point to challenging times.
Following the political unrest, the Egyptian government drastically increased social spending to address public dissatisfaction, but political uncertainty at the same time caused economic growth to slow significantly, reducing the government’s revenues. Tourism, manufacturing, and construction were among the hardest hit sectors of the Egyptian economy. Subsequently, the government had to resort to the utilization of foreign exchange reserves to support the Egyptian pound. At the time of this writing, it is clear that Egypt will likely seek a loan from the IMF, or perhaps from the newly former BRICS development bank.
Since the revolution, according to YaLibnan, a leading specialized source of Lebanese news,18 the Egyptian pound has slid about 10 percent, while unemployment hit 20 percent. As of fall 2013, FDI is withering, and total reserves have fallen from $35 billion to $10 billion in the past four years. Many of Egypt’s most dynamic businessmen have fled the country, fearing they will be arraigned for complicity with Mr. Mubarak, while the government threatens to reverse a number of privatizations. Meanwhile, the price of food is soaring at a time when the average family spends nearly half of its income to feed itself, forcing a quarter of Egypt’s 83 million people to live below the poverty line.
According to the Pew Center’s Global Attitudes Project more than 70 percent of Egyptians are unhappy with the way the economy was moving, and 49 percent believe that a strong economy is more important than a good democracy. We believe the number of people disillusioned with the revolution is likely to increase as the economy weakens further. Hafez Ghanem, Senior Fellow, Global Economy and Development with the Brookings Institution,19 argues that the Egyptian economy is unlikely to collapse suddenly, but in the absence of a serious macroeconomic stabilization program it will continue to deteriorate gradually.
The Egyptian economy is plagued with low growth, increasing unemployment and inflation, as shown in Figure 8.8, excluding corruption, as the country witnessed more than 6,000 corruption investigations and several high profile incriminations since February 2011. The future of Egypt’s economy will depend on how well the transition to democracy will be. We must consider the fact that Egyptian politics is polarized and it is difficult to see how serious economic reforms would be implemented without first reaching compromise on some problematic political issues.
Ashraf El-Arabi, Planning and International Cooperation Minister, argues that Egypt’s economic growth rate in the second quarter of 2012/13 fiscal years would likely be 0.2 percent lower than the previous quarter, while in the first quarter the economy grew by 2.6 percent, with a forecasted growth for October–December 2012 period in the neighborhood of 2.4 percent. Although Egypt has opened its markets to global trade and investment, nontariff barriers continue to constrain trade freedom. The investment regime has been stable, but flows have slowed significantly due to the challenging economic and political situation, and the central bank has imposed controls on capital transfers. The state-dominated financial system has been stressed, with negative impacts from the global crisis exacerbated by domestic turbulence.
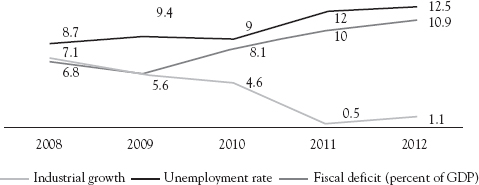
Figure 8.8 Egypt’s selected economic indicators
Source: Brookings Institution.
It’s clear that Egypt is facing a major economic crisis, and needs to implement credible reforms to stabilize the economy, control corruption, and lay the foundation for inclusive growth. Such reforms would normally include a reduction in the fiscal deficit to bring the domestic debt under control and a further depreciation of the Egyptian pound to encourage exports and tourism.
The Egyptian government is negotiating with the IMF to obtain support for such a stabilization program. IMF support is desirable because it would open the doors for increased assistance from other bilateral and multilateral donors, and thus help ease the pain of stabilization. The revolution severely retrained economic growth in Egypt. Growth predictions by the World Bank20 are to reach only one percent in 2013, compared with 5.2 percent prior to the revolution.
Analysts expected Egypt to regain its growth trajectory once political stability returned, which has not been the case so far, as the political instability persists. Egypt does possess many assets, including fast-growing ports on the Mediterranean and Red Sea linked by the Suez Canal, a growing tourism network, and vast untapped natural gas reserves. Nonetheless, as long as the political unrest endures, chances for an economic rebound are nominal. Hence, Egypt’s economy is expected to grow 2.6 percent in 2014, well below the 3.5 percent projected by the government.21 A Reuters poll also suggested growth would pick up to four percent only starting in 2015. Figure 8.9 provides a snapshot of the severe downturn of Egypt’s GDP growth since 2008.
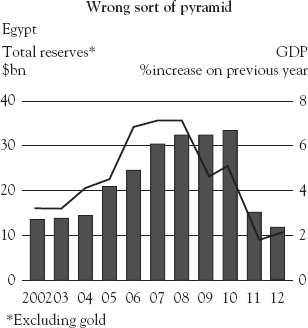
Figure 8.9 A snapshot of the severe downturn of Egypt’s GDP growth since 2008
Source: IMF
Given its challenges vis-à-vis politics and economics transition, Egypt has been experiencing an extended period of instability. Much-needed improvements in economic policy have been delayed, and the effectiveness of reforms that might have helped to open markets and improve productivity have been undercut by the tenuous rule of law and the legacy of Egypt’s socialist past. Deeper institutional reforms critically are needed to spur lasting economic growth and development. Those reforms include strengthening the judicial system, better protection of property rights, and more effective action against growing corruption.
Turkey
Located between Europe and major energy producers in the Middle East, Caspian Sea, and Russia, Turkey was founded in 1923 from the Anatolian remnants of the defeated Ottoman Empire. After a period of one-party rule, an experiment with multi-party politics led to the 1950 election victory of the opposition Democratic Party and the peaceful transfer of power. Since then, Turkey’s political parties have multiplied and democracy has been disrupted by periods of instability and intermittent military coups in1960, 1971, and 1980, which in each case ultimately resulted in a return of political power to civilians.
Turkey has a dynamic economy that has trading links with the European Union but without the constraints of the eurozone or EU membership. The country joined the UN in 1945 and NATO in 1952. Subsequently, in 1964 Turkey became an associate member of the European Community. Over the past decade, it has undertaken many reforms to strengthen its democracy and economy, and began accession membership talks with the EU in 2005. The country is a founding member of the OECD (1961) and the G-20. Since December 31, 1995, the country is part of the EU Customs Union.
An aggressive privatization program has reduced state involvement in basic industry, banking, transport, and communication, and an emerging cadre of middle-class entrepreneurs is adding dynamism to the economy and expanding production beyond the traditional textiles and clothing sectors. According to a survey by Forbes magazine22 in March 2013, Istanbul, Turkey’s financial capital, boasted a total of 37 billionaires (up from 30 in 2012), ranking 5th in the world behind London and Hong Kong in 4th (43 billionaires), New York (62 billionaires), and Moscow (84 billionaires). Turkey’s major cities and its Aegean coastline attract millions of visitors every year.
Its ostensibly free-market economy is increasingly driven by its industry and service sectors, although its traditional agriculture sector still accounts for about 25 percent of employment. Turkey has major natural-gas pipeline projects that make it an important energy corridor between Europe and Central Asia. The automotive, construction, and electronics industries are rising in importance and have surpassed textiles within Turkey’s export mix. In 2006, oil began to flow through the Baku-Tbilisi-Ceyhan pipeline, marking a major milestone that will fetch up to one million barrels per day from the Caspian to market. Several gas pipeline projects also are moving forward to help transport Central Asian gas to Europe via Turkey, which over the long term will help address Turkey’s dependence on imported oil and gas to meet 97 percent of its energy needs.
In 2011, the World Bank23 placed Turkey as the world’s 15th largest GDP-PPP and 18th largest Nominal GDP. After Turkey experienced a severe financial crisis in 2001, Ankara adopted financial and fiscal reforms as part of an IMF program. Then, according to data from the OECD,24 following weak growth in 2012, the economy began to regain momentum as consumption and investment contracted and offset a surge in exports. Growth is projected to surpass to above three percent in 2013 and, as the global recovery gathers strength, to pick up to 4.5 percent in 2014. Inflation and current account deficit, however, remain above comfort levels.
According to the OECD,* a tight fiscal stance decided upon has been set for 2013 and 2014, but policymakers should allow the economy to stabilize and have flexibility to consider some temporary stimulus should conditions turn out much worse than projected. Internationally comparable general government accounts would help implement and assess the stance of fiscal policy. Monetary policy needs to reduce inflation without undermining the recovery and without pushing up the real exchange rate thus hurting competitiveness. Disinflation would limit the costs on this front. Structural reforms to accelerate formalization and productivity gains remain crucial for strong and sustainable growth.
As depicted in Figure 8.10, the reforms strengthened the country’s economic fundamentals and ushered in an era of strong growth, averaging more than six percent annually until 2008, growing faster than any other OECD country. Global economic conditions and tighter fiscal policy, however, caused GDP to contract in 2009, but Turkey’s well-regulated financial markets and banking system helped the country weather the global financial crisis. GDP rebounded strongly to 9.2 percent in 2010 and continued to grow, as exports returned to normal levels following the recession.

Figure 8.10 Turkey’s real GDP growth 2002-2012
Source: Conference Board Database
Despite impressive growth over the past decade, as a group, Turkish performance lagged significantly behind emerging and developing economies, as well as advanced economies (see Figure 8.10), but starting in 2009 real GDP rose by 95 percent compared to Turkey’s 64 percent. Real GDP in large emerging markets such as China, India, Bangladesh, and Indonesia all grew more rapidly than in Turkey, as it did in many smaller African and Latin American countries. Turkey’s rank in global GDP improved marginally over the decade, as in purchasing-power adjusted terms, it went from 17th to 16th in global GDP rankings, surpassing Australia. Measured by current exchange rates, however, the country rose from 21st to 17th, surpassing Taiwan, Switzerland, Belgium, Netherlands, and Sweden, but falling behind Indonesia.* Notwithstanding, Turkey’s performance, when leveraged against the emerging markets, is less distinguished, but it is significant when compared to advanced economies. The IMF is predicting Turkey’s real GDP to be 3.8 percent in 2013, falling back to 3.5 percent in 2014.25
Growth dropped to approximately three percent in 2012. Turkey’s public sector debt to GDP ratio fell to about 40 percent, and at least one rating agency has upgraded Turkey’s debt to investment grade in 2012. Turkey remains dependent on often volatile, short-term investment to finance its large trade deficit. The stock value of FDI stood at $117 billion at year-end in 2012. Inflows have receded because of continued economic turmoil in Europe and the United States, the source of much of Turkey’s FDI. Turkey’s relatively high current account deficit, uncertainty related to monetary policy-making, and political turmoil within Turkey’s region leave the economy vulnerable to destabilizing shifts in investor confidence.
South Africa
South Africa is another resource-rich economy, with 49 million people and a GDP of $280 billion, which positions the country with a decent-sized economy. The IMF,26 however, argues South Africa faces low growth, widespread unemployment, and a high reliance on foreign capital inflows.
Rising commodity prices, renewed demand in its automotive and chemical industries, and spending on the World Cup have helped South Africa; a diversified economy rich in resources such as gold and platinum, resume growth after it slipped into recession during the global economic downturn.
Despite considerable success on many economic and social policy fronts over the past 19 years, South Africa faces a number of long-standing economic problems that still reflect the long-lasting and harmful legacy of apartheid. Unemployment remains excessively high, and educational outcomes are poor on average and extremely uneven, which aggravates the excess supply of unskilled labor as well as worsening income inequality. In addition, the prospects for sustained improvements on the quality of life of its people are compromised by environmental challenges, notably climate change and water issues.
The OECD27 argues that South Africa needs to achieve rapid, inclusive economic growth while at the same time making the transition to a low-carbon economy and effectively managing the country’s scarce water resources. Tackling the key problems effectively will require continued and skillful management of macroeconomic policies, but above all improved implementation of structural policies, with education being a particularly critical area. As shown in Figure 8.11, the global economic crisis that started in 2008, and the weak global economic outlook, is not helping the country.

Figure 8.11 South Africa GDP growth
Source: OECD
South Africa has, however, posted major achievements since the transition to majority rule in 1994. Per capita GDP has increased by 40 percent in inflation-adjusted terms. The poverty rate has dropped by 10 percent, and schools and hospitals have been built in previously underserved areas, while government-financed houses have been made available to many in need, and social transfers now reach more than half of all households. In addition, the country has strong macroeconomic policy institutions. The government’s medium-term fiscal policy framework has been a pillar for the country’s prudent fiscal policy, while monetary policy has anchored inflation expectations.
Many see the nation as a gateway to investment into the rest of Africa, including HSBC, which sees long-term growth potential in mining, energy, and the chemical firm Sasol Ltd. Notwithstanding, South Africa, and the whole continent of Africa, is rich in minerals and oil. China has an economy that requires them in abundance. Since the mid-1990s the economy of sub-Saharan Africa has grown by an average of five percent a year. At the start of this period Africa’s trade with China was negligible. It is now worth roughly $200 billion a year. Most of Africa’s exports are raw materials. China sends manufactured goods back in return.
Natural resources make up a quarter or more of export revenues for nearly half of the 45 countries in sub-Saharan Africa. Nine of them, including Nigeria and Angola, which have two of Africa’s largest economies, benefit from exports of oil and gas. Yet mining and oil are far from the whole story in South Africa. The IMF28 recently (2013) warned that South Africa is trailing other emerging markets and must quickly implement reforms if it wants to avoid a crisis, pointing to painfully high unemployment and a plethora of other economic troubles staking the country. The country’s growth has underperformed and vulnerabilities have increased considerably, including continued sluggish growth of two percent in 2013 and 2.9 percent in 2014.
But while much of the world staggered in the wake of the global financial meltdown, South Africa has managed to stay on its feet—largely due to its prudent fiscal and monetary policies. The country is politically stable and has a well-capitalized banking system, abundant natural resources, well-developed regulatory systems, as well as research and development capabilities, and an established manufacturing base. The World Bank ranked South Africa as an “upper middle-income country.” It is the largest economy in Africa. It was admitted to the BRIC group of countries of Brazil, Russia, India, and China (known as BRICS) in 2011.
With a world-class and progressive legal framework, South African legislation governing commerce, labor, and maritime issues is particularly strong, and laws on competition policy, copyright, patents, trademarks, and disputes conform to international norms and standards. The country’s modern infrastructure supports the efficient distribution of goods throughout the southern African region.
The economy has a marked duality, with a sophisticated financial and industrial economy having grown alongside an underdeveloped informal economy. It is this “second economy” which presents both potential and a developmental challenge.
In its 2012–13 Global Competitiveness report,29 the World Economic Forum ranked South Africa second in the world for the accountability of its private institutions, and third for its financial market development, “indicating high confidence in South Africa’s financial markets at a time when trust is returning only slowly in many other parts of the world.” The country’s securities exchange, the JSE, is ranked among the top 20 in the world in terms of size.
South Africa’s success in reforming its economic policies is probably best reflected by its GDP figures, which reflected an unprecedented 62 quarters of uninterrupted economic growth between 1993 and 2007, when GDP rose by 5.1 percent. With South Africa’s increased integration into the global market, there was no escaping the impact of the 2008–09 global economic crises, and GDP contracted to 3.1 percent.
While the economy continues to grow - driven largely by domestic consumption—growth is at a slower rate than previously forecasted. It is projected to grow at 2.7 percent in 2013, 3.5 percent in 2014 and 3.8 percent in 2015. According to figures from the National Treasury, total government spending will reach R1.1 trillion rand in 2013. This represents a doubling in expenditure since 2002/3 in real terms.
To ensure that there is a similar improvement in service-delivery outcomes, the government is deploying measures to strengthen the efficiency of public spending and to root out corruption. Under its inflation-targeting policy, implemented by the South African Reserve Bank (SARB), prices have been fairly steady. In January 2013, the annual consumer inflation rate was 5.4 percent, dipping from December 2012’s 5.7 percent. Stable and low inflation protect living standards, especially of working families and low-income households.
The country’s outlook is affected both by national concerns, such as unrest in and pressure on the mining industry, as well as international sluggishness, with Europe as one of South Africa’s chief export destinations. However, trade and industrial policies encourage local firms to explore new areas of growth based on improved competitiveness. China, India, and Brazil offer significant opportunities. Infrastructure, mining, finance, and retail developments across Africa are helping to fuel a growth trajectory in which South Africa can participate.
The Problem of Corruption
According to Transparency International30 (TI), many of the CIVETS, as well as the BRICS and the MENA, countries experience major challenges with corruption. Figure 8.12 provides a global picture of 2011 corruption scores according to LexixNexis’31 RiskRadar*. When we look at the BRICS, for example, Chinese firms have the weakest overall performance among the bloc nations. In its report titled Transparency in Corporate Reporting: Assessing Emerging Market Multinationals32 TI analyzed 100 of the fastest growing companies based in 16 emerging markets. Three quarters of the businesses scored less than five out of ten, where zero is the least transparent. Scores were based on publicly available information about anti-corruption measures, transparency in reporting, how the companies structure themselves and the amount of financial information they provide for each country in which they operate.

Figure 8.12 2011 Global Corruption Index
Source: LexisNexis
Chinese companies accounted for more than a third of the assessed businesses. According to TI China must take “immediate action”† to raise standards. Companies in India scored best out of the BRICS with a result of 5.4. The studies credit this to national laws obliging publication of key financial information on subsidiaries. Some 75 of the 100 companies in the report come from BRICS nations, which have contributed 50 percent of world growth since the financial crisis. The study said about 60 percent of the firms evaluated does not disclose information about political contributions. TI called on companies in emerging markets to disclose to the public what they are doing in terms of prevent corruption as well as their relationship with their governments. It added legislation forcing companies to publish what they pay to governments in every country where they operate.
To continue to foster consistent growth, emerging markets must be partners in playing their part in the global fight against corruption. As emerging market companies expand their global influence they should seize the opportunity to become active participants in the role of stopping corruption internationally.
Government infrastructure contracts in the CIVETS bloc, as well as BRIC and MENA in general, might be hard to access without breaking the U.S. 1977 Foreign Corrupt Practice Act (FCPA) or the 2011 UK Bribery Act, making such companies exposed to DOD and SEC prosecutions. This is because requests for bribes are increasing in state procurement processes at both the provincial and local government levels. This could be a major problem for emerging market growth, not only the CIVETS. As defined by the U.S Department of Justice,33
The FCPA of 1977 was enacted for the purpose of making it unlawful for certain classes of persons and entities to make payments to foreign government officials to assist in obtaining or retaining business. Specifically, the anti-bribery provisions of the FCPA prohibit the willful use of the mails or any means of instrumentality of interstate commerce corruptly in furtherance of any offer, payment, promise to pay, or authorization of the payment of money or anything of value to any person, while knowing that all or a portion of such money or thing of value will be offered, given or promised, directly or indirectly, to a foreign official to influence the foreign official in his or her official capacity, induce the foreign official to do or omit to do an act in violation of his or her lawful duty, or to secure any improper advantage in order to assist in obtaining or retaining business for or with, or directing business to, any person.
Fraud in the construction sector, according to Grant Thornton,34 a global think-tank based in the UK, could be worth as much as $860 billion globally, which is about 10 percent of industry revenues, and it could hit $1.5 trillion by 2025.
It is important to note, however, corruption is not only a challenge in emerging markets. Advanced economies also are plagued by it, either as the proverbial “cost for doing business in emerging markets,” for accepting bribes, or for being victims of extortion. Across Australia, Canada, India, the UK, and the United States it is evident that fraud in the development of infrastructure is commonplace and in some cases endemic.
In the UK, the three biggest areas of construction fraud are bid rigging or alterations to contracts and false misrepresentation, which spans use of illegal workers, falsifying reports, results or certificates, and noncompliance with regulations. Grant Thornton’s report refers to breakfast clubs,* where contractors meet to decide who will win the latest contract. In New York, the think-tank calculated that five percent of construction projects’ were awarded to five Mafia families alone (2011). The problem is that many companies are not aware of their increased level of liability or new legal risks that threaten their business. The drive for growth also is increasing corporate corruption risk as businesses expand into emerging markets where corruption tends to be more prevalent. In countries such as the UK, Canada and Australia, the propensity of bid rigging has been normalized to the extent that it might even be perceived as legal, according to Grant Thornton’s report.
To prevent fraud, policymakers in emerging markets need to combat the practice by making the issue a priority in national agendas. They needs to devise processes to scrutinize in-country multinational firms and their own corporations—in particularly, they would be well serviced to not forget to extend this same scrutiny to government agencies. Policymakers must be able, and capable, to place aside reputational issues and prosecute fraudulence. The use of information systems and technology, in an effort to tap into big data to identify and predict fraud, also is paramount. Governments also must encourage whistle blowing, and provide full support and cooperation to these practices listed in this book.
* Later turned into BRICS, by the BRIC nations themselves with the inclusion of South Africa, although in this chapter we keep this country as part of CIVETS, as originally intended by those whom coined the term.
* Ibidem.
* Ibidem.
* According to Investopedia, “Money that flows regularly between financial markets as investors attempt to ensure they get the highest short-term interest rates possible. Hot money will flow from low interest rate yielding countries into higher interest rates countries by investors looking to make the highest return. These financial transfers could affect the exchange rate if the sum is high enough and can therefore impact the balance of payments. http://www.investopedia.com/terms/h/hotmoney.asp.
* Ibidem.
* Ibidem.
* Note that such comparisons of rankings over time using current dollars can be misleading due to movements in real exchange rates.
* The RiskRadar is a content platform for people who wish to keep abreast of the latest developments in AML and anti-bribery and corruption. The RiskRadar is powered by LexisNexis.
† Ibidem.
* Ibidem.