

Chapter 6
SAS Information Map Studio
Preparing Data for Report Authors
6.1 Getting Started
6.1.1 Quick Tour
6.1.2 Prerequisites
6.2 Creating Your First Information Map
6.2.1 Selecting and Organizing the Data Sources
6.2.2 Creating New Data Items
6.2.3 Defining Filters and Prompts
6.2.4 Testing the Information Map
6.3 Enhancing Your Information Map
6.3.1 Setting Up Prefilters
6.3.2 Joining Tables
6.3.3 Adding Custom Formats
6.4 Tips and Tricks
6.4.1 Building Cascading Prompts
6.4.2 Using Shared Prompts
6.4.3 Allowing Value-Generation for Prompts
6.4.4 Using CASE Statements
6.4.5 Integrating SAS Stored Processes
6.4.6 Sourcing Maps with OLAP Cubes
6.4.7 Creating an Identity-Based Filter
6.4.8 Repairing Broken Information Maps
6.5 SAS Administrator Tasks
6.5.1 Roles and Responsibilities
6.5.2 Organizing Metadata Folder Structure
6.5.3 Sharing Optional Prompts
6.5.4 Identity-Based Filter Properties
Chapter 6
SAS Information Map Studio
Preparing Data for Report Authors
Data tables hold valuable information for a business. However, for general users, information such as data table relationships, cryptic variable names, and complex formats can hinder the process of analyzing and generating value from the data. Information maps provide a business layer definition that report authors can understand easily. Key benefits of using information maps include:
- You can customize labels and descriptions
- There is a central location for calculations and filters
- Query and data-storage information remains transparent to report authors
Typically, creating information maps is reserved for the advanced report creators and data administrators who have an understanding of not only the data table structures but also of what report capabilities are needed.
Information maps are used in all of the SAS BI clients. Throughout this book, there are examples of information maps in use in the chapters about SAS Add-In for Microsoft Office, SAS Web Report Studio, and SAS Enterprise Guide.
There are two ways to create information maps: using PROC INFOMAP or SAS Information Map Studio. Many users prefer the simplicity of SAS Information Map Studio. In this chapter, you will use SAS Information Map Studio to create and enhance information maps with filters and prompts. These examples demonstrate how to create a basic information map from relational tables, and then how to enhance the map using filters and prompts. In addition, there are some tips and tricks for solving advanced issues as well as how to use OLAP cubes and SAS Stored Processes as your data source.
6.1 Getting Started
To begin learning about this tool, here is a brief introduction to the tool and what is needed to get started.

|
1 |
Resources pane |
Use this area to navigate the data sources that you want to add to the information map. |
|
2 |
Information Map Creation pane |
Use this area to design the information map. You can join data sources and make changes to your information map. |
|
3 |
Information Map Properties pane |
Use this area to quickly make changes to the properties of individual data items. |
6.1.2 Prerequisites
Before using SAS Information Map Studio, ensure that the following software is available and all necessary permissions are established:
- SAS Information Map Studio is installed on your desktop.
- You will need permission to access the SAS Metadata Server. Your SAS administrator sets these permissions and provides the name and location of the SAS Metadata Server.
- Data libraries are established and any data sources are registered. The source data used in the examples within this section have already been registered within the SAS Metadata Server.
Note: From SAS Enterprise Guide, use the INFOMAP procedure to generate information maps. Go to support.sas.com to learn more about the INFOMAP procedure.
6.2 Creating Your First Information Map
Information maps provide report authors with a user-friendly way to query data and get quick results. An information map contains data items and filters, which are used to build queries. Setting up an information map is a simple process of selecting and organizing data, customizing new or existing data items, defining filters, and testing the results.
In the following example, an information map about the customers of a candy company is being created. The sales data analyst asked for an information map that she could use to provide reports detailing each customer’s sales activity for the past year. The following figure shows the information map final report, as used in SAS Web Report Studio.

Figure 6.2-1 Information map used in SAS Web Report Studio
6.2.1 Selecting and Organizing the Data Sources
You can select one or more relational tables or a single OLAP cube for the information map to use. To create the Candy Customer Sales information map, use the three SAS data sets shown in the following figure. Each data set contains specific information needed to complete the information map. The first data set, CANDY_SALES_HISTORY, contains a detailed history of the sales; the second data set, CANDY_PRODUCTS, contains the products by category and subcategory; and the third data set, CANDY_CUSTOMERS, list the customers by name. The arrows indicate the data relationships between the data sets. When these tables are joined, the information map is created. For more details about how this report is used to create reports, refer to Chapter 7, “SAS Web Report Studio.”

Figure 6.2-2 SAS data set relationships
6.2.1.1 Select the Data Source
To create an information map, do the following:
- Open SAS Information Map Studio and connect to the server.
- Use the Resources-Application Servers panel to navigate the libraries to select the tables or cubes that you want to use.
 Ensure that any tables or cubes you want to use are registered in the SAS Metadata Server. To learn how to set up libraries and register data, refer to Chapter 2, “SAS Enterprise Guide.”
From the Resources - Application Servers area, click Show and select Tables or Cubes to filter what the libraries list. For this example, use the SAS data sets from the Candy library.

Double-click the data sets to add them to the Selected Resources in the Design tab. After the data tables are added to the project, the names are listed in Selected Resources area in the Design tab.
When selecting more than one relational table, define the relationships between the tables for SAS to combine the tables. Click the Relationships tab to view the tables. To define the specific join relationships, click and drag from one variable to another to define the specific join relationship.

In preceding figure, join CANDY_SALES_HISTORY with CANDY_PRODUCTS by ProdID to get the details of what each customer ordered. CANDY_SALES_HISTORY does not have the specific details about the customers, such as the company name and location. This information is contained in the CANDY_CUSTOMERS table. These tables are joined by the CustID and Customer data items. It does not matter if the variables have different names, as long as the values can be used to match. Refer to Section 6.3.2, “Joining Tables,” for more details about advanced joins.
- Add the data items to the Information Map Contents. You can also create folders to organize the data items into categories.
To add a folder, right click the information map name, which is untitled because it has not been saved yet. Select New Folder from the pop-up menu and type a name for the folder.
- On the Design tab, select the data items, and then click the single arrow button to move items to the information map. To move data items to a specific folder, select the folder name before moving the data item.
Use the double arrow button to move everything into the information map at once.

As data items are added to the information map, the icon changes into a category or measure, as shown in the previous figure. The category icons (such as category, product, and name) indicate data items that are used to group measures. The measure icons (such as retail price and royalty) indicate a numerical value. Refer to Chapter 7, “SAS Web Report Studio,” for more data-item definitions.
A measure cannot be used to group other data items. Notice in the figure above that the Date data item changed from a date icon to a category icon. You can change the names, type, and formats.
For numeric data
items that represent qualitative data, change the properties of the item from Numeric to Category. This
ensures that the values are available for grouping in the report.
6.2.1.2 Organizing the Data Items
Data elements can remain in their initial order; however, this is the exact view that a report author sees. To make the information map more user-friendly, reorganize the data items into a logical structure. For instance, in the previous figure, Subcategory comes after Product. It would make more sense for it to follow Category.
- To reorganize the data elements, use the arrows located to the right of the Information Map Contents pane to move data elements around, or click and drag elements within the pane.

A huge benefit of using information maps is the ability to assign data item names that are familiar to people in the business. In the information map, the Name data item actually contains the customer’s company name. Because this data item might be confused for salesperson’s name or even the customer contact name, rename the data item to Customer.
- To rename the data item, right click the Name variable and select Properties from the pop-up menu. In the Data Item Properties window, type the new name in the Data item name field. The ID field contains the original variable name.
The report authors and users see the data item name when they use the information map as a source for reports in SAS Enterprise Guide, SAS Add-In for Microsoft Office, or SAS Web Report Studio. Ensure that the data item name and description use the terminology common to the organization. For instance, some organizations refer to customers as clients, patrons, or even shoppers. In this case, use the common terminology as the name. In the Description field, add helpful text about the data item. For instance, add the data source when it originates from an unusual source or list the calculations for Measures that might cause confusion for the report builder.

Right click the data item and select Rename from the pop-up menu as a shortcut method.
In the example, rename the other data items for clarification and ease; for instance, the Date data item became Order Date and PrimPlnt changed to Primary Plant. As you continuing reading this chapter, you might notice other examples of changes made to the data items.
6.2.2 Creating New Data Items
You might want to add new data items to the information map. The data items are based on character, numeric, date, or time columns in a data set.
The Order Date data item is the day the customer placed the order. Because the customers are making many orders in a month, the report author wants the option of grouping the results by month. Using the Date variable, create a new variable called Order Month.
To create the new data item, do the following:
- There are multiple ways to get to the Data Item interface. Select New Data Item from the Insert
menu, click the Data Item icon on the menu bar, or right-click on the folder name and choose the New Data Item menu item.

- The initial screen allows only a new data item name and description. Click the Edit button to enter an advanced expression.

- In the Expression Text field, type the expression based on the data items in the Data Sources tab. Use functions from the Functions tab, such as INDEX(), MDY(), or CASE statements to create new variables.

1 Type Use this field to specify whether the data item is a character, numeric, or datetime value.
2 Expression Text Use the functions and data items to build the expression.
In the previous figure, the MDY() function is used to create the new variable. The MDY function sets the day value to the first of the month and uses the month and year values of the Date value so that the data item groups properly in the reports.
The MONTH and YEAR functions are used to extract the month and year from the order date items.
3 Business Data Use business data items when the data item from the information map is required. In the last step, Date was renamed to Order Date. Notice that it is referred to as <<root.Order Date>> in the expression. Root indicates that it is from business data.
Use the business data when you created a new data item or otherwise made changes to a data item that could affect the formula.
4 Physical Data Use physical data items when the data item from the data set is required. Notice that it is called <<CANDY_SALES_HISTORY.Date>> in the expression. This data items uses the data set name to indicate that it is physical data.
The physical data does not have to be included in the information map to be used in the expression.
Use the Validate button to
verify that you typed the expression correctly. - After creating the expression, you might need to set the format for the variable. Click the Classifications, Aggregations, Formats choice to make the changes.
In the Formats area, select
the
Formats area, select
the  Format Type and Format name you
want, as shown in the following figure.
Format Type and Format name you
want, as shown in the following figure.
6.2.3 Defining Filters and Prompts
When using the information map in SAS Web Report Studio, report authors can define filters and prompts when they create a report. However, every time the report authors create a new report based on the information map, they must recreate the same filters and prompts. It makes more sense for common filters and prompts to be available from within the information map.
In this example, the report authors need only the most recent customer order history for reporting. The current information map contains over 5 years of data for all past and present customers. Instead of each report author creating a date and customer filter for each report, add the filter to the information map.
6.2.3.1 Adding a Filter
To add a filter, do the following:
- There are multiple ways to get to the Filter interface. Select the New Filter item from the Insert
menu, click the Filter icon on the menu bar, or right-click on the map name and choose the New Filter menu item.

- When the New Filter window appears, complete the fields as shown to create a filter that limits the records to the past 12 months.

1
Filter name and Description
Type the filter name and a short description in these fields. Values typed in this field are what the report authors see.
2
Data item
Select the variable that you want to use for the filter.
3
Condition
Select how to filter the data item.
This selection includes options based on the type of data item filtered, such as Equal to, Not Equal to, Is after or equal to. For dates, the choices include Year to Date and Previous N Periods. For this example, select the Is before or equal to choice.
4
Value(s)
Select how the filter receives data. The data can be typed, the report author can be prompted, or the data can be generated from a custom SQL expression. For this example, the filter is one year ago, based on the current date.
5
Hide from user
Chose this option when the filter is required to run each time the information map is accessed. See Section 6.3.1, “Setting Up Prefilters,” for more information.
6.2.3.2 Adding a Prompt
Prompts are used to allow the end user to choose how to filter the data. In the information map you are creating, the reports might be generated for an individual customer that the end user selects. Create a filter that uses a prompt to select the customer name from a predefined list. Refer to Chapter 4, “The Prompting Framework,” for a more complete discussion about prompting.
To create the Customer prompt, use the following instructions.
- Click the information map name and select Create a Filter.
- To start the filter, type the filter name and select the data item and condition as described in previous section.
- In the Value(s) drop-down list, select Prompt user for value(s). After selecting the method, use the Values(s) area to select an existing prompt or create a new one. For this example, select the New button to create a new prompt.

- In the General tab, type prompt name and create text to assist with user interaction, as shown in the following figure.

- Click the Prompt Type and Values tab to set up the prompt. For this example, the report author selects a customer name from the list. The customer list is considered dynamic because customers are added and removed, sometimes on a daily basis. It would be time consuming to keep the list accurate. You can set up a prompt to query the table for the customers it contains, thus ensuring that the data is as accurate as possible.

To set up the prompt, do the following:
- Prompt type contains a list of options based on the data element. Generally the default value works.
- Select how the prompt receives data from the Method for populating prompt drop-down list. Choose one of three options: users type a value or can select it from a static or dynamic list.
- When you allow the end user to enter freeform text, use the Minimum length and Maximum length fields to validate the user-entered text for number of characters. To ensure that the user entered a value, set the minimum length to 1.
- Use a static list when the values do not change often. For instance, for the regions (east, west) or order status (open, shipped). Use a dynamic list when the values change often. In the Maximum number of values to display field, specify the number of values initially displayed to the user.
Dynamic lists result from a select, distinct query of the source data table. For large data tables, this query could slow the prompt display. - In the Number of values drop-down list, specify whether the report author can select one or more, as well as multiple ordered values. Your choice much match the condition you selected for the filter. If you want to allow multiple values, then select the In a list item in the Conditional field in the New Filter window.
- In the Data source area, select the source for prompt. There are two choices: Use the current information map or Specify a data source. Use the Browse button to find the source you want to use.
- Click OK to create the filter. The prompt is added to the Edit Filter window as shown in the following figure. If you need to make changes to the prompt later, click the Edit button.

6.2.4 Testing the Information Map
After defining the map, it is a good idea to validate the filters, new data items, and the data joins prior to releasing the information for others to use. Also, you want to save the information map to the designated location. We called this information map Candy Customer Sales.
To test the map, use the following instructions.
- Select the Checked Map icon on the menu bar to open the Test Map interface.
- In the Test the Information Map window, the Available items area lists the data items. The data items can be placed in the Selected items area in different combinations so you can review the results. By default, the measures are displayed as aggregated values. By default, 100 rows are shown. To review fewer or more rows, change the value.
- To complete the test, do the following steps:
- Move data items from the Available
items area to the Selected
items area using the arrows. Ensure that any new data items and
filters are included, such as the CustomerFilter and Order Month.
Click the Run Test button to start the test. Because the CustomerFilter was selected, you are prompted to select a customer, as shown in the following figure. - When the result appears, review any new filters or data items to ensure that they are correct. The Customer filter prompted you to select a customer and Order Month appears in the correct format.

- Move data items from the Available
items area to the Selected
items area using the arrows. Ensure that any new data items and
filters are included, such as the CustomerFilter and Order Month.
6.3 Enhancing Your Information Map
Using the advanced filtering, joining, and data items techniques available in SAS Information Map Studio, you can shorten the creation and maintenance process.
6.3.1 Setting Up Prefilters
Hidden filters can also be created and then used to prefilter the data source before the user accesses it. For instance, the data set might contain 10 years of data; however, you would like to offer data only for the past 12 months.
One solution is to build a process that creates a new table containing data for the past 12 months alone. Using this approach as a solution, the server quickly fills with small data tables to manage. A better solution is to create an information map with a prefilter that extracts the needed data. This eliminates the need for additional summary tables.
To add a prefilter to the information map, do the following:
- Create a filter as shown in Section 6.2.3 “Defining Filters and Prompts.”In this example, use the Past12Months filter.
Select the Hide from user
option if you do not want the users to see this filter.
- Click the information map name and select Properties.

- Go to the General Prefilters tab. Move the Past12Months filter into the Selected filters area, as shown in the following figure.

- Click on the Required Tables tab to add the data table connected to the filter. In this example, CANDY_SALES_HISTORY in added to the Required tables area.
Any tables that use a prefilter must be listed as a required table. This ensures that the prefilter is always used, even when no data items from the table are included in the information map contents or the report results.
6.3.2 Joining Tables
SAS Information Map Studio can easily be adjusted to assist with improving and adjusting the join behavior.
6.3.2.1 Setting Join Preferences
SAS Information Map Studio can automatically create relationships between tables as you add them into the information map. Open Tools > Options. Use the Initial Creation Rule area to select the behavior for the joins. There are three choices, as described in the following table and shown in the following figure.
|
None |
Does not create any relationships. This is the default. |
|
From existing relationship definitions |
Uses the table metadata relationship based on primary and foreign key designations. |
|
From similarly defined columns |
Creates relationships by using table columns that have the same name, type, and length. |

Figure 6.3-1 Setting join preferences
6.3.2.2 Modifying Joins
You can modify the table joins to ensure that the data you want is available.
- For each relationship, you also have the ability to change the join properties by double-clicking on the join (Venn diagram icon), as shown in the following figure.

- The Relationship Properties window allows you to control how the tables are joined. In this example, CANDY_CUSTOMERS has 1 record per customer, while CANDY_SALES_HISTORY has 1 record per sale. You need to make some changes for
the table to join as needed.
- In the Cardinality
drop-down list , select how the
tables are joined. For this example, ensure that the cardinality is many to one to
indicate there are many orders to a single customer.
- Select the Outer
join check box for Table 2. This ensures that all the customers, even those without any orders, are available.
- Use the Join keys fields
 to
indicate how the tables are joined. Use the Add button if there is more than one
join key.
to
indicate how the tables are joined. Use the Add button if there is more than one
join key.
The following figure shows an example of creating a many to one relationship between CANDY_SALES_HISTORY and CANDY_CUSTOMERS. Use the Advanced Edit
button if the variables need additional modification for the join.
Use the Advanced Edit
button if the variables need additional modification for the join.
- In the Cardinality
drop-down list
6.3.3 Adding Custom Formats
Formats are useful when data needs to be sorted in a custom order, grouped differently, or contains values that are not readily understood by the business. Formats can be created either using Base SAS software or using the Create Format task in SAS Enterprise Guide.
Another example
is available in Chapter 7, “SAS Web Report Studio” that demonstrates setting
custom sort orders.
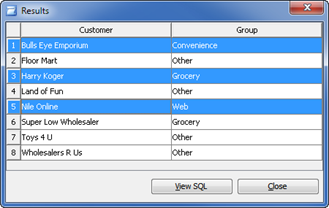
In this example, the report authors have requested that a Group data item that categorizes customers, (for instance, convenience or grocery) based on the company name. Instead of creating a new column in the data table for the grouping, apply a user-defined format to an existing variable to create the new variable. When changes need to be made, simply update the format and automatically have the changes applied to your data.
When you create a format, make it available to all of the SAS BI clients by saving it to the Format catalog. The Format catalog is stored in the following default location in the SAS configuration directory:
<configuration directory>Lev1SASAppSASEnvironmentSASFormatsformats.sas7bcat |
Use the following steps to create a custom format for the Customer variable.
- Create the custom format called $CUST_GRPS and save it to the Formats catalog.
The following program is an example format added to the Format catalog. For more information about the Format procedure refer to the SAS software documentation at support.sas.com./*=================================================================== */ /*Establish connection to the default Format catalog */ libname FMTS '<configuration directory>Lev1SASAppSASEnvironmentSASFormats'; /*Create the format and assigned to the FMTS library*/ PROC FORMAT lib=FMTS; value $cust_grps "Bulls Eye Emporium" = "Convenience" "Harry Koger" = "Grocery" "Super Low Wholesaler" = "Grocery" "Nile Online" = "Web" other = "Other"; RUN; /*==================================================================== */ - Open the information map where you want to add the variable.
- Right-click the data item and select Copy from the pop-up menu. In the
following figure, the Customer data item is copied.

- Paste the data item. Then right-click the data item and select Properties from the pop-up menu.
- In the Definition tab, rename the data item. For this example, the data item is renamed to Group.
- In the Classifications tab, select User-defined from the Format type drop-down list. All of the user-defined formats appear.
- Select the newly created $CUST_GRPS format.

- When you test the information map, the new data item called Group has the
custom format applied.
6.4 Tips and Tricks
Prompts and stored processes greatly enhance your flexibility and power when creating information maps. The following tips and tricks provide suggestions for integrating these tools as you develop your information map.
6.4.1 Building Cascading Prompts
For long lists of data, such as all the employees in a large organization, scrolling through the values in a single prompt can be frustrating to users. Creating an initial prompt, such as department, that drives what values appear in the second prompt, and that lists only employees in that department, is what cascading prompts (also called smart lists) are about.
In this example, you are creating a cascading prompt for the region and customer data items. When the report author selects the region, only the customers within that region are available for selection. The basic steps for creating filters and prompts are shown in Section 6.2.3, “Defining Filters and Prompts.”
To create the cascading prompt, do the following:
- Create a new filter called RegionFilter that is based on the region data item.
- Create a new prompt called RegionPrompt that is based on the region data item filter.
Note that the method for populating this first prompt can be any of the available options; however, the remaining (cascading) prompts must be set at User selects values from a dynamic list. In the following figure, the chosen population method is set to use a static list for the first prompt because the three regions (Central, East, and West) rarely change.
- Create the next filter and select Prompt
user for value(s) and then New to create the second prompt.
Give the filter a name that helps you and users identify its purpose later.
- As you create the prompt for the customer, ensure that the RegionCascadingPrompt prompt uses the method User
selects values from a dynamic list and the data item is the
data item you want available. In this example, Customer is the data item.

- After creating the prompt, the Edit Filter window appears. Use this window
to set up the combination filter.
- Select the Combinations button to expand the Filter combinations area if it is not already expanded.
- Select the Add
button to move the new filter to the Filter
combinations area. Notice the filter combination Customer = (&RegionCascadingPrompt) indicates how the Customer data item is filtered.

- The other part of the combination filter is the Region prompt. Modify the data item selection to Region and change the Value(s) area to point to the &RegionPrompt prompt. Click the Add button.
- Within the Filter Combinations area, select the Region= row and use the up arrow button beneath the field to move the Region to the top. Region should appear first, as shown in the following figure.
- Check the Establish
dependencies between prompts check box. This ensures that the
filters are used together.

- Test the cascading filter using the Test Results menu item. Refer to Section 6.2.4, “Testing the Information Map,” for detailed steps.
When testing the new prompts in SAS Information Map Studio, the second prompt values populate with options after the first prompt value is selected. In the following figure, four data items are selected: Order Year, Region, Customer, and Sales. The test feature allows only one prompted filter to be tested at a time. Make sure you select the cascading filter called RegionCascadingFilter.As you can see, the Prompt Value Specification window shows the new cascading filter in action. For the East region, there are only three customers available. The Results window shows the sales summarized for the Toys4U customer in the East region.

6.4.2 Using Shared Prompts
Prompts can be shared using SAS Management Console so they are reusable between multiple information maps. There are several requirements for your map to use a shared prompt successfully.
- The prompt must require a value. Select the Requires a non-blank value
check box when creating the shared prompt.

Figure 6.4-1 Shared prompts options
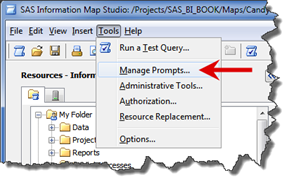
Once this requirement has been met, the shared prompt is available from the Tools > Manage Prompts menu. Use the Add Shared button to make the prompt available to your map.

Figure 6.4-2 Adding shared prompts
6.4.2.1 Limitations of Accessing Shared Prompts
There are several situations where shared prompts cannot be directly used in the manner described in the previous section. These constraints can be worked around by setting up prompts in stored processes and adding the stored process to the information map. Refer to Section 6.4.5, “Integrating SAS Stored Processes” for more information.
- Information maps cannot directly use shared prompt groups.
- The following prompt types cannot be shared and used by information
maps.
- Color
- Data Source
- Data Source Item
- File or Directory
- Data library
- Text
Note: SAS Information Map Studio does support single-line text prompts that are shared.
- Shared prompts cannot include dependencies. This means that one prompt cannot have values populated based on another prompt selection.
6.4.3 Allowing Value-Generation for Prompts
Within SAS Web Report Studio, report writers can create filters and prompts to use within their specific reports. To improve the information map usability, allow data items to generate value lists for the filters.
To change the Value-Generation Method option for each data item, click the data item and select Properties. In the Value-Generation Method pane, select one of the three methods.
In the following example, the Customer data item allows a dynamic list. This makes sense because the customer list changes over time as new customers are added. Use a static list when data does not change (or at least it does not change often), such as the list of states for the United States, or the environment names (Development, Test, Production). This reduces the amount of time each prompt takes to appear in the report.

Figure 6.4-3 Allow Value-Generation prompts
Review each data item to determine the ones you would expect report author to create in filters; for example, region, company, and product are likely categories for filters. Report authors are less likely to use non-categorical data items, such as street address and order date, for filters; those data items would not require this option.
6.4.4 Using CASE Statements
The final code that is run against the data table is SQL based, which means that you can also create custom data elements that use CASE statements. This is similar to IF/THEN/ELSE logic used by programmers in the SAS DATA step.
CASE statements are useful when you want to generate totals based on the values of the data items. For the following example, a data item is created that has a value of 1 or 0 depending on the value of the Region column. The resulting report shows the total number of records within that particular region.
To create an expression that uses a CASE statement, do the following:
- Create a new data element.
- Add a name for the data item and select the Edit button within the Definition area.
- In the expression editor, type the CASE statement in the Expression Text area, as shown in the following figure.
Use the Functions tab to locate the CASE function example and click the Add to Expression button to place the sample text in the Expression Text field.
Navigate to the
data item in the Data Sources tab and select the Load Values button to display the
distinct data item values.

The following CASE statements use two conditions to create a counter.
|
Plain English |
CASE Statement |
|
If status equal Open and units are less than or equal to 10,000, then count as 1, else count as zero. |
CASE <<root.status>> when ‘Open’ AND <<root.Units>> <= 10000 THEN 1 ELSE 0 END |
|
If status equals Closed and Order Date is within the current month, then count as 1. If the ELSE statement is missing, the value is set to missing. |
CASE <<root.status>> when ‘Closed’ AND <<root.order_date>>=INTNX(month, today(), 0) THEN 1 END |
6.4.5 Integrating SAS Stored Processes
SAS Stored Processes can enhance information map capabilities. SAS Stored Processes are SAS programs that can be run on demand. Stored processes can perform a variety of tasks, such as generating data sets, building queries, and so on. Almost anything you can do in a SAS program, you can do with stored process. Refer to Chapter 3, ”SAS Stored Processes,” for more information about creating stored processes.
6.4.5.1 Including Stored Processes
To use a stored process with your information map, do the following:
- Create the stored process and set it to run in the logical workplace server.
- From SAS Information Map Studio, start a new information map and add at least one data source to the map.
- From the Resources - Application Servers area, click Show and select Stored processes.
- Double-click the stored process you want to add. The stored process is displayed in the Selected Resources area. In the following figure, the IMAP Group Prompt stored process was added. In this example, the stored process is used to refresh the sales data tables.

6.4.5.2 Using Stored Processes with Information Maps
Stored processes can perform a variety of tasks to make your information maps more powerful and automated. Examples of potential uses within an information map are:
- Connecting to a relational database management system (RDBMS)
The default access method to RDBMS is through the implicit Access Engine and a SAS library reference. However, when using certain SAS functions, the Access Engine is not equipped to translate into RDBMS native functions. This can cause the SAS server to retrieve all the records in the queried RDBMS data table and process everything in SASWORK. For small data tables or large server environments, this is usually not an issue. However, when working with extremely large tables or constrained SAS servers, it is necessary to build explicit RDBMS queries within SAS Stored Processes and use them within the information map. - Querying an OLAP cube to allow for prompting (prior to SAS 9.2)
In prior versions of SAS Business Intelligence, you were unable to use prompts with OLAP cubes. However, using a SAS Stored Process, you can then provide the results within the information map for report authors to surface data in SAS Web Report Studio. - Dynamically determining which tables are joined together by using prompts and a query within a stored process. This increases the available prompting options.
An example is shared prompt groups, which cannot be directly accessed in information maps. Multiline text, color, data source, and other prompt types are not available in information maps. To leverage these prompts, you must use a SAS Stored Process that has these associated prompts. Refer to Chapter 4, “The Prompting Framework,” for more information.
6.4.6 Sourcing Maps with OLAP Cubes
As mentioned in Section 6.2.1, “Selecting and Organizing the Data Sources,” you can use an OLAP cube as the source data for an information map. Adding an OLAP cube into the information map requires that you first select the OLAP type from the drop-down box in the Resources pane, as shown below.

Figure 6.4-4 OLAP cube as source
Prior to using any OLAP cube as a source for information maps and subsequent web reports, it is important to understand what this source format provides.
|
Pros |
Cons |
|
Drill into and expand tables and graphs |
Unable to use list data report object |
|
Drill into detail data from the report with no special coding |
Cannot link to OLAP source report from another web report |
|
Support ragged and unbalanced hierarchies |
Information maps can contain only a single cube |
|
Switch dimensions and measures with the Data Selection window |
Able to consume the shared prompt only with defined type as OLAP Member |
|
Synchronize report components to display a common drill state or have them remain independent |
Identity based filters are assigned at the cube and cannot be created within the information map |
6.4.7 Creating an Identity-Based Filter
When some records in the table should or should not be viewable to a select group of users, you might create different information maps to meet each group’s needs. However, when this number exceeds more than a couple, it makes sense to reduce duplication and create a single information map that uses information stored in the metadata server for each user to filter the data table to display a subset of records.
SAS Information Map Studio has six identity properties to assist with row-based filtering. These filters allow you to be as general or specific as desired. For example, use an Identity Group for all members of a group, like Sales Department, or assign security to a specific property, such as User ID, like Angela Hall. The following table describes the identity properties. Refer to Section 6.5.4, “Identity-Based Filter Properties,” for information on how these properties align to the User and Group information in SAS Management Console.
|
Properties Available |
Description |
Example |
|
SAS.PersonName |
User name as defined in SAS Management Console |
Angela Hall |
|
SAS.IdentityGroupName |
Group name as defined in SAS Management Console |
Note – This property is used only when a group login ID is accessing the information map. |
|
SAS.IdentityName |
User or group name as defined in SAS Management Console |
Angela Hall |
|
SAS.Userid |
Authenticated user ID |
Anhall |
|
SAS.IdentityGroups |
List of groups and roles in which the metadata user is a direct or indirect member |
Sales Team - East |
|
SAS.ExternalIdentity |
A site-specific external identifier |
AAL_Group, PSD_Community Note:Only the first value for external identities is returned for use in the filter. |
Table 6.4-1 Identity-based filters
In the following example, you are setting up an Identity Group filter for the Region data item. Each sales team should be able to see the customers and sales data only for their assigned region.
Note: This example uses relationship data tables and does not work for OLAP cube data.
Use the following steps to create a new identify-based filter:
- Either add a new data item to your relational data table or create a new
table with the user identities. This step requires modifications to the data
table. In the following figure, a Role data item was added. Role is based on
the values in Region. Each sales team is added to the region they represent.
Note: These groups must also be set up in SAS Management Console. Refer to Section 6.5.4, “Identity-Based Filter Properties,” for more information about the groups.
- Open the information map and add the new data table. In this example,
the data table is called CANDY_SALES_TEAM_ROLES. Go to the Relationships tab
and join the new data table to the appropriate data table. In this example,
Region is the common data item.
It is not necessary to add any of the data items in the CANDY_SALES_TEAM_ROLES to the information map.
- Create a new filter in your information map. In the Edit Filter window, do
the following:
- In the Filter name field, type the name, such as IdentityFilter.
- For the data item, select Edit Data Item to open the Edit Expression window.
- In the Type
drop-down list, select Character.
In the Data Sources
tab, expand Physical
Data and add Role to the Expression
Text field as shown in the following figure.

- In the Value(s) field, select Derive identity values (for row-level permissions).
- Click on the identity property you want. Because this filter is at the group level, the SAS.IdentityGroups property is selected.
- Click the Hide
from user check box so the report author cannot see or make
changes to the filter. This also completely secures the information map.

- Go to the Properties
tab for the information map and add the newly created Identity filter as a prefilter,
as shown in the following figure. Also, add the CANDY_SALES_TEAM_ROLES table to
the Required Tables.
Refer to Section 6.3.1, “Setting Up Prefilters,” for more information about
creating a prefilter.

- Run a test query.
The following figure shows the information map being used in SAS Web Report Studio with different permissions. SAS User is a member of the East and West sales teams, and SAS Demo User is a member of only the Central sales team.
6.4.8 Repairing Broken Information Maps
Use the Resource Replacement feature to update an information map when changes occur. SAS Information Map Studio alerts you immediately about issues. Upon opening the broken information map, the following error message appears, indicating there are unresolved resources.

Figure 6.4-5 Unresolved resources error message
If the data
source itself changes (such as the physical folder is deleted), the error
occurs when you test the map or a user tries to use the information map.
When you view the information map, red Xs appear with the data resources and data tables, indicating where the issues exist. For instance, in the following figure, three source tables, Customers, OrderDetails, and ProductLines, have unresolved resources. The Orders and Payments tables are correct. Also notice that individual data items in the Information Map Contents area are affected.

Figure 6.4-6 Information map with issues
To replace the resources with valid ones, do the following.
- Select Tools
> Resource Replacement.

- When the Resource Replacement window appears, red exclamation points
guide you to the areas where the issue exists. In the following figure, the Tables and Columns need attention.
Select each red exclamation point area to display the broken resource. Indicate a replacement library or table and then use the drop-down list to select the new resource. In the following figure, the Customers data source was causing the issue
because the data source was renamed to Customer.
After selecting the replacement table, the red exclamation point is removed automatically because the columns are the same in this example.

This technique works extremely well when metadata changes, but you can also use it when you want to modify the information map source tables. Using the Replacement Resource feature ensures that the resulting report, such as in SAS Add-In for Microsoft Office or SAS Web Report Studio, continues to work without recreating the entire report.
6.5 SAS Administrator Tasks
Using SAS Management Console, the SAS administrator can set responsibilities, establish folder structures, and define user properties.
6.5.1 Roles and Responsibilities
There are at least two roles for information maps:
- Users of information maps require ReadMetadata access to the folders where the information maps are stored.
- Developers of information maps must have WriteMemberMetadata and WriteMetadata
access to the location within SAS
Folders to save, share, and edit. In the following figure, a
group called IMAP Developers was established and given access to the InfoMaps folder.

Figure 6.5-1 Information map permissions
6.5.2 Organizing Metadata Folder Structure
You should provide separate metadata folders for the data, information maps, stored processes, and prompts. These separate folders can exist within parent folders for each organization, project, or environment.
In the Candy Company, the organization has structured the folder as represented in the following figure. Information maps are stored separately from reports or stored processes. This allows security settings for different user communities.

Figure 6.5-2 Metadata folder structure for information maps
6.5.3 Sharing Optional Prompts
For shared prompts to be available in information maps, they are required to have a value (using the Requires a non-blank value option). But if the prompts need to be optional for the user community, some users would rebuild the prompt for each information map that uses it. You can share prompts and include a built-in option to select all values within the prompt.
To make a shared prompt optional, do the following:
- Within SAS Management Console, create a Prompt Manager stored process and create a new prompt. Refer to Chapter 4, “The Prompting Framework,” for more details.
- Move to the Prompt
Type and Values tab. In the Include Special Values area, select the
All possible values
check box. The following figure shows the check box when dynamic or static is
selected.

- Now after sharing the prompt, add it to the information map by clicking Tools > Manage Prompts.
- Then select the Add
Shared button, navigate to the shared prompt, and add it to the information map.

The All possible values option is not compatible with cascading filters because cascading filters require a value to subset the subsequent prompts.
6.5.4 Identity-Based Filter Properties
Creating identity-based filters requires an understanding of where the identity properties are defined. They are defined solely in the User Manager plug-in for SAS Management Console. From the User Manager, right-click the user and select Properties from the pop-up menu.

Figure 6.5-3 SAS Demo User Properties
|
1 |
General |
Shows the Name (SAS.PersonName) and Display Name (SAS.IdentityName) |
|
2 |
Group and Roles |
Lists all of the groups and roles (SAS.IdentityGroups) |
|
3 |
Accounts |
Defines the User ID (SAS.UserId) |