

Chapter 2
SAS Enterprise Guide
Using a Favorite Tool in a New Way
2.1 Getting Started
2.1.1 Quick Tour
2.1.2 Prerequisites
2.2 SAS Enterprise Guide on the SAS Intelligence Platform
2.2.1 Connecting to the SAS Metadata Server
2.2.2 Creating New Metadata Libraries
2.2.3 Updating Library Metadata
2.3 Opening SAS Information Maps and OLAP Cubes
2.3.1 Opening a SAS Information Map
2.3.2 Filtering the Information Map
2.3.3 Working with OLAP Cube Explorer
2.4 Using Project Prompting
2.4.1 Viewing Prompts
2.4.2 Applying a Prompt to Your Query
2.5 Using SAS Stored Processes
2.5.1 Running a SAS Stored Process
2.5.2 Working with Stored Processes
2.6 Tips and Tricks
2.6.1 Customizing Styles
2.6.2 Publishing Data and Results
2.6.3 Choosing Where to Run Your Program
2.7 SAS Administrator Tasks
2.7.1 Roles and Responsibilities
2.7.2 Setting a Default Server-Side File Folder
2.7.3 Establishing a Publication Channel
Chapter 2
SAS Enterprise Guide
Using a Favorite Tool in a New Way
SAS Enterprise Guide is a Windows application that provides a point-and-click desktop interface to SAS. It communicates with SAS software to access data, perform analysis, and generate results (such as graphics, PDF files, and HTML files). From SAS Enterprise Guide you can access and analyze many data types, such as SAS data sets, Microsoft Excel spreadsheets, and third-party databases. You can either use SAS tasks or write your own SAS code to perform your analysis. This application helps you produce results easily, regardless of your knowledge of SAS software.
Depending on how your environment is structured, you can use SAS Enterprise Guide to extract, transform, and report on data all from within the same application. Because SAS Enterprise Guide allows you to run code, you can build information maps and OLAP cubes as well as create prompts and stored processes. This chapter focuses on how SAS Enterprise Guide is used with SAS Business Intelligence.
To learn more about SAS Enterprise Guide, see support.sas.com for documentation, training, and other reference material. Also note that the SAS Enterprise Guide online help is an excellent reference.
2.1 Getting Started
Here is a quick view of the tool and some suggestions for what you need to use the examples in this chapter.
2.1.1 Quick
When you open SAS Enterprise Guide, the application window appears.

Figure 2.1-1 SAS Enterprise Guide quick tour
1 |
The menu bar and toolbars allow you to access the SAS Enterprise Guide functions. |
2 |
The Project Tree pane shows the project that you have open. SAS Enterprise Guide uses projects to manage each collection of related data, tasks, code, and results. With projects, you can run multiple tasks on the same group of data files, and you can save a project to run later or to schedule to run in batch mode. |
3 |
The Resources pane enables you to access the Task list, SAS folders, Server list, and the Prompt Manager. By default, the Resources pane displays the Server list. |
4 |
The Workspace displays your data, code, logs, task results, and process flows. |
2.1.2 Prerequisites
To complete the examples in this chapter, you need the following:
- SAS Enterprise Guide installed on your Windows desktop.
- Authorization to access the SAS Metadata Server. The SAS administrator is responsible for granting access and determining what privileges each user is given. Before you can access the SAS Business Intelligence environment, you need to contact the SAS administrator for the server location and the user information. In most situations, you can use your network user ID and password.
2.2 SAS Enterprise Guide on the SAS Intelligence Platform
When you connect to the SAS Intelligence Platform, you are connecting to a metadata environment, which contains definitions of the data you are allowed to access. This central metadata environment operates as a service on a remote server and includes definitions for objects such as users, workspace servers, and libraries.
After connecting to the SAS Metadata Server, one or more SAS Application Servers are available to run your SAS Enterprise Guide project and tasks. The application service waits for and fulfills requests from client applications for data or services. In a typical installation, two SAS Application Servers are available and are labeled as SASMeta and SASApp. SASMeta is recommended for use by administrators in managing the SAS Metadata Server. SAS Enterprise Guide users should select SASApp for all programs.
2.2.1 Connecting to the SAS Metadata Server
To connect to a SAS Metadata Server, you need to create a profile in SAS Enterprise Guide. The profile explains to the SAS Metadata Server who you are and what environment you want to access. While environments vary among organizations, consider the following example setup.
A separate environment is set up for development, test, and production. Each environment has a set of libraries and data defined, based on how the environment is being used. Some organizations might have several different production areas; one is used for the customer service data and the other has manufacturing data. The SAS administrator defines these environments in the SAS Metadata Server, along with who is allowed access to each.
Before connecting to the server, your identity and privileges are verified with the SAS Metadata Server. In the following figure, you can see an example of how your workstation connects to the remote server, where you can access the environment called Production.
Note: You can have multiple profiles defined, but you can connect to only one environment at a time. However, you can open multiple SAS Enterprise Guide instances on your machine to connect to different environments at once.

Figure 2.2-1 Connecting to a remote server
2.2.1.1 Viewing the Environment
When you have connected to a SAS Metadata Server environment, the Server List pane displays the libraries and files available to you, as shown in the following figure. Libraries are assigned or unassigned, which is denoted by color. Assigned libraries are identified with a yellow icon and unassigned libraries are identified with a white icon.
 Active server connections
are noted by a checkmark on the server icon.
Active server connections
are noted by a checkmark on the server icon.
Within each server, there are icons that you can select called Libraries and Files.

Figure 2.2-2
List of libraries
- Libraries are shortcut names for known directory locations. Libraries can contain SAS
data sets and can point to relational databases, such as Teradata and Oracle.
These are created with a LIBNAME statement in SAS code, using the SAS Enterprise Guide wizards or within SAS Management Console.
Double-click
unassigned libraries to assign them for immediate use. You must have
authorization to access the data.
- Files represent a shortcut into the directory structure on the computer where the SAS server is running. For example, if you want to open a Microsoft Excel file on a server that is defined in your repository, you use the Files node to locate and open the file.
You can point
the file shortcut to another location by changing the SASApp—Workspace Server
properties. See Section 2.7.2, “Setting a Default Server-Side File Folder,” for
more information.
When you connect to the remote environment, SAS assigns a temporary storage folder to you called WORK. This folder is active only while you are connected to the server. Once you disconnect, any information stored in this area is lost.
You can run code on different servers or even locally. See Section 2.6.3, “Choosing Where to Run Your Program.”
2.2.1.2 Creating Profiles
Before you can create a profile, you need to know the name or address of the environment and the required user information. Many organizations have configured the environment to use the network user ID and password. Your SAS administrator has specific instructions for completing a profile. You’ll notice that if a profile has already been created within SAS Add-In for Microsoft Office, it also appears in the Profiles list viewed from SAS Enterprise Guide.
To create the profile, do the following:
- Select Tools > Options. The Options window appears.
- Select Administration from the list. In the Administration panel, click the Modify button to
manage profiles. The Connections window appears.
The Connections window shows all of your profiles. When you are connected to an environment, the profile is active and a blue icon is displayed next to it. From the Connections window, you can create, modify, or delete profiles.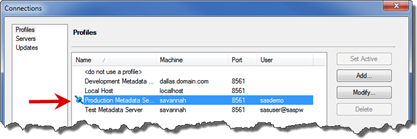
- Click the Add button to start a new profile. The Modify Profile window appears.
The following figure contains an example profile for a production environment.- The Name field contains the environment name, which is Production Metadata Server. This name is displayed in the Connections list.
- The Machine area indicates that this is a remote environment on savannah on port 8561.
- The User and Password field values are supplied. This login information is being saved with the profile. When starting SAS Enterprise Guide, the user supplies the password once. SAS Enterprise Guide stores the password and uses it behind the scenes to authenticate the user.
If the
organization security policy does not allow for stored passwords,
administrators can disable this functionality during the installation and
configuration of the SAS software.
- After completing the profile, click Save to return to the Connections window.
The new profile appears in the list. Click the Set Active button to start using the
environment.
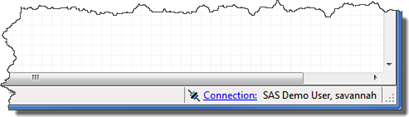
In the lower right
of the main window, you can see which remote environment is active. Click Connection to go
directly to the Connections window, where you can make modifications to or
change the active remote environment.
2.2.2 Creating New Metadata Libraries
If the SAS administrator has granted the necessary permissions, you can define libraries within the metadata so other users can also view and use the data. Before you start this process, you need to identify where the data can be stored within the server environment.
To create a new metadata library, do the following:
- Select Tools
> SAS Enterprise Guide Explorer from the menu bar to open the
SAS Enterprise Guide Explorer window. Select
File > New > Library from the menu bar to start the New
Library wizard. This wizard guides you through the process to create a library.

- In the first step, enter the name of the library and a description of
its contents. The name must be unique for each server on which the library is
created. In the following figure, CANDY is the common name for the library.
Click Next.

- The next step determines how the library is assigned.
- Specify the LIBREF for the library in uppercase letters. The LIBREF is used in a SAS program when you are defining a library. The LIBREF is a shortcut name for the library. A LIBREF is limited to 8 characters.
- You have three choices for assigning the library.
- Choose SAS Enterprise Guide to specify that SAS Enterprise Guide assign the library using the LIBNAME statement stored within the SAS Metadata server.
- Choose SAS Server to specify that the library is assigned in an autoexec file or through a METAAUTOINIT option. Use this choice when the library has already been assigned.
- Choose Metadata LIBNAME Engine to specify that the library is assigned using the metadata LIBNAME engine.
If you select the Show only tables with metadata definitions check box, then only tables that have metadata definitions appear when the library is selected in SAS Enterprise Guide.
The Allow tables to be created and deleted option specifies that you can read, update, delete, and create tables that have metadata definitions. You can also insert records, create columns, and change column properties on tables. Tables that you create cannot be read until they have been registered in metadata.

Select one or more servers from the list of available servers. A separate library is created on every server that you select. Click Next to continue.
In most
installations, SASApp is the only server instance that SAS Enterprise Guide
users can use. SASMeta has limited availability and is primarily used for
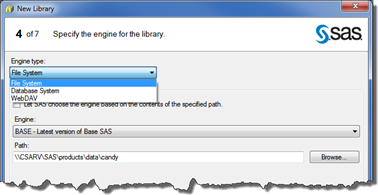
metadata management tasks by the SAS administrators. - You can choose to include a file system, database location, or WebDAV.
Select the engine type, engine, and the path. The CANDY library contains SAS data sets so the engine type is File System. You can also connect directly to a database system, such as Oracle or Teradata.Type the path of the physical location of the files or provide the database schema information.
- Specify options and option values for the library.
To enter an option name or value, click on a blank table cell and type the name or value.
A common option is AssignMode, which defines how the server creates the library and how users can interact with the data tables.
Value
Server
Behavior
0
SAS Enterprise Guide
Created within the SAS Enterprise Guide session and available only to that user during that session.
1
SAS Metadata Server
METAOUT=ALL enforces restrictions to prevent additions and modifications that would cause library metadata to become out of sync with the physical tables.
2
SAS Metadata Server
METAOUT=DATA makes it possible to add, modify, and delete tables within the library.
3
SAS Application Server
Pre-assigned data library that is available to all SAS BI clients.
4
SAS Metadata Server
METAOUT=DATAREG allows users to read, update, and delete tables that are already defined in the metadata.
- Use the folder tree to choose the folder that contains the library
definition. You can create new folders from the folder tree in SAS Enterprise
Guide Explorer or from the folder view in SAS Enterprise Guide. If you do not
select a folder, the library is created in the SAS Shared Data folder by
default. Click Next.

- Review the information entered in the wizard and click Finish to create the
library. In the following figure, you can see the library that was created. The
Candy library is listed in the SASApp server.

2.2.3 Updating Library Metadata
It is imperative that the metadata and data tables stay in sync with each other. If the data table has columns added, removed, or otherwise modified (including variable lengths, formats, etc.), the other BI clients that use the data tables can have issues when they try to use the data. For example, when the data table and metadata are out of sync because they have different information on what columns exist within the table, SAS Web Report Studio users see a JavaScript web error in the browser.
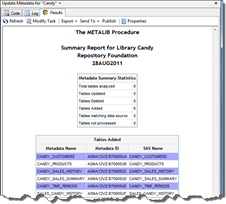
Use the Update Library Metadata utility to update the metadata from SAS Enterprise Guide. In this example, the Candy library created in the previous example has several data sets that are not registered. When you view the library in SAS Enterprise Guide, the Candy library appears empty, even though there are five data sets in the logical directory. In this example, you will learn to update the metadata library with the data sets.
- Select Tools
> Update Library Metadata from the menu bar. The Update
Library Metadata window appears.

- Select the server from the drop-down list. The list of available libraries depends on the server that you select. Select a library from the list
of available SAS libraries. Click Next to run a report or to update the metadata for the selected library.

- Select one of the following options and click Finish to run the
report or update the metadata.
When you make
changes to metadata library tables in SAS Enterprise Guide, you must manually
sync the changes with the metadata.
The first two options return a simple report on the metadata library contents. The last three options make modifications, updates, and deletions to the metadata library contents. These options allow you to make the changes to the tables depending on what you need to do.
Update and add table definitions in metadata repository with the actual tables and columns Adds and updates the metadata table definitions, including table columns, indexes, and keys, from the physical library to the metadata repository. Update only the existing table definitions in metadata with the current column information Updates the table definitions in the metadata repository for those tables in the physical library that have metadata.
Use this option when the physical library has tables you do not want added to the metadata repository or you have made changes to existing tables.Delete obsolete entries from the metadata library Deletes table from the metadata repository when the table no longer exists in the physical library.
For this example, you need to update the new Candy library with the physical library tables, which is option 3. When making changes, you might need to specify a user ID and password for an account that has sufficient privileges.
A report is generated that shows the Candy library had six tables added. The report lists the table names and some metadata table information.
 SAS Enterprise
Guide creates a task in your project tree for this action. You can rerun the
task as needed or add the code from the task to your program.
SAS Enterprise
Guide creates a task in your project tree for this action. You can rerun the
task as needed or add the code from the task to your program.
2.3 Opening SAS Information Maps and OLAP Cubes
Using SAS Enterprise Guide, you can open SAS Information Maps and OLAP cubes to use in your reports.
2.3.1 Opening a SAS Information Map
Information maps provide business users with a user-friendly way to query data and get results. An information map contains data items and filters, which you can use to build queries. You can use information maps from SAS Enterprise Guide, when the map is based on relational data tables. Information Maps built using OLAP cubes are not accessible by SAS Enterprise Guide.
In Chapter 6, “SAS
Information Map Studio,” you will learn how to create this SAS Information Map.
The following example demonstrates how to open the information map called Candy Customer Sales.
- You can access the information map by selecting File > Open > Information Map or from the Resources pane. Once you have opened an information map, the Open Information Map – Candy Customer Sales window appears.
- In the following figure, the available data items are on the left and
the selected variables are on the right. The selected variables are the ones
you want to import into SAS Enterprise Guide. In the Selected variables area, detailed information about each variable is shown.
To display predefined computed items, select the Display aggregated values (group by category) check box. If you select this option, then the inclusion of these items results in an aggregated data set that is summarized according to the information map definition, which displays the measure data items across the categorical data items.Aggregation is the process of grouping data using an operation that produces a statistic such as a sum, average, minimum, or maximum. If this option is cleared, detail data is displayed in the data set. Detail data is factual information that is not summarized (or is partially summarized) that pertains to a single area of interest, such as sales figures, inventory data, or human-resources data.

- Click OK to import all data from the information map into the Work library. The result
appears in the SAS Enterprise Guide work area. Click the Code tab to view the
code that imported the map, the log, or the data set.

2.3.2 Filtering the Information Map
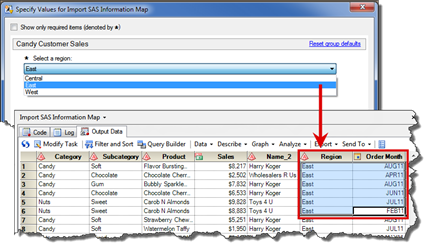
An information map can represent a large data set. After importing the data, you might realize that you wanted to work with only a certain period and region. You can filter the information map as you import it or after you have imported it.
The following example shows how to modify the task to add a filter:
- With the information map open in your work area, select Modify Task from the menu. The Open Information Map window appears.
Click on the Filters tab to make changes. This information map already has some filters available. Move the filter you want to use to the Selected Filters area and click OK. In the following figure, the Past12Months and RegionFilter filters were selected. The RegionFilter filter indicates that it has prompts available, which means you are asked to select a region before the information map generates. The Past12Months filter returns 12 months of data and does not require any user input.
- Because you selected RegionFilter, which includes a prompt, the region prompt
appears, as shown in the following figure.
You can use this data just as if it were any other SAS data set. You can join the information map with other maps or create reports from the data.
2.3.3 Working with OLAP Cube Explorer
OLAP Cube Explorer enables you to delve into OLAP cubes, add bookmarks for quick reference, add new measures, and highlight areas for further exploration.
OLAP Cube Explorer is similar to the OLAP Cube Viewer that is available in the SAS Add-In for Microsoft Office for Excel.
2.3.3.1 Opening an OLAP Cube
You can open an OLAP cube from the File menu by selecting Open > OLAP Cube and navigating to the folder where the OLAP cube is stored. The OLAP cube opens in the OLAP Cube Viewer window, as shown in the following figure. This example uses the FurnitureSales cube. In Chapter 5, “SAS OLAP Cube Studio,” you will learn more about OLAP cubes and how they are created.
The OLAP Cube Viewer opens to a cross-tabulation view and a graph. These items are linked so that when changes are made to one, the other is synchronized and the same changes are displayed. The right pane provides mechanisms to view data, add new measurements, add filters, and create conditional highlights.
You can right-click on many items for additional choices or to access a favorite task quickly.

Figure 2.3-1 OLAP Cube Viewer
It is easy to change which data is displayed. If you want to add an item, such as a measure, you can click the item in the Data Dimensions pane and select from the pop-up menu to add it to the column, the row, or as a slicer. You can also select data items already in the data table. In the following figure, the column has the Actual Sales measure and the row contains the Time shown by Year and All Products. If you wanted to view the sales by Regions instead of Products, click Products and then use the Replace With choice on the pop-up menu to change to Regions easily.

Figure 2.3-2 Change row values quickly from pop-up menu
With some practice, you can easily master the features available to create the views. For a more through explanation of the menu choices, refer to the SAS Online Help.
2.3.3.2 Setting an OLAP Cube Bookmark
As you work with the cubes, you might find that there are particular views that you find yourself creating often. You can create a bookmark that instantly changes the cube to the desired view. Bookmarks are stored within the SAS Enterprise Guide project. To retrieve these for later use, save the project and use it rather than reopening the OLAP cube from the File > Open menu. For instance, you might want to create a bookmark to view the same data by region, product, or year. In the following example, you want to have a view by region and product for the current year.
To create bookmarks, do the following:
- Arrange the columns and rows in the view you want. In the Control pane,
select the Bookmarks icon to display the Bookmarks pane. Then click the New Bookmark icon to
add the bookmark.

- In the Name field, type a name for the bookmark, and add a description. Click the Add button to save the bookmark.

The bookmark is added to the list. Later, if you want to change the bookmark, use the Manage button to delete, rename, or reorder the bookmarks.
To change the
initial default cube view, right-click the bookmark and select Make Default.
The bookmark is saved within the SAS Enterprise Guide project, not with the cube. To reuse these bookmarks, save the SAS Enterprise Guide project. When you reopen the project , the cube and bookmarks will be available.
2.3.3.3 Creating Custom Measures
As you analyze the data, you might realize that you need more measures. In the following figure, the OLAP cube shows the Predicted and Actual Sales for the past year. To determine how accurate the forecasts were for the year, you need to add a custom measurement that shows the percentage difference.
To create a custom measure, do the following:
- Click the second icon in the Control pane to display the Customized
Items and Sets panel. Then select New
> Calculated Measure, as shown in the following figure.

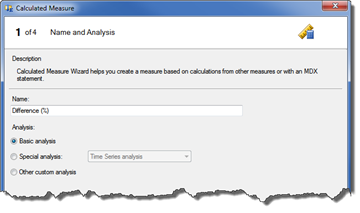
- The Calculated Measure wizard guides you through the steps. You can create the simple, special analysis, or measures with custom statements. For this example, provide a name and select Basic Analysis before continuing to the next window.
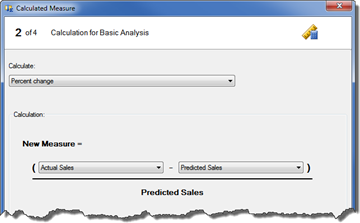
- In this step, you provide the measures that are actually used to calculate the new measure. In this example, Percent change is selected in the Calculate field. Then Actual Sales and Predicted Sales are chosen to complete the calculation.
- For the Other Options window, you need to select the format, who can see the measure, and the solve order.
- In the Format field, there are various formats available, based on your measure. Because this is a percentage value, the Percent format was selected.
- You can determine if the measure is available only to you or to
the general user base. If you set the option to Publicly, you cannot change the measure.
It is a good
practice to keep the measure locally at first. After you have tested the measure,
you can edit the measure to make it available to others.
- You do not need to make changes to the Solve Order field unless your measure is based on another calculated measure.

- The remaining window allows you to review your changes. If the measure is correct, then click Finish to create the measure.
The custom measure is added to your current view. In the following figure, you can see Difference (%) was added after the Actual Sales measure. The measure is also listed with the other measures in the pane on the right.
2.3.3.4 Adding Conditional Highlighting
With the conditional highlighting feature, you can set rules for the data display to see any trends or patterns that merit more attention. Conditional highlighting allows you to change the background color, add an icon to the table cell, or change the font. In the last topic, you created a new variable that shows the percentage difference between two measures. Using the conditional highlighting, you can turn the cell background to a different color if the difference in the values is more than 1%.
Do the following to add conditional highlighting to your displayed view.
- Click the fourth icon in the Control Panel to display the Conditional
Highlights panel. Then click the Add icon, as shown in the following figure.

- To add the conditional highlight, you first create the rule and then how you want it highlighted. In the Name field, you can change the name of the rule to be more descriptive. You can edit the Description field, but the application creates the description automatically based on your selections.
To create a rule for the Difference (%) measure, do the following:- Select Difference (%) from the Measure drop-down list.
- Click the By range radio button and select the Is greater than or equal to choice from the drop-down list.
- Type 0.01 in the field.
In the
Highlight panel, you can change the font color, background color, or add an
image. By default, any rule changes the background color. However, you can
choose to add an icon.
- Click OK to exit. The conditional highlight is added to your current view.
In the following figure, you can see the highlight is listed with the other measures in side panel. The Difference (%) column has a different background color and a checkmark to the left of all figures. This highlight quickly reveals that few areas exceeded the predicted sales.
As your skills progress, you will find other OLAP features helpful. You can learn more about these features from the SAS online documentation.
2.4 Using Project Prompting
A prompt is a way to ask the user a question. For example, “Which region do you want to see” or “Which months do you want to use.” These questions, or prompts, are asked before a report is generated or data query is created. You can create prompts to accept text strings, numbers (with range validation), single or multiple values from a predefined list of values, date or date-time values, and even variable names for use within SAS task roles. For detailed information about creating and using prompts, refer to Chapter 4, “The Prompting Framework.”
If you are familiar with programming in the SAS language, the prompts create macro variable to pass user-specified variables to the program.
2.4.1 Viewing Prompts
To view the prompts, open the Prompt Manager window by selecting it from the View menu. All existing prompts are listed within this window, as seen in the following figure. If any task is using the prompt, you can see the name in the Used By column.
In the following figure, the project has three prompts available: ProductPrompt, RegionPrompt, and YearPrompt. Two of the prompts are already used by two different processes. Those processes have a question mark with the icon to indicate that the prompt is used. You can add, edit, or delete prompts using the Prompt Manager.
In the following example, you will learn how the ProductPrompt was added to the Get Product task.

Figure 2.4-1 Prompt Manager area in SAS Enterprise Guide
2.4.2 Applying a Prompt to Your Query
You can easily add a prompt to a SAS program or task. In the following example, the ProductPrompt is added to the Get Product task. Get Product is based on the CANDY_SALES_SUMMARY data set and uses the Query Builder task.
To associate the prompt, do the following:
- Right-click CANDY_SALES_SUMMARY and select Query Builder from the pop-up menu. Add the fields you want in the data set.
- Click the Filter tab and select Product as the filter item. The ProductPrompt is based on the Product field in the CANDY_SALES_SUMMARY data set. The prompt allows the user to select one or more products. You need to know this information as you create your filter.
To add the filter with the prompt, do the following:- Select the operator, based on how the prompt is set up. Because this prompt allows more than one value, select In a list from the drop-down list.
- Click the check box Generate filter for a prompt value to ensure that the filter was created correctly. This will add a macro variable to the code.
- In the Value field, click the down arrow. Then select the desired prompt from the Prompts tab.

- Click Next to continue. In this window you can verify the prompt information. A special global macro called %_eg_WhereParam was added.

- Complete the Query Builder and run the task to test the process.
In the following figure, you can see an example of a prompt that can select more than one value or add a new value.
2.5 Using SAS Stored Processes
You can create and run stored processes from SAS Enterprise Guide. Any task that can be done from SAS Enterprise Guide can be made into a stored process. Stored processes provide a method to run a task repeatedly with different values. SAS Stored Processes can be shared with SAS Web Report Studio, SAS Add-In for Microsoft Office, or made available from an Web browser. When a stored process is run from a website, users do not need any SAS software installed on their computer to run or view the report.
Weekly reporting needs are common situations where a stored process is implemented. For example, you might create a report that details weekly product sales by region. This report shows the data from several viewpoints, perhaps a bar chart, a line plot, and some summary data. Your manager and others in your department ask for the report frequently. Each person who requests the report wants to see it for a specific region or product line and for the most recent sales data.
You can create this report once and turn it into a stored process. You can make this report available in different formats, perhaps as PDF or an HTML. Then the user can generate this report on demand, by region or product.
You can also create stored processes for parts of reports that you create frequently. For detailed information about creating SAS Stored Processes, refer to Chapter 3, “SAS Stored Processes.”
2.5.1 Running a SAS Stored Process
The following example demonstrates how to run a sample stored process called Shoe Sales by Region. This is one of the SAS sample stored processes provided with the standard installation.
- You can access the stored process from File > Open > Stored Process or from the Resources pane. In the following figure, you can see the sample stored processes.

- Right-click the stored process name and select Add to Project from the pop-up menu, or double-click the name to add it to your active project. The stored process appears in the Project Flow and in the Project Tree.
- To run the stored process, right-click it in the Project Tree or Project Flow area and select Run Sample: Shoe Sales by Region.
- When the stored process starts, you are prompted to select from the values that were predetermined by the stored process author.
- In this example, you are asked to select an ODS style, and you are given the option to display the SAS log. While these prompts are more general, you could also prompt a user to select a region, product, or even the output format.

2.5.2 Working with Stored Processes
Typically, a stored process generates results as a SAS Report and uses the default SAS Enterprise Guide style. To override the result format, styles and behavior, use the Properties window.
To change the result format, use the following example:
- Right-click the stored process name in the Project Tree or in the Process Flow and select Properties.
The Use preferences from Tools > Options option shows the default settings for this stored process. The other results options are disabled if this option is selected. For more information about creating your own style or changing the default style, see Section 2.6.1, “Customizing Styles.” - In the Result Format area, select the report format and the style you want to use.
There are five choices: SAS Report, HTML, PDF, RTF, or Graph Format. A suggested style is supplied for some of the result formats. For instance, the PDF result format generally produces a nice-looking report with the printer style. However, this recommendation should not prevent you from trying the various styles to find the one that works best for your report. Click OK after you have made your choice.
- You can view the report with the new option by right-clicking the stored process name and selecting Run <stored process name>, where stored process name is the name of the stored process.
2.6 Tips and Tricks
SAS Enterprise Guide allows you to control publishing to channels or change the look of your report.
2.6.1 Customizing Styles
In SAS Enterprise Guide, a style is used for the report output. You can think of a style as a template that controls the font size and color for headings, tables, and graphs. SAS Enterprise Guide ships with over 40 different styles available for immediate use. These styles create the extra spice in your reports. As you will learn in this section, you can also create your own styles.
2.6.1.1 Viewing the Available Styles
You can view the available styles by selecting Tools > Styles Manager. The Style Manager window appears (as shown in the following figure). From here you can review all the available styles. The default style for all reports has a bolded name and is displayed first.
Click a style name in the Style list to see a preview of the style. If you find a style you would like to use for all of your report, click the Set as Default button. The next time you generate a report, the newly selected style is used.

Figure 2.6-1 Set the default style in the Style Manager window
Some of the styles make better use of space than others. For instance, Plateau, Seaside, Meadow, and Journal produce more compact reports. When you need to display a lot of text, these styles work nicely. A style that has almost no formatting is called Minimal. You might want to use this as a template for building other styles.
2.6.1.2 Modifying Styles
You can change the look of your HTML or SAS Report output by modifying and creating styles. Styles are based on cascading style sheets (CSS) and are a set of specifications that control what your HTML or SAS Report output looks like.
You can change the default fonts, control spacing, add images, or simply change the colors. In the following example, you will learn how to modify a report so the headings are larger, and how to add an image to the top of the report.
To modify a style, do the following:
- From the Style Manager window, select the Normal style and click the Create a Copy button.
- In the Save Style As window, type Normal_2.css in the File name field and click Save.
Normal_2 appears in the Style list with a different icon and a location of My Style. Now you can easily identify styles you have created.
- Select Normal_2 and click the Edit button to display the Style Editor window.
- To change the heading, make the following choices in the Text panel:
- Click the words SAS System Title in the Elements area or select it from the Selected element list.
- In the Text size drop-down list, select 18pt.
- In the Text style drop-down list, select Bold Italic.
- In the Horizontal alignment drop-down list, select Left.
You can apply these changes to other styles by using the Apply to Other Elements button. If you make a change you do not like, click the Undo Apply button to return those styles to their original setting.
- You can use GIF or JPG formatted images for the banner or background image. The banner image is displayed across the top of the page and the background image is displayed on the entire page.
To add a banner image, make the following changes in the Images pane:- Select the Use a banner image check box.
- Click Select to specify the image that you want to use. In the Open Image window, double-click on the image file that you want to use.
- Click Open. The image that you select appears as a banner in the preview window.
Notes:
- If your report is shared with others, the image needs to be in a location that others have permission to see.
- You can also type an URL of an image that is available on the web.
- The default banner size is 471x72 pixels. Your image should be sized to fit this area.
- Click OK to save the changes and return to the Style Manager.
The style is available only for your local SAS Enterprise Guide installation.
2.6.2 Publishing Data and Results
SAS Enterprise Guide enables you to publish data and task results to predefined channels, which function as repositories to which users subscribe. Any information that is published to a channel is delivered to all of that channel’s subscribers through e-mail, the SAS Information Delivery Portal, or some other method. You must be connected to a server to publish data and results. The publication channels are defined on the SAS Metadata Server that you connect to using your profile. You might need to change your profile to publish content.
There are two types of subscribers to these channels.
- A content subscriber is a subscriber who is configured to receive packages, which is a bundle of one or more information entities such as SAS data sets, SAS catalogs, or almost any other type of digital content.
- An event subscriber is a subscriber who is configured to receive events, which are well-formed XML documents that can be published to an HTTP server, a message queue, or a channel that has event subscribers defined for it.
The SAS administrator must establish the publication channels and add the subscribers. Refer to Section 2.7.3, “Establishing a Publication Channel,” for more information about setting up the channel on the SAS Metadata Server.
To publish content to a channel, do the following:
- To publish a SAS Report, right-click the SAS Report that you want topublish in the Project Tree or in the Process Flow, and select Publish. The Publish to the Enterprise wizard opens.
- Enter a name and description in the fields. If you want the report to be available for a limited time only, then specify an expiration date, as shown in the following figure.

- Specify the server where this package is stored. Click Next.

- Specify the channel you want to use. Click Next.

- Ensure that you have selected your report. Click Finish to publish the report. You can add other documents to the publishing package using the Add Item button. For instance, you might want to include additional documents that contain relevantor supporting information, as shown in the following figure. An Excel file and a PDF file have been included in the package.

After the package is published to the channel, it can be accessed from the SAS Information Delivery Portal from the Collection portlets. The following figure shows how the package looks from within the portlet. When the user clicks on the package, a new SAS Portal page is opened and the user can see all of the items.

2.6.3 Choosing Where to Run Your Program
When you have connected to the remote environment, any new projects you create automatically use that environment to run the programs. If your installation of SAS Enterprise Guide has been set up to access SAS software on more than one server, then you can easily change where code runs.
Sometimes when the server is busy or you are working with smaller data sets, it might be quicker to run the tasks locally. However, when running locally, you have access only to the data on your local machine.
To change the server and run your code, do the following:
- Select Code > Select Server from the menu bar.
- In the Select Server window, click the server you want to use and click OK.
- To run your code, select Code > Run program-name On server-name. In the following figure, the program is assigned to SASApp, but you could also assign it to the local server by clicking on it. Remember that SASMeta is recommended for use by administrators in managing the SAS Metadata Server. SAS Enterprise Guide users should select SASApp for all programs.

If you want to use another server later, repeat this process and select that server.
2.7 SAS Administrator Tasks
Using SAS Management Console, the SAS administrator can set responsibilities and make system-wide changes that assist all SAS Enterprise Guide users.
2.7.1 Roles and Responsibilities
Within SAS Management Console, SAS administrators grant access to the servers based on the following four roles. Each of these roles provides various user capabilities and offers a framework for distributing access based on user type.
| Role | Capability Overview |
|---|---|
| Advanced | Provides all capabilities in SAS Enterprise Guide. |
| OLAP | Allows user to view OLAP cubes. |
| Analysis | Provides basic data analysis, reporting, and other capabilities. |
| Programming | Provides SAS programming, stored process authoring, and other capabilities. |

Figure 2.7-1 SAS Enterprise Guide roles from SAS Management Console
If any role requires modification, the SAS administrator should create a new role and select appropriate items on the Capabilities tab found within the Roles Properties window, as seen in the following figure. If you are adding capabilities, it is often easier to add the original role to the Contributing Roles tab.

2.7.2 Setting a Default Server-Side File Folder
Server files can be accessed directly through the Files folder, which is viewable from the Server List window. SAS Enterprise Guide users can quickly access and store files on unfamiliar platforms, such as a Windows user accessing a UNIX platform.

Figure 2.7-3 Files from the SAS Enterprise Guide Server List
The SAS administrator can modify where the Files folder points on the server environment by modifying the Workspace Server properties in SAS Management Console and restarting the object spawner.
- In SAS Management Console, choose Properties on the SASApp – Workspace Server.
- On the Options tab, click the Advanced
Options button and choose one of the following options:
Type Definition Example SAS User Root Uses the SAS user root directory (or –SASUSER) C:Documents and SettingsanhallMy DocumentsMy SAS Files9.2 System Root Uses the system root directory. Path Uses the specified location defined within this field. C: emp - Save your changes and restart the SAS object spawner service.
2.7.3 Establishing a Publication Channel
To add channels or subscribers, the WriteMemberMetadata permission is required on the relevant parent folder.
You can create SAS publication channels based on topics (3rd Quarter Results), organization (Business Unit X), user audience (new product release), or any other category. Once defined, authorized users can subscribe to the channels and automatically receive information whenever it is published.
Note: To publish to a channel, the publisher must have Write permission to the channel. You can modify an existing channel to change the permissions for a user through the Authorization tab.
This following example shows how to create a Sales channel to distribute sales results for each product and each region. This channel distributes information to the sales organization, regional management teams, and others in the management team.
- Open SAS Management Console. On the Plug-ins tab, navigate to the Environment Management > Publishing Framework area.
- Right-click Channels and select New Channel from the pop-up menu, as shown in the following figure.

- In the next window, provide the channel name and other information that helps the users understand the contents or find it in a search.

- Click the Subscribers tab. There are two tabs in this window: Content and Event. There are two types of subscribers to these channels.
Add the subscribers to the desired method. In this example, the subscribers are added to the Content tab so they receive the information when a new package is available.
- When information is published, it should be retained. The following example uses a WebDAV location to store content. WebDAV is a file folder-structured location accessible from the web that maintains file- and folder-level
security.

- The next window shows the results and allows you to make changes. Click Finish to establish the channel. In the following figure, you can see the Sales channel is now available.
