
CHAPTER 3
Working Backward to Move Forward
We fail more often because we solve the wrong problem than because we get the wrong solution to the right problem.
— Russell L. Ackoff
In this chapter, we focus on the power of working backward, a different but complementary approach to the IWIK™ approach we discussed in the previous chapter to focus on the essential question. Whereas the IWIK approach takes a wide‐angle of working bottom‐up, from exploring an extensive list of IWIKs to uncover the essential question, working backward takes a top‐down approach. It allows you to start with the decision at hand and find the path back to the problem's conditions, to identify the minimum amount and scope of data and analyses that would enable you to make the decision. Starting with the impending decision and working backward also helps ensure that your decision‐making journey is data‐driven, purposeful, and action‐oriented.
Remember the story of Alice in Wonderland? The narrative arc involves a young girl named Alice falling down a rabbit hole and finding herself having to navigate a world of bizarre situations and characters. At one point in Lewis Carroll's 1865 story, our youthful protagonist finds herself at a fork in the road. Utterly confused, she asks the Cheshire Cat which path she should choose. “That depends a good deal on where you want to get to,” her feline consultant responds. “I don't much care where…,” says Alice, at which point the cat interjects, “Then it doesn't matter which way you go.” Alice adds, “… so long as I get somewhere.” “Oh, you're sure to do that,” the cat replies, “if you only walk long enough.”
You're probably asking yourself where this is all leading in the context of this book. Think of Alice as an analyst, consultant, or data scientist walking in the thick forest of data, trying to find some useful insights but unsure of where she hopes to arrive or what that “somewhere” might even look like.
It is common for business leaders to assert that they've got loads of data and to believe, therefore, that there must be some gems in it. And indeed, just like Alice, the analyst who walks long enough in the forest of data will inevitably find some interesting correlations or patterns. But without an end goal in mind, how much of that analysis will end up being truly relevant to what you're actually trying to achieve? Let's just say that a lot of luck would have to be involved. Of course, there is a slim chance that your stray expedition will lead to an unexpected gem, but unless you guide the process with intention, most of these exploratory journeys end up leading nowhere.
As we highlighted in the first two chapters, one of the most important steps in the Quantitative Intuition (QI)™ framework is the ability to focus on the essential question. Very often decision‐makers are uncertain or vague about what it is that they are looking for. We all appreciate the importance of understanding the problem, so why do we find it so difficult to frame it?
There are several possible answers to this question. First, thinking carefully about the problem and possible solutions is hard. It requires understanding the situation, having relevant acumen, and considering possible counterfactuals. Take physicians, for example, and consider the process they go through when a patient complains about chest pain. Of course, chest pain can be worrying, but it is actually not the patient's underlying problem: It is a symptom. Sometimes this kind of pain has a simple, easily remedied cause, but such a symptom could relate to many complex sets of conditions. Doctors rely on years of experience and education to assess and diagnose a patient's problem. They might administer some simple tests, ask questions, or order an EKG. The process of identifying the true cause can be difficult. It requires acumen, experience, and time.
In addition to the difficulty in identifying the problem, the process of defining the problem also involves risk. Embarking on a journey with no defined end is comforting because it means that you will almost certainly not fail by under‐delivering. Defining the problem, on the other hand, forces you to anticipate and define what failure will look like. Going back to the physician example, physicians know that when they make a diagnosis, they run the risk of being wrong. As they weigh that risk against their experience and the data they have, they might decide to delay the diagnosis by running more tests, asking more questions, or referring the patient to other specialists. This could lead to unnecessary testing, expense, and delay. In a business environment, decision‐makers might be vague about the problem for similar reasons, or simply because of the erroneous belief that the data itself will define the problem. This is, unfortunately, rarely the case.
This leads us to one of the biggest mistakes we have observed among many leaders in companies we have worked with: Do not expect the data to provide both the question and answer. It is your responsibility, as a decision‐maker, to define the problem. Then, if the data can provide sufficient evidence toward an answer, and if you are fortunate enough to have the right set of skills in the organization to appropriately mine the data for the answer, you may find a solution to the problem you previously defined so carefully. That brings us to the question of how we define that problem in the first place.
Defining the Problem
Working backward suggests that effective decision‐making actually starts from the end. What that means is that the decision or decisions at hand should inform and guide the steps we take to assessing the problem, understanding what information we need, challenging the data, synthesizing it, and determining what to do next. We begin with the decision in mind and then work backward to explore any questions that lead to that decision. It is important to emphasize that QI approach starts with a decision to be made (e.g., go/no‐go) not with the decision itself that a certain branch of the decision should be taken (e.g., we should launch the product), as that would lead to a forgone decision that does not merit a data‐driven journey.
The notion of working backward takes its cue from the 1985 Harvard Business Review article “backward market research,” written by Professor Alan R. Andreasen1 in the context of marketing research (see the call‐out box “Backward Market Research: HBR, Andreasen 1985”). The idea behind the backward market research approach is to start with the decision at hand and work backward from it to design the marketing research data collection and analysis. Since Andreasen's article, we've observed an ever more overwhelming firehose of data pointing at us, along with an increase in demand for fast‐paced decision‐making. Using the lens of the QI framework, in this chapter, we expand the backward approach beyond marketing research projects and toward more general data‐driven decision‐making, highlighting how it can be used for small and large decisions and combined with the IWIKs approach.
We propose three steps for backward decision‐making:
- Create a decision tree
- Write the blueprint of your delivery using IWIK
- Reverse engineer your data and analysis map
Step 1: Create a Decision Tree
Our QI framework focuses on decision‐making. Therefore, it is natural to think of the data‐driven journey not just ending with a decision, but also starting by scoping such a decision. Of course, at the start of the journey you don't know what the actual decision will be, nor do you want to influence the process or tilt the decision in a particular way. What you should know early on are the various possible actions that might be taken at the end of the journey given different outcomes. At this step you would want to scope out the possible branches of the decisions or action that might be taken given the outcome of the analysis. The process of scoping out the possible branches of the decision needs to be comprehensive and often includes discussions with key stakeholders about what possible actions are on the table at this point in time. Examples of such actions might be whether to go ahead and launch an entrepreneurial idea or to call the whole thing off, whether to expand a company into a new region, which of a set of market segments a particular company should target, or what price point a company should select for a new product.
Each possible action needs to have at least two branches: two options for decisions that can be made. If, through this process, you come to realize that there's actually only a single branch—that the decision to launch or expand has in fact already been made—then there's no reason to invest time and money in the analysis.
If you're very familiar with the market or industry, the set of possible decision branches might be obvious. In other cases, however, some legwork may be needed to establish what the different branches might be. You might have to talk to key stakeholders in the organization or the field, or with consumers.
Take, for example, segmentation studies. In our experience, the usual entry points for conducting segmentation studies to have a better view of our customers or to better understand the business are generally not good enough to spend time and money on data collection and analysis. Our advice when you're embarking on a data‐driven journey like a segmentation study is to behave like a child: to question incessantly and scrutinize shamelessly with a sequence of “why” questions. This advice should be familiar to you from Chapter 1. This childlike intuition also has strong practical foundations.
The Japanese inventor Sakichi Toyoda, who founded Toyota industries, argued that by asking why questions five times the nature of the problem as well as its solution, becomes clear. Applying five whys approach for example, to the context of the segmentation study you can ask:
- Q: Why do you want to conduct a segmentation study?
A: Because I want to know my customers better.
- Q: That's really great that you want to know your customers, but why do you want to know your customer better at this specific moment?
A: Well, our sales have been plateauing, so I am worried we are not serving our customers as well as we did before.
Notice that we are starting to define the problem with the sequence of whys.
- Q: Why do you think that is?
A: A new competitor entered our category, and I believe this competitor is addressing the needs of the younger segment of consumers better than we are.
Now we're moving toward an action‐based definition of how that project could move us forward, and away from a generic request for a segmentation study as something that would be nice to have, without knowing what questions it needs to answer.
With the knowledge we've derived from this sequence of “why” questions, we can redefine our segmentation study as focusing on questions that would guide specific decisions. For example, in the face of the new competition, should we shift our targeting strategy to alternative segments and away from younger consumers? Alternatively, should we identify aspects of our product that may be superior to that of the competitor's, and that may allow us to lure back the younger customers? Such lenses would lead to very different analyses and a much more action‐oriented project than the generic segmentation study originally requested.
In our experience, by the time you are done with your why questions and scoping out the branches of the decision, the problem may well be half solved.
Step 2: Write the Blueprint of Your Delivery Using IWIKs
The next step might seem controversial at first. It involves the decision‐makers working in tandem with the analysts to write the blueprint of the report. For some projects there may not be a report; instead, there might be an analysis plan and a recommendation system for a machine learning project, or a simple memo for a smaller decision. Either way, the idea is to work backward from a decision to the analysis and information needed to make that decision.
Working backward might seem, at first, like a daunting challenge. How can we write a delivery document for a data analysis journey before we've even collected a single piece of information? What might such a blueprint include? Blank tables? For the most part, that's correct: The blueprint will include what is often called “planned,” “dummy,” or “ghost” tables, and it will formulate a plan for the analyses intended to be done.
Imagine that you work for Apple and have the brilliant idea of introducing an iPhone that's specifically designed for teenagers. As part of the project, you already know any decision‐making about the feasibility of this idea will require a table describing the preference of teenagers at different age groups for the prototype iPhone you have in mind. The dummy table may look like Table 3.1.
The table has labels for the columns and rows but is otherwise unpopulated. There's no data yet. As you collect and analyze the data, you'll populate the table, but for now, in your report blueprint, you'll simply describe the tables and figures that you would need—and only those that you would need—to be able to make a decision at the end, assuming these tables and figures will be filled with reliable information. The purpose of this exercise is to make sure that the data collected and the analysis conducted will help you make the right decision at the end of the process.
TABLE 3.1 Interest in the proposed product by age
| Interest in the iPhone for teenagers | ||
|---|---|---|
| Age | Yes | No |
| 12–13 | ||
| 14–15 | ||
| 16–17 | ||
| 18–19 | ||
The simple act of considering how this table will be used to make decisions will enable you to refine your own thinking in terms of the decisions you should be making. For example, you will think through the scenario of the decision you would make if the results suggested that younger teenagers, but not their older counterparts, will be interested in the phone. This line of thinking might spark the idea of creating a separate table exploring who actually buys the product for the younger teenager, who makes the purchase decision, who pays for the product, and what other influences are at play.
Creating this blueprint before collecting the data has other advantages too. It helps ensure that you're communicating the granularity of the data and paying attention to necessary detail. In the iPhone example, it might help us inform the analyst that our definition of teenager is in the age range of 12 and 19. The dummy table (see Figure 3.1), in this sense, makes sure this information is delivered.
Much like IWIKs, the dummy tables are your global positioning system (GPS) to navigate your data journey. Without dummy tables or IWIKs, there's a risk that the data gathered will be a collection of whatever information is easily available—relevant or not—rather than a carefully curated slate of information that can actually help you make the decisions. Indeed, despite their differences—IWIKs (thinking bottom‐up) and backward thinking (thinking top‐down)—the two approaches both help focus on the essential question and are complementary. It is at the step of generating the dummy tables that you would employ the IWIKs method. IWIKs and the corresponding IWIKs Knowledge Matrix (see Figure 3.1) would help generate the set of dummy tables and figures that can answer the IWIKs in the top right corner of known/unknown and need to know matrix.
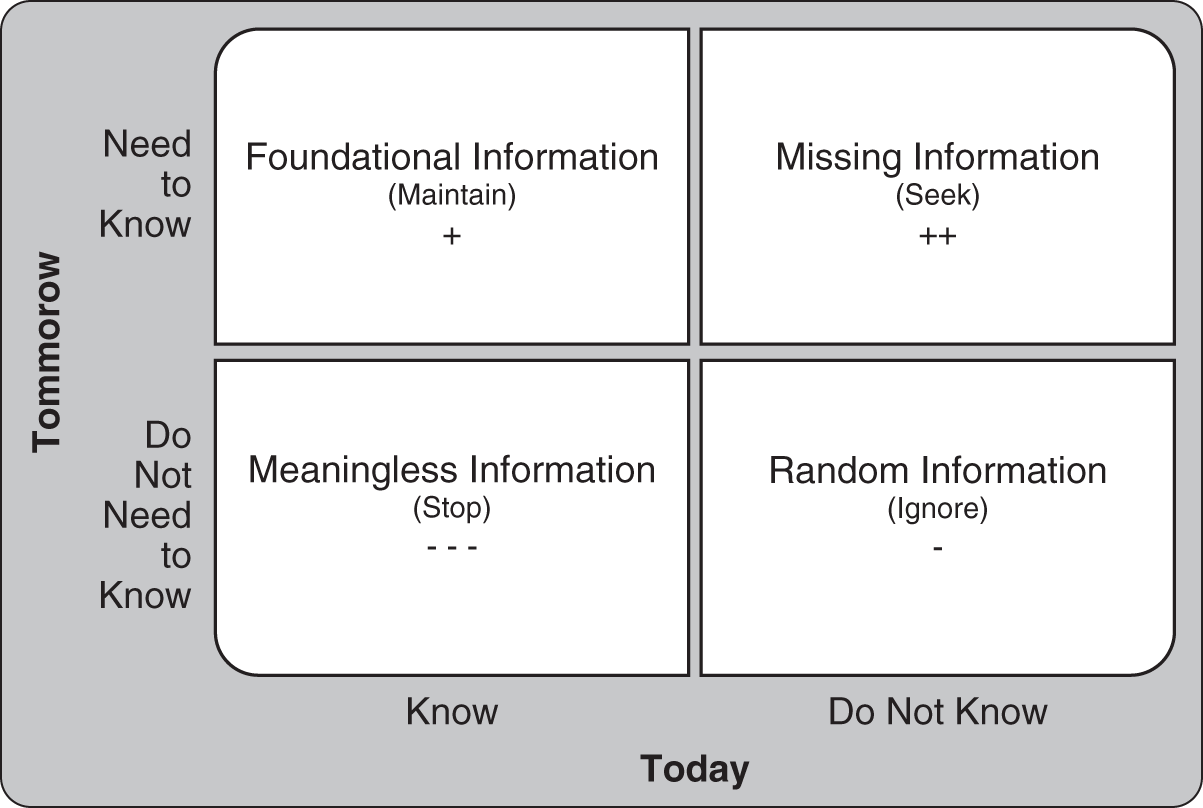
FIGURE 3.1 IWIK Knowledge Matrix
The dummy table will also serve as a useful tool for helping you to focus on what information is needed in order to complete the analysis. By the end of the analysis, the information in the table might not be perfect, but it will provide an inventory of sorts and provide clarity on where you're at and where you need to be. Taking the time to think through the blueprint of the delivery will make the final delivery faster, sharper, more concise, and therefore more efficient.
Decision‐makers often have a tendency to prefer being precisely wrong than vaguely right. Of course, no one intentionally prefers to be wrong, but in the trade‐off between certainty and relevance, we often tend to err on the side of certainty. In the quest for certainty, we often prefer to have precise and validated information even if this information is less relevant for the decision at hand over rough estimates in tables and figures that we actually need. Planning the blueprint of the delivery in advance helps you focus the effort on getting the most accurate, relevant, and necessary information for the analysis that you actually need to make the decision.
Step 3: Reverse Engineer Your Data and Analysis Map
The next step in the process of moving backward from decision to data analysis involves asking yourself what data you need to be able to fill in the dummy tables and figures. If we were to draw up a questionnaire to complete the preceding iPhone for teenagers dummy table, the questions would be straightforward: Are you interested in the proposed iPhone? and What is your age?
From here, the process follows the more traditional pattern of data‐driven decision‐making: assessing the available data, collecting necessary information, analyzing the data, and delivering the information. If sufficient effort and diligence was put in the first few steps, these subsequent steps should be easy. Indeed, Charles Kettering, the one‐time head of research at General Motors, is widely quoted as having said that “a problem well stated is a problem half solved.” In our own experience of making decisions using the backward approach, we found that once the first three steps of the backward approach are complete, the problem is indeed nearly solved.
Harnessing Inside of‐the‐Box Thinking
It's also been our experience that the backward approach can help researchers and decision‐makers avoid wasting time, energy, and money on work that will not directly improve the decision‐making process. Working backward can help executives to formulate actionable outcomes and develop appropriate contingency plans.
In fact, starting the process with a decision and a decision tree can even lead to the appropriate realization that a project should be pivoted or canceled entirely if, through the process, you realize that the decision is already clear.
While the backward approach is best suited for larger decisions, it can also be used for smaller decisions. Consider the typical performance tracking reports full of numbers and analysis that you probably receive on a daily, weekly, or monthly basis. The next time you receive such a report, look at each number and ask yourself: if that number were double or half of what it is today, would you do anything about it? If the answer is no, there's a good chance that this number is of no use to you, and you should ask to stop seeing this number in the reports delivered to you. This number is irrelevant, and it clutters and distracts your attention from figures that are meaningful and important. Of course, this doesn't mean that this particular number is not important for someone else in the organization, but it should only be shown to those decision‐makers who are likely to change their decision based on this number. Consider a car dashboard. Imagine if, rather than just flashing a warning light when the temperature is too high or the oil level is too low (a point at which you are required to take an action), it were to present you with all the information it draws on to reach the conclusion that something isn't quite right. That array of data would entirely overwhelm us, particularly because it would inevitably feature information that's entirely irrelevant to our decision‐making process. Our business dashboards should look more like our car dashboards, working backward from the decision that the decision‐maker needs to make, and clearly presenting the information ‐ and only the information ‐ that is relevant and useful, and at the appropriate granularity level, for our decision‐making.
Naturally, there are criticisms of the backward approach. One is that, by starting at the point of the decision and considering the branches of the decision tree, we might suffer from confirmation bias or blind spots, which can predispose us to miss certain branches that may reveal themselves throughout the process. Worse still, we might inadvertently influence the outcome of the decision. Indeed, the backward approach is an inside‐the‐box approach. It assumes that the decision‐maker has identified the possible branches of the decision early on. That being said, the process of identifying the branches of the decision can be elaborate and include exploratory analysis that can take a few weeks or, in rare cases, even months, to make sure the relevant set of possible branches has been explored.
To provide the opportunity for outside‐of‐the‐box insights, anyone taking the backward approach to decision‐making should also be conscious of incorporating into the process opportunities to uncover unexpected insights and to act on those. As we mention repeatedly in this book, nothing in the QI process has to be linear.
Finally, we tend to be obsessed with outside‐of‐the‐box thinking because of the risk of missing out on things we don't know we don't know. In our quest for the unknown, we often don't spend enough time finding answers for the things we know we don't know. But the reason we know we don't know the answers to these questions is often because they are on our critical path. Starting from the decisions you know need to be made, the backward approach maximizes the chance that the data‐driven journey will shed light on the answers to the questions you know you don't know.
With respect to influencing the decision‐making process, or confirmation bias, recall that by working backward we don't mean decide and then embark on the data‐driven journey, but rather scope a decision tree with at least two meaningful branches to decide between and then develop the analysis plan to allow you to make that decision. By identifying the possible branches of the decision, making sure that there are at least two of them, and, most importantly, making sure that everybody involved in the process understands that all branches are viable and that the objective of the project is to identify which path we should take, you can circumvent the risk of affecting the selection of the branch itself.
Taking the Road Less Traveled
From our extensive experience, despite its clear appeal the backward approach is not frequently employed in business decision‐making. Why not? One answer is lack of awareness of the approach and its benefits, which this book should help mitigate. Another answer involves effort and risk. The first two steps of the backward approach—outlining the possible branches of the decision and writing the blueprint of the report—require heavy involvement from top management early on in the process. Top management is always busy with fires to put out, and present bias leads us to believe that we will have much more time later on, when the report comes back, than we have now.
Another reason management may be unwilling to put the time and effort into clearly scoping out the project is the misguided belief that that's the job of an analyst or consultant. Particularly if, as a leader, I am paying a vendor or a consulting firm to run the analyses, why should I do their job and write the blueprint of the report for them? Similarly, the myopic vendor might be reluctant to push their client to be involved in the process, either because they want to avoid the client breathing down their neck or because of the perception that this is exactly their expertise and the reason they were hired in the first place. This combination nearly guarantees mediocrity and a project doomed to waste resources and end on the scrap pile.
Some might shun the backward approach because of risk aversion. This goes back to the scenario in Alice in Wonderland. Adopting the backward approach means deciding where you want to go, defining the impending decision, and determining the path to get there. By definition, this also means that we have outlined the measure of failure. The traditional forward approach provides some comfort and safety because with no decision to be made any insights uncovered can be counted as a win. If the forward approach eventually does not lead to any insights or a decision it is easy to blame the consultant or the analyst. Often, this feeling of risk is further amplified by the vagueness of the problem at the start of the process, although this vagueness, ironically, should be the main reason to invest time and effort early on to frame the problem and decision upfront.
One solution to the real‐ or perceived‐time management problem would be to consciously, and well in advance of the project, carve out time on top management calendars. We should use this time for top management to collaborate with the team that runs the project, to frame the essential question, understand the possible decisions, and start the process of creating the blueprint of the report. Do not underestimate the importance of close collaboration and input from the management team. Spending time early on will prevent the common outcome of ending up on a misguided data‐driven journey and discovering that you've wasted time and energy on the wrong thing. As for risk, by now it should be clear that the theme of QI is to give decision‐makers the comfort of combining human judgment with data and analytics to confidently make decisions under uncertainty.
Key Learnings ‐ Chapter 3
- Don't expect the data to provide both the questions and the answers. It is your responsibility to home in on the essential question and then combine data with intuition to attempt to identify the answers.
- Start with thinking about the decision at hand and work backward to scope out the needed data and analyses.
- When faced with a vague problem definition, use the five whys approach to identify the essential question or the impending decision.
- Understand that starting from a decision involves upfront time and risk, but it maximizes the chances for purposeful and effective data‐driven journeys.