
CHAPTER 10
Creating a Quantitative Intuition™ Culture
At the end of the day you bet on people, not on strategies.
— Lawrence Bossidy
Growing and building a team is one of the most essential leadership skills you can develop. As Walt Disney believed you can dream, create, design, and build the most wonderful place in the world but it requires people to make the dream a reality. Consider the great innovators and pioneers from Olive Ann Beech, Henry Ford, Katharine Graham, Steve Jobs, Bill Gates, Jeff Bezos, William Procter, Asa Candler, or Madam C.J. Walker. All were leaders who asserted a compelling vision that redefined or created new industries. In each case, they spent a considerable amount of time building teams to turn their vision into a reality.
Questions you may be asking yourself at this point, after equipping yourself with the Quantitative Intuition (QI)™ skills discussed in the previous chapters: How do I hire for QI? What are individual skills I should be looking for, and what is the ideal composition of the team?
Identifying top talent is the first hurdle. You then need to successfully recruit A‐list talent and/or subject matter experts. To further complicate the process, this task is often done under time constraints as you need to quickly fill a position. Finally, you need to create an environment where this top talent is motivated to work as a collective yet feel valued and recognized for their contribution. Essentially you are deciding whom you want to marry after a few dates and under an artificial environment. This makes hiring one of the hardest competencies to master, yet the most strategic because the impact on the business is significant when correctly done. A McKinsey study, “War for Talent,” quantified that superior talent is up to eight times more productive than lower quality talent, showing the relationship between quality of talent and business performance is dramatic.
In 2011, McKinsey & Company study asserted: “By 2018, the United States alone could face a shortage of 140,000 to 190,000 people with deep analytical skills.” This sense of urgency around the incoming shortage in analytics which began in 2010 has created a big push in the United States and the rest of the developed world's education system to focus on science, technology, engineering, and math (STEM). This has led to curriculum changes in high school and college education systems, and the opening of a host of data science and analytics graduate programs in many academic institutions. This, in turn, has created a flood of people with strong analytics backgrounds entering the workforce. If in the past people with these skills were primarily hired in the tech industry; we are now seeing more traditional industries like consumer packed goods, and B2B (business‐to‐business) organizations hiring data scientists and data engineers. Indeed, a decade after the 2011 McKinsey report, the World Economic Forum (WEF) in The Future of Jobs Report surveyed executives from more than 350 employers across nine industries in 15 of the world's largest economies and found the No. 1 position increasing in demand will be Data Analysts and Scientists, followed by AI, Machine Learning Specialists, and Big Data Specialists. The U.S. Bureau of Labor Statistics predicts that the data science field will grow 28% through 2026.
However, if across industries from tech to finance to education and consumer package goods firms are increasingly hiring data analysts and data scientists with deep analytical skills, what about the leadership in these firms? These leaders would make decisions leveraging the data and analytics produced by these new analytics hires. Indeed, the same 2011 McKinsey & Company study stated that by 2018 we would have a shortage of “1.5 million managers and analysts with the know‐how to use the analysis of Big Data to make effective decisions.” Thus, the shortage of managers to make decisions with analytics versus data scientists was predicted to be 10:1. This gap is exactly where QI plays an important role in filling this leadership gap by combining business acumen and intuition with data to make smarter and more confident decisions.
Recruiting for the Quantitative Intuition™ Skill Set
At the start of the book, we argued that you don't need to be a math whiz to make decisions with data or become a QI decision maker. However, this does not mean that there aren't important skills needed to become a QI team leader.
The typical tools—writing a job description, rounds of interviews, a series of discussions, candidate‐supplied references, and inconsistent questions across a range of interviewers—are necessary but not sufficient. You should consider adding alternate methods of interacting with candidates to uncover their intrinsic strengths, preferred ways of working, and whether they can think like QI decision maker. These alternative methods include exercises or nonstandard questions. Why? Leaders must bring answers that don't fit a formula. Reactivity, insight, and ingenuity are the needed attributes. Can you drive rapid growth and deal with ambiguity? Can you respond effectively to crisis situations? Agile decision‐making requires you to be a growth champion, truth teller, customer stewards, and insight creators. The person who can conceptualize the problem, define the situation, and ask smarter questions will outperform those relying on textbook answers. We can define these necessary skills using the three pillars of QI (see Prologue Figure P.1).
Precision questioning skills: This set of skills involves asking smart and precise questions. As discussed in Chapter 1, questions can be extremely powerful. A good QI leader is inquisitive and makes sure to understand the essential question before diving into the data or analytics. In hiring interviews, many interviewers focus on asking questions, testing the interviewee on their ability to excel in answering these questions. We encourage hiring managers to consider reversing this process and examine candidates' ability to ask good questions and quickly focus on the essential question. For example, the interviewer can pose to the candidate a real‐world situation and rather than ask them to analyze the situation or offer a solution, ask them what questions they would ask to help them better understand the situation.
Contextual analysis skills: These skills involve becoming a fierce interrogator of data. As discussed in Chapter 4, the focus in becoming a fierce interrogator of data is not to assess whether this or the other analysis tool was used to analyze the data or whether the right statistical procedure was used. These are important and common skills that people learn in statistics or data science courses and are often needed for data science and analyst roles. The focus here is on data contextualization. Ask: How does the data fit in the context of the company or the environment? What surprised you in that analysis? Or conduct a set of Fermi approximations (see Chapter 5). These are often included in management consulting type job interviews. These skills are at the heart of contextualizing data. To test for this skill, an interviewer could, for example, confront a candidate with a scenario involving some numerical figures and ask the candidate how they would assess if the number is in the right ballpark. The market sizing analysis for a farm‐stay in Guatemala that is discussed in Chapter 5 is a good example of such a scenario.
Synthesizing skills: This set of skills is extremely important and tends to be missing, particularly among junior employees. It is the ability to connect the dots and synthesize the information rather than merely summarizing the information and verbally reporting back the information presented in a table or a figure. This skill requires pouring judgment into the analysis of data. Unfortunately, this skill is rarely taught in any data analysis course. In an interview, the interviewer could present a table that describes a situation (e.g., Table 6.1 in Chapter 6) and ask the candidate what conclusions they would draw from the scenario. The key here is to examine whether the candidate gets stuck in a simple summary of “what?” is in the table, or do they take the extra step to also pour some judgment synthesize the information and discuss the “so what?” and “now what?” implications of the numbers. This pillar also involves delivery and storytelling skills that are discussed in Chapter 8. These skills are often easier to assess when asking candidates open‐ended questions during an interview. In listening to the candidate's response, interviewers should pay attention to communication skills, the use of story arcs, symbols, emotions, and understanding of the audience (often the interviewer) and what they are looking for.
Depending on their background and education, a person may be stronger in quantitative skills and weaker in intuition, or the other way around. Accordingly, different pillars and different skills of each pillar need to be emphasized. In our years of teaching QI to thousands of executives, we have seen decision‐makers seeking to acquire different QI skills. These tend to come from almost every industry and rank within the organization. For example, engineers or data scientists attending our QI workshops tend to have strong quantitative skills and focus on strengthening their intuition skills. These participants often ask: How do we make sure that we clarify and focus on the essential question before diving into the analysis? How do we work with top leadership to make sure they help us clarify the essential question? How do we interrogate data not from a statistical perspective, but a business perspective to make sure we deliver sound analysis. These quantitatively apt decision‐makers often struggle with how to deliver the information in an actionable manner so that top leadership can understand and act on the information.
Other participants often come with a strong sense of business intuition and seek to understand how to use data to make better decisions. These participants often dread the analytical aspects of data‐driven decision‐making. The realization that the skills needed to become a QI decision‐maker rarely involve analytical skills per se is a big relief. This type of decision‐makers benefit from learning how to leverage their strong business knowledge and intuition to put the data in the context of the business and make sure that the data is useful for their decision‐making. They also learn the importance of maintaining close collaboration with the analytics team, particularly at the step of problem definition and the synthesis of the information to make sure the analysis is actionable.
One exercise to use during the hiring process is to ask the candidate to build a business. If money were not any object, what business would you start? What is the first role you would hire for? How would you structure their team? How would you define success? How would you ensure customer satisfaction? How would you approach building their product? The type of business is not relevant. Again, you are looking to identify the candidate's strengths. Their answers will start to reveal where they naturally gravitate. Do they focus on operations or marketing? Do they want to lead a large or small team?
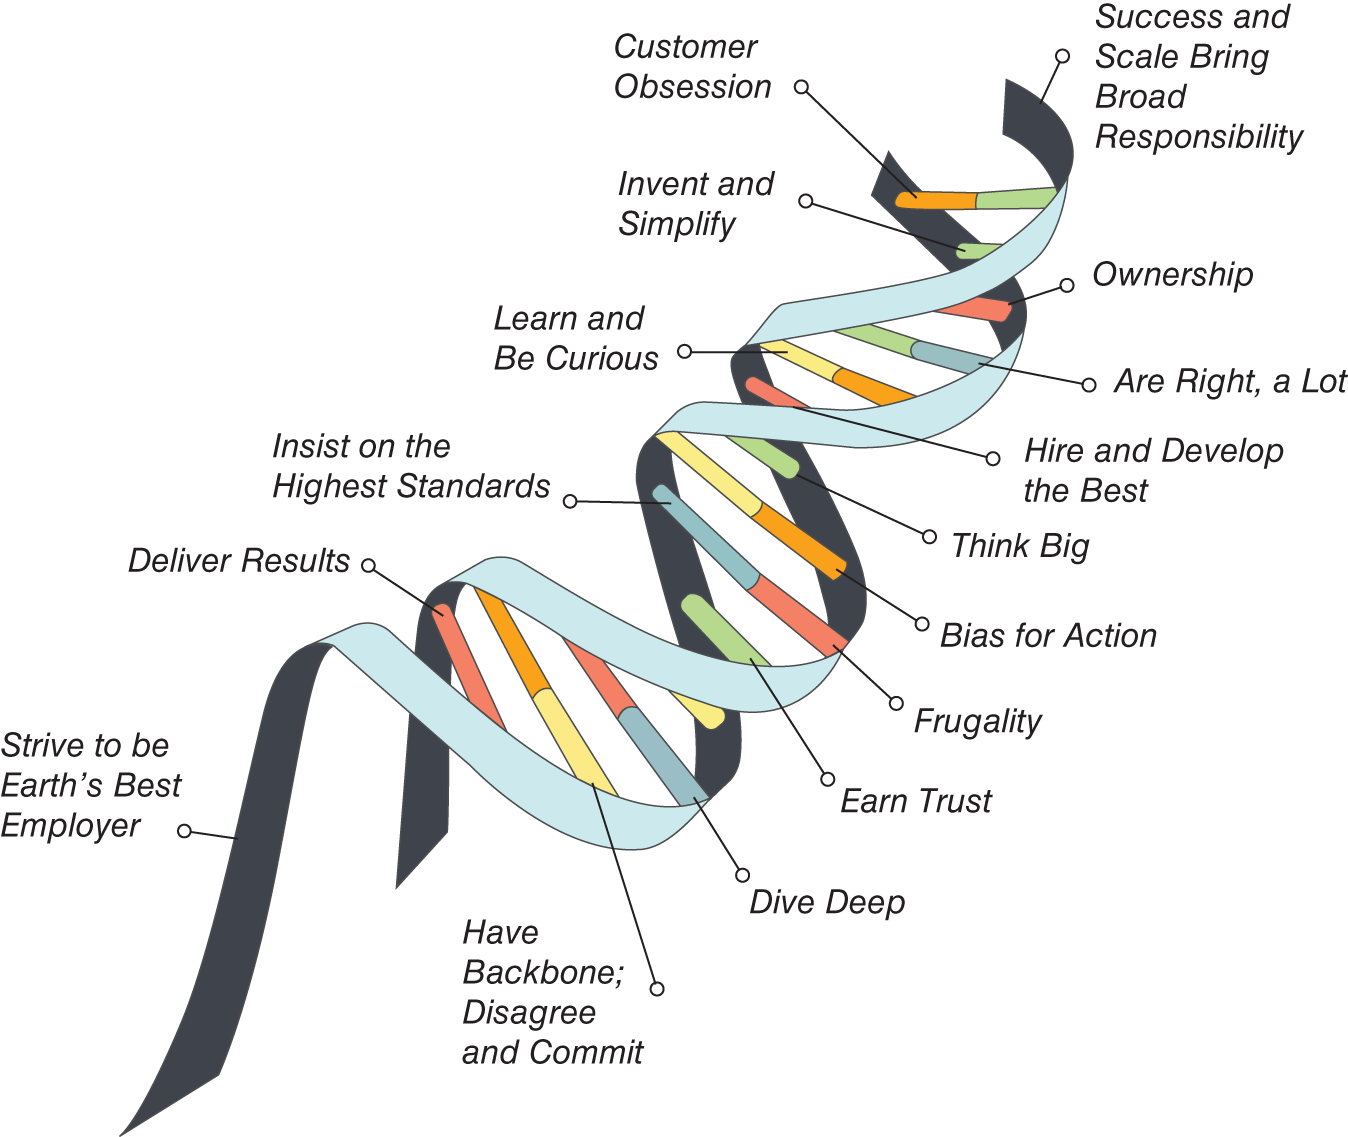
FIGURE 10.1 Amazon's Leadership Principles
It bears repeating that the challenge in today's world is not the lack of information but the judgment to use it. The hiring exercises you conduct (see Figure 10.2 in “The 5‐Dot Interviewing Exercise” call‐out box) should be designed to show to what degree candidates demonstrate judgment. Using such exercises, a candidate who shows judgment will distinguish themselves from other candidates. We operate in a culture that worships numbers, and rightly so because facts and figures hold weight. We have become a world of data hounds. Independent of the business size—small or large, well‐funded start‐up or garage‐based—all businesses have one recurring theme: Everyone suffers from information overload. We have seen innovations missed, opportunities passed by, and customers lost because people do not know how to discover the relevant facts, develop insights, and deliver them with impact. A select few understand the power of data, know the questions to ask, connect it to their larger business strategy, and use it to engage customers and achieve revenue objectives. Successful leaders build a team of talented colleagues who bring judgment, critical thinking, and creativity.
In many instances, building a set of QI skills is not about building individual skills, but creating the right mindset or new ways of working. Amazon is a great example of this. Jeff Bezos did this repeatedly by defining 16 leadership principles (see Figure 10.1) such as “learn and be curious” and “insist on the highest standards.” Embed the “Day 1” philosophy. At Amazon, “Day 1 is both a culture and an operating model that puts the customer at the center of everything Amazon does…Day 1 is about being constantly curious, nimble, and experimental.”
Building a Quantitative Intuition™ Team
While almost every organization and any position within the organization can benefit from learning QI skills, not all of the skills can exist within a single person. Effective leaders in fast‐growth companies realize the ability to tackle problems for optimal results occurs by having the right team. What is the “right team”? The “right team” can see a situation as a whole, without constraint, while mitigating bias leading to creative solutions that are embraced. These solutions may be simple, bold, or provocative, but they result in sustained impact that effectively addresses the original problem. Most importantly they causes people to take action ranging from reassessing their thinking to adopting the recommendation.
As you understand by now, QI skills are a blend of data intelligence and human judgment. From our research these are found in four roles—data scientist, data engineer, data translator, and data artist—that form the cornerstone of the QI team. This QI team is composed of a mix of backgrounds, experiences, expertise, and tenue that works as a unit to achieve the desired outcome. Easier said than done. Successful leaders navigate these hurdles while rallying the troops to create a culture where this mix of talent thrives, making this a rare and valuable skill. This should be our starting point as we consider how to hire for QI skills.
Data Scientists: Data scientists are equivalent to architects. They develop the blueprint that serves as the scaffolding to build insights. Hal Varian, the chief economist at Google called the role of a data scientist “The Sexiest Job of the 21st Century.”1 These individuals can coax treasure out of messy, unstructured data. They are deeply knowledgeable in tools and techniques such as conjoint analysis, TURF (Total Unduplicated Reach and Frequency) analysis, text analysis regression, neural networks, predictive machine learning tools, and cohort analysis, to name just a few. By applying these tools data scientists help organize structured and unstructured data into slices to show a clearer picture of the information.
It is important to note these blueprints may be developed at the start of a project to guide how to capture the information or at the back end once you have a data cube. The determinant on when and where a data scientist engages deepens on the complexity of the question. Straightforward questions that are simple to answer, requiring limited inputs, do not require the robustness of a blueprint to answer. For more complex problems, data scientists play a vital role in analyzing a data cube by tapping into specific skills in data modeling, relational databases, and statistics as they approach problems systematically and methodically. As artificial intelligence and machine learning become ubiquitous in business processes, the demand for data scientists will increase as they are at the intersection of methods, algorithms, and techniques to build models to generate insights. With a mix of math, statistics, and computer science skills, they bring the technical knowledge to answer complex questions.
Data Engineers: Data engineers put the pipes in place to enable the data to flow. Using an analogy of building a house data engineers would be equivalent to plumbers or electricians. The first step for data engineers is to ingest the data. They bring the essential skills to connect the data from disparate sources such as websites, mobile phones, cloud‐based systems, surveys, GPS, or transactional data. Given the variety, velocity, volume, and veracity of the inputs, the second step for data engineers is to harmonize the data by designing rules to create a schema to combine data from different sources. These rules define how to name, convert, process, and merge the data to provide a consistent view of the data. This is a complex process requiring judgment, technology, and business knowledge. Since this data can come from anywhere, it must be stored in a single location to make it usable. There is often an erroneous belief that the value of Big Data comes from how long the data set is, from how many observations we have, or from whether we observe hundreds of thousands of customers or millions of transactions. But the real value of Big Data comes from connected data, from many variables observed on every single data unit. From the width rather than the length of data. Harmonized data provides organizations with a 360º view of their business. Connecting attitudinal, sales, operational, financial, and marketing data into a single view improves agility, quality, and speed of decision‐making. The third step is to house the data in a data cube so the aggregated data has a place to live. A data cube, at its core, is a database of rows and columns. The simplest form is an Excel spreadsheet but can go up too much more complex relational databases that categorize, group, and map the relationships among the data. An important role of data engineers is to ensure data interoperability. Making sure that data can be moved from one system to another is connected across systems and over time as systems are being upgraded or even replaced altogether. Probably the most common cause for the loss of historical data is the change of the data input or storage systems. Data engineers enable data scientists and data translators to do their jobs. Data scientists cannot build models without the data cube and data translators would not be able to translate the raw data into insights.
Data Translators (mix of data and intuition skills): Data translators answer specific business questions. They bring both the quantitative and intuition skills. The most effective translators approach their roles as a translator between the business stakeholders, data scientists, data engineers, and data artists. They bridge the language of business and data to enable data‐driven decisions. Data translators frame the problem by asking questions, fiercely interrogate the data, put the data in the context of the problem, and synthesize the information leading to an effective decision. Inherent in the data translator's role is the need to be grounded in the business priorities with a laser focus on driving outcomes. Data analysis is a means to an end. The successful data translator looks at the problem as a whole and uses a range of analytic tools to influence the business strategy. Data translators have an innate curiosity and constantly ask: “Why?” or “So what?” The “so what?” (see Chapter 6 for a detailed discussion) is a discussion about what the data really means by putting it in the business context. They wallow in the data to test, measure, learn, and iterate.
Successful data translators have an analytical mindset. This is very different from learning analytic tools and methods. An analytical mindset is a skill that almost every leader seeks, and many are missing. Being good in analytics or math doesn't necessarily give you the analytical mindset. We have seen plenty of very smart quant Ph.D.'s who have deep analytical skills but do not have an analytical mindset. Thinking analytically includes being clear about the purpose of the essential question rather than wondering in the forest of data; being inquisitive about the data and analytics, not from a statistical perspective but from a face validity perspective; and being able to connect the dots via synthesis, and eventually being able to tell an informed story that is based on fact rather than just opinions, or merely restating the facts. Often the greatest value consultants and the best data translators bring to companies is thinking analytically and structurally. Data translators often embody within a single person most of the skills discussed earlier as necessary for a QI leader, which makes them one of the most critical roles in the QI team and, at the same time, hard to find.
Data Artists (intuition skills): Data artists create graphs, charts, infographics, and other visualizations so people can quickly understand complex data. Data artists have many of the delivery skills that are discussed in Chapter 8. Great visualizations expand the dialogue by bringing more people into the conversation. The outcome is faster and better decisions. One myth about data visualization is that you must be extraordinarily creative to truly master it. We fundamentally disagree with that assertion. When people hear about data artists and minimize the time allocated for data visualization, it is due to a profound lack of understanding of this discipline or a skill gap. Often when people hear about data visualization, they may think it is about arts and crafts. This could not be further from the truth. There is an insightful quote by Ron Crossland in Voice Lessons: Applying Science to the Art of Leadership Communication: “Facts alone seldom persuade and rarely inspire.” Content matters. Full stop. Visualization will enable you to inspire people to act on your content and recommendation. Visualization serves other purposes too. Because of the way our brains are wired, humans tend to remember the average rather than the sum of what they're told. Data visualization allows us to prominently highlight important summaries of the data and cut through the noise.
At the highest level of mastery, the data artist's role combines the expertise of a data scientist with the skills of a graphic designer. However, like any skill, there is a range of proficiencies with data visualization. By consistently applying a set of core principles you will immediately uplevel your presentation. These foundational principles include: (1) Embrace white space, (2) One thought per page, (3) Large font, (4) Limit color usage, and (5) Synthesize don't summarize. A rich resource is the chart chooser available at Extreme Presentation™ Method. If you are looking for inspiration, a current day pioneer in data artistry is David McCandless, who turns complex data sets into simple visualizations to uncover unseen connections and patterns. Remember your goal is to persuade not present.
While we have discussed these roles as four distinct ones (see Table 10.1), there is an overlap in skills, approach, training, and experience. You can major in one of the roles, minor in a second, and take “electives” in the other. For example, you do not need to be a graphic designer to do great data visualization. The successful professional will have a blend of these skills.
You can help your team build QI skills to “force” a conversation. Do this during a low‐risk scenario, for example, when you are in a one‐on‐one meeting or doing a dry run of a presentation. The intent is to create a safe space for learning. Request that the presenter keeps the presentation closed. Ask them to discuss the results. Inquire about outliers or any findings that could not be explained. Watch how much richer the conversation becomes after the initial shock wears off by removing the crutch known as slides. Did they demonstrate mastery of the information? Do they offer a point of view on the problem? Can they talk about the implications relative to the business challenge? If they can't, that is okay. You are identifying areas of development. As you repeat this exercise with your team, team members will be increasingly prepared. They will develop confidence over time. This will set them on the path to driving action from their analysis.
TABLE 10.1 QI roles and skills
| Data Scientist | Data Engineer | Data Translator | Data Artist | |
|---|---|---|---|---|
| Role | Architect | Infrastructure | Connector | Visualization |
| Tools | Advanced analytic techniques, e.g., conjoint analysis, TURF, text analysis, regression, machine learning neural networks, factor analysis | SQL, AWS, Spark, Hadoop | Microsoft Excel, Python, Tableau | Presentation software, e.g., Microsoft PowerPoint, Google Slides, Adobe, Tableau |
| Skills | Statistics, math, communication | Programming | Quantitative, synthesis, business, communications, programming | Data analyst to scientist; Graphic design |
| Approach | Systematic, methodical | Detail‐oriented; operations and quality | Focused but parallel; works across units | Broad |
| Output | Blueprint or model to analyze data | Build the pipes/infrastructure to deliver the data | Answer specific business questions | Engage and persuade. Compel people to act. |
Now that you understand the essential skills and how they manifest themselves in the four roles, it is important to discuss the composition of the team. While the four roles are critical, they are not needed in equal parts (see Figure 10.4). There is no precise ratio as it varies based on your size of business, amount of information, and industry. Conceptually from largest to smallest, you need data translators to interpret the data, data artists to help engage and persuade, data scientists to build models, and data engineers to ensure the data continues to flow.
Cultivating a Quantitative Intuition™ Organization
As you grow your QI team, it's best to understand the relation between your approach to QI and the readiness of your organization to make decisions under uncertainty. This can be mapped into the beginning of a maturity model for yourself and your team.
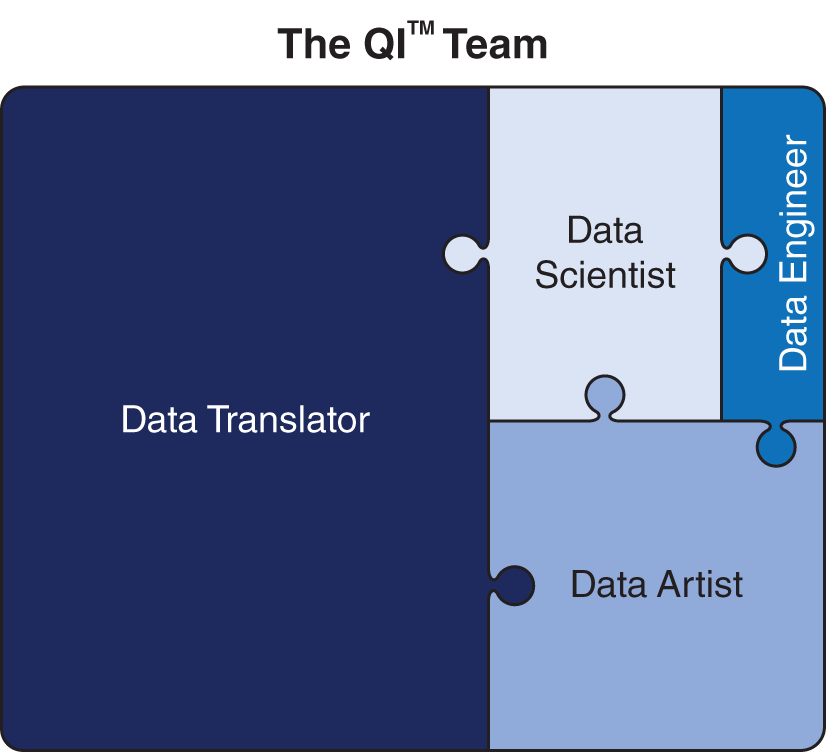
FIGURE 10.4 Structuring the QI team (sample ratio)
As with any data, put your QI skills in perspective. Are you new to working under uncertainty and applying both quantitative and intuitive lenses? Have you previously bridged deep analytics and human insight into a solid decision process? Or are you “high functioning” with QI bridging information and intuition, while bringing your organization along to do so as well?
Turning to your organization, consider the culture and the organizational maturity. Is the organization highly flexible, cautious but open to evolve, or significantly rigid and slow to navigate uncertainty?
Mapping that to a simple matrix (see Figure 10.5) could look like the following:
As a QI champion, you will see yourself in the top row, but what about your organization? We find 100‐year‐old companies that are highly flexible and startups that are rigid, so the labels can be deceiving and require an honest assessment of an organization's true culture and direction. Once your organization's appetite for change is understood, you may determine if you are collaborating with like‐minded decision‐makers or if you are an evangelist moving a rigid organization forward. It will be valuable to understand your role in an evolving organization to absorb and eventually adopt better decision‐making under uncertainty.
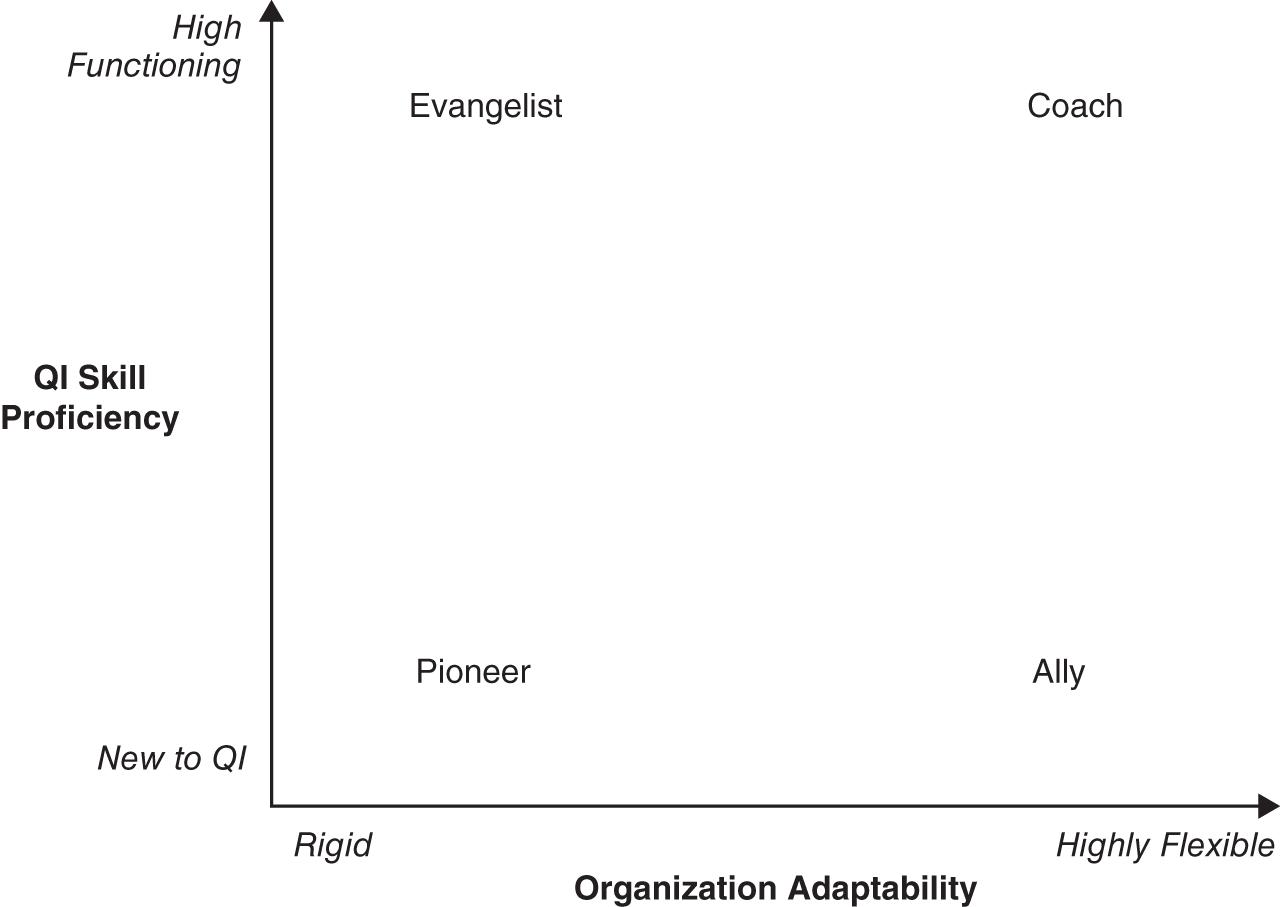
FIGURE 10.5 Your role in QI adoption within the organization
We live in a time when information is exploding and often feels invasive or intimidating. In reality, we are fortunate to have this staggering amount of information. The right team with the core skills will be the pioneers in transforming business and provide foresight on key areas for growth. At the end of the day, a select few understand the power of data, know the questions to ask, connect it to their larger business strategy, and use it to engage customers and achieve revenue objectives. By embracing the four roles, organizations will make faster, more productive decisions.
Key Learnings ‐ Chapter 10
- The current gap in the workforce is less about people with deep analytical skills, and more about leaders who can lead them and make better decisions with analytics.
- In hiring individuals, look for the QI skills along QI's three pillars: precision questioning, contextualizing data, and synthesizing.
- In interviews, focus on people's ability to move from the “what?” to the “so what?” and “now what?”.
- Build a team composed of the four roles: data scientists, data engineers, data translators, and data artists.
- Invest time and energy in visualization. Hire data artists.
- Data translators should make up the majority of your team.
Note
- 1. Davenport, T. H., and Patil, D. J. “Data Scientist.” Harvard Business Review, 2012, 90(5): 70–76.