
18
COMMUNICATIONS IN FADING ENVIRONMENTS
18.1 INTRODUCTION
The fading channel is characterized as a multiplicative disturbance in which the signal amplitude fluctuates with time depending upon the temporal characteristics of the channel. The term “channel” is used somewhat broadly in the sense that the amplitude fluctuations often result from many signal paths that appear as a signal with random phase variations at the receiver terminal. These multipath signals combine in such a way that the phases constructively and destructively combine resulting in random variations of the received signal amplitude. The amplitude of the received signal is often dominated by a direct or line of sight (LOS) path and the received signal amplitude fluctuations are related to the direct‐path signal amplitude. The signals arriving at the receiver over direct and indirect paths are, respectively, referred to as the specular and random components of the received signal. The specular component corresponds to the received signal over the path without fading.
An important aspect of the fading environment is the temporal characteristic of the amplitude fluctuations. For example, if all of the signal paths through the channel were fixed or unchanging, the received signal amplitude would be a constant random variable independent of time. However, real channels are seldom stationary but fluctuate with time due to natural disturbances, such as atmospheric and ionospheric turbulence, Doppler velocities, Faraday rotation, and changes in ground reflection coefficients. An interesting phenomenon in the satellite channel is that the fluctuations or scintillations are a result of the diurnal changes in the electron density of the ionosphere, which are more severe in the equatorial and polar regions than at midlatitudes. The temporal fading is also sensitive to the motion of the transmitter and receiver terminals. Slow fading results when the channel correlation time is much greater than the symbol rate or the fundamental time constants of the receiver and demodulator. On the other hand, rapid fading results when the channel correlation times are less than the symbol durations or the system time constants.
Another important aspect of the fading environment is the frequency bandwidth over which the amplitude fading characteristics remain constant or correlated. For example, when the entire radio frequency (RF) bandwidth occupied by the communication signal fades identically, the signal level changes; however, the signal is undistorted; in this case, the fading is referred to as frequency nonselective fading, or simply nonselective or flat fading. When the channel coherence bandwidth is less than the occupied bandwidth, then frequency selective fading occurs resulting in independent fading over portions of the bandwidth resulting in severe signal distortion. Mobile radio communications [1, 2] in urban and rural areas with indoor and outdoor cell phone communications encounter small‐scale fading effects leading to rapidly changing Rayleigh fading with large Doppler shifts and signal dispersion. These environments also encounter man‐made interference [3] that compounds the system complexity in providing reliable communications.
Based on these introductory comments, the communication systems designer can generally improve the performance by applying robust waveforms, coding, interleaving, diversity combining,1 and automatic repeat request (ARQ) protocols. Diversity combining is a technique of making the most of a bad situation, in that, the received waveforms to be combined must be separated by more than the fading correlation intervals either in time or frequency, resulting in increased data throughput and/or RF bandwidth. Several forms of diversity combining to improve the system performance are temporal, spatial, frequency, angle‐of‐arrival, and polarization diversity. These topics are also examined in Chapters 19 and 20.
18.2 RICEAN FADING CHANNELS
The Ricean fading model characterizes the statistical fluctuations in the received signal amplitude in terms of the specular and random components. The analysis is based on examining the envelope of a sinusoidal signal and narrowband Gaussian noise as shown in Figure 18.1 where the signal is expressed as
with peak voltage level Vs, carrier frequency ![]() Hz, and arbitrary signal phase ϕs. The peak voltage of the input sinusoidal signal represents the specular component of the received signal power given by
Hz, and arbitrary signal phase ϕs. The peak voltage of the input sinusoidal signal represents the specular component of the received signal power given by ![]() watts. The expression for the statistics of the signal envelope random variable r is the Ricean probability density function (pdf) that plays a dominate role in evaluating the system performance in a fading environment. The specular component in the Ricean model is the signal voltage, Vs, and the random component is characterized in terms of the standard deviation, σr, of the narrow band Gaussian noise. When the specular component is zero, the amplitude fading is characterized by the Rayleigh pfd.
watts. The expression for the statistics of the signal envelope random variable r is the Ricean probability density function (pdf) that plays a dominate role in evaluating the system performance in a fading environment. The specular component in the Ricean model is the signal voltage, Vs, and the random component is characterized in terms of the standard deviation, σr, of the narrow band Gaussian noise. When the specular component is zero, the amplitude fading is characterized by the Rayleigh pfd.

FIGURE 18.1 Ricean model: envelope of signal and narrowband Gaussian noise.
The derivation of the Ricean distribution is developed in Section 1.5.5.1, and the result is expressed as

where Io(x) is the modified Bessel function of order zero [4]. It is useful to express the Ricean distribution in normalized form by letting ![]() and
and ![]() with the result
with the result

This normalized expression for the Ricean pdf is plotted in Figure 18.2 with ![]() as a parameter. The specular‐to‐random noise power and the additive white noise-to-random noise power ratios are defined as
as a parameter. The specular‐to‐random noise power and the additive white noise-to-random noise power ratios are defined as


FIGURE 18.2 Normalized Ricean probability density function.
18.2.1 Rayleigh Fading Channels
When the specular component of the Ricean pdf is zero, the resulting distribution for the envelope r is the Rayleigh pdf expressed as
18.2.2 Gaussian Limit
At the other end of the spectrum from the Rayleigh distribution, that is, as Vs approaches infinity, such that ![]() ; the modified Bessel function is approximated as
; the modified Bessel function is approximated as

Substitution of (18.6) into the Ricean pdf described by (18.2) and completing the square in the exponent results in the expression

Where the last approximation in (18.7) applies for values of r within several standard deviations of Vs, that is, for ![]() or
or ![]() . Therefore, based on the condition
. Therefore, based on the condition ![]() , it follows that
, it follows that ![]() for reasonably small values of k. Consequently, as the specular component approaches infinity, the Ricean pdf approaches the Gaussian pfd with mean value Vs and standard deviation σr.
for reasonably small values of k. Consequently, as the specular component approaches infinity, the Ricean pdf approaches the Gaussian pfd with mean value Vs and standard deviation σr.
18.3 RICEAN CUMULATIVE DISTRIBUTION
It is informative to examine the cumulative distribution function (cdf) of the Ricean pdf so that the probability of the received signal exceeding a specified level can be determined. The cdf is defined as

However, it is convenient to examine the probability that r > rT corresponding to ![]() . Using the normalized parameters introduced in Section 18.2, the normalized threshold is
. Using the normalized parameters introduced in Section 18.2, the normalized threshold is ![]() and (18.8) becomes
and (18.8) becomes

Equation (18.9) is numerically integrated and the results are shown in Figure 18.3 for several values of the specular signal‐to‐noise ratio (SNR). As the specular component becomes large, the median value, Med[x] corresponding to ![]() , approaches the specular SNR. For example, in Figure 18.3, when
, approaches the specular SNR. For example, in Figure 18.3, when ![]() , the abscissa, corresponding to
, the abscissa, corresponding to ![]() , is approximately 11 dB. This occurs because, for large values of γsr, the Ricean distribution approaches the Gaussian distribution in which case the median and mean values are equal.
, is approximately 11 dB. This occurs because, for large values of γsr, the Ricean distribution approaches the Gaussian distribution in which case the median and mean values are equal.

FIGURE 18.3 Normalized Ricean cumulative distribution function.
The mean value of the Ricean distribution, used as the normalizing value in Figure 18.3, is evaluated as

or, in normalized form

The normalized mean value, E[x]/σr, is plotted in Figure 18.4. The straight‐line plot assumes the relationship ![]() and this appears to be a good approximation for specular SNRs exceeding about 3 or 4 dB. For a zero specular component, that is, for Vs = 0, the normalized mean value is
and this appears to be a good approximation for specular SNRs exceeding about 3 or 4 dB. For a zero specular component, that is, for Vs = 0, the normalized mean value is ![]() , which is simply the mean of the Rayleigh distribution.
, which is simply the mean of the Rayleigh distribution.

FIGURE 18.4 Mean value of Ricean pdf.
18.4 APPLICATION OF RICEAN CHANNEL MODEL
18.4.1 Slow Fading
To apply the Ricean distribution to the slow fading channel, the received signal power is viewed as the random variable ![]() and, considering zero‐mean additive white Gaussian receiver noise (AWGN) with power
and, considering zero‐mean additive white Gaussian receiver noise (AWGN) with power ![]() , the average receiver SNR is
, the average receiver SNR is ![]() . In addition, the random and specular SNRs are defined as
. In addition, the random and specular SNRs are defined as ![]() and
and ![]() , respectively. Substituting these SNRs into the Ricean pdf results in the distribution of the received SNR in a Ricean fading environment, given by
, respectively. Substituting these SNRs into the Ricean pdf results in the distribution of the received SNR in a Ricean fading environment, given by

The performance of a communication system is usually characterized in terms of the bit‐error probability, that is, expressed as a function of, or conditioned on, the receiver SNR as
In a nonfading channel, the SNR is not a random number but is constant so that ![]() ; however, in a fading environment, the SNR is a random variable and the conditioning on γ must be removed using the pdf of the fading SNR. In general, the result is
; however, in a fading environment, the SNR is a random variable and the conditioning on γ must be removed using the pdf of the fading SNR. In general, the result is
where the integration is over the applicable range of γ.
18.4.2 Fast Fading
In the fast fading environment, the temporal correlation of the fading is much faster than the minimum system time‐constant, which is typically the bit or symbol duration of the transmitted waveform.2 In this situation, the random component of the fading channel is considered to be additive noise, so the received SNR is defined as the ratio of the specular component to the random component plus receiver noise, that is,
Expressed in terms of the average signal-to-noise ratio ![]() with
with ![]() , (18.15) becomes
, (18.15) becomes
Using (18.14) and (18.16) the bit‐error probability Pbe = Pr (γ) is unique to the underlying modulation, for example, for CBPSK modulation the bit-error probability is expressed as

18.5 PERFORMANCE OF SEVERAL BINARY MODULATION WAVEFORMS WITH RICEAN FADING
In this section, the bit‐error performance of coherent binary phase shift keying (BPSK), (CBPSK), differentially coherent BPSK (DCBPSK), and noncoherent (NC) binary frequency shift keying (BFSK) (NCBFSK) are examined in slow Ricean fading (SRF) and fast Ricean fading (FRF) environments. Noncoherent or NC refers to noncoherent detection processing in the demodulator.3
18.5.1 CBPSK with Slow Nonselective Ricean Fading
The bit‐error probability of CBPSK, conditioned on the SNR is
where ![]() is measured in the data rate bandwidth of 1/Tb. Eb = PsTb is the energy‐per‐bit and No is the receiver noise power density. Using the concepts discussed in Section 18.4, the demodulated bit‐error probability is evaluated as
is measured in the data rate bandwidth of 1/Tb. Eb = PsTb is the energy‐per‐bit and No is the receiver noise power density. Using the concepts discussed in Section 18.4, the demodulated bit‐error probability is evaluated as

It is convenient to evaluate (18.19) in terms of the average SNR ![]() with the ratio of the specular‐to‐random signal components defined as
with the ratio of the specular‐to‐random signal components defined as ![]() . Substituting these results with
. Substituting these results with ![]() into (18.19), the bit‐error probability is expressed as
into (18.19), the bit‐error probability is expressed as

Equation (18.20) is plotted in Figure 18.5 for various values of the parameter β. The case β = ∞ corresponds to the Gaussian channel with no fading and β = 0 results in the slow fading Rayleigh limit (SFRL) channel performance. The closed‐form expression for the bit‐error probability for β = 0 is evaluated using the integral (Reference 4, p. 303, Integral No. 7.4.19), resulting in the expression

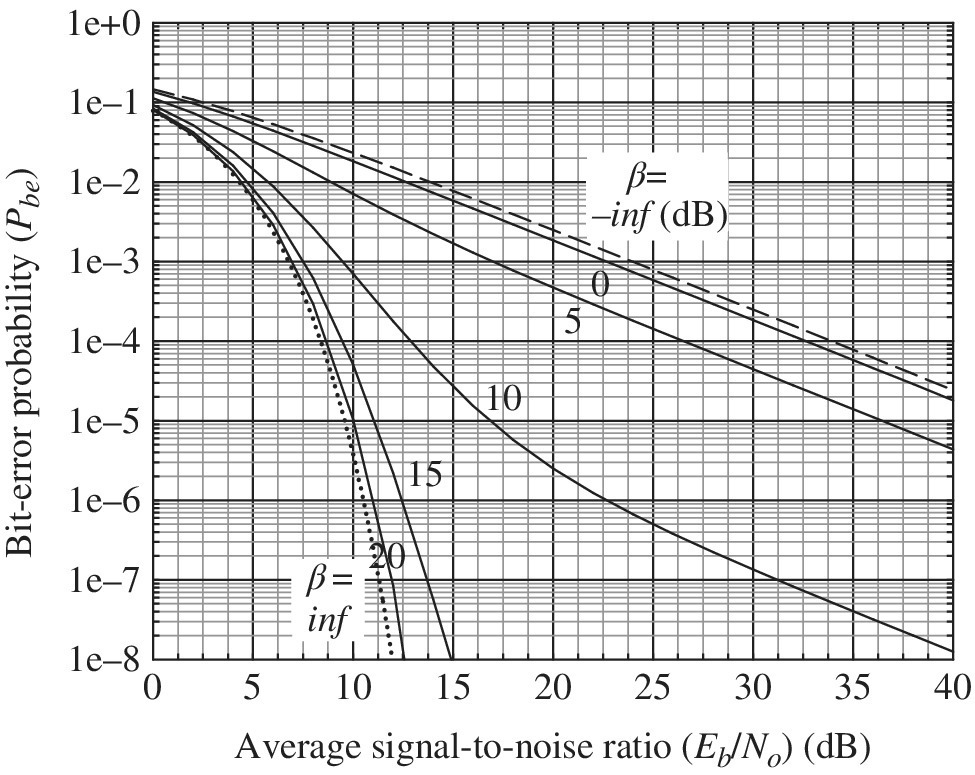
FIGURE 18.5 CBPSK with slow nonselective Ricean fading.
18.5.2 Coherent BPSK with Fast Nonselective Ricean Fading
The performance of CBPSK in the fast fading Ricean channel is evaluated as

Equation (18.22) is plotted in Figure 18.6. When β = ∞, the result is simply the performance of ideally demodulated CBPSK; however, when β = 0, the bit‐error probability is 0.5 corresponding to the fast fading Rayleigh limit (FFRL) with no information being conveyed by the signal.

FIGURE 18.6 CBPSK with fast nonselective Ricean fading.
18.5.3 Differentially Coherent BPSK with Slow Nonselective Ricean Fading
The bit‐error probability performance of DCBPSK in an AWGN channel is given by
and, in keeping with the previous discussions, the performance in the slow fading Ricean channel is evaluated as

Substituting the variable ![]() results in the expression
results in the expression

where  . Performing this integration [5] yields
and substituting for the previously defined parameters ![]() and β results in
and β results in
Equation (18.28) is the bit‐error performance of DCBPSK in a slow fading Ricean channel and is plotted in Figure 18.7. The SFRL is evaluated with β = 0 and is

FIGURE 18.7 DCBPSK with slow nonselective Ricean fading.
18.5.4 Differentially Coherent BPSK with Fast Nonselective Ricean Fading
The performance of DCBPSK in the fast fading environment simply attributes the received noise as being the sum of the thermal noise and the random component of the channel noise resulting in the bit‐error probability expression
or, in terms of the parameters ![]() and β,
and β,
Equation (18.31) is the bit‐error performance of DCBPSK in a fast fading environment and is plotted in Figure 18.8. The FFRL is evaluated with β = 0 and is

FIGURE 18.8 DCBPSK with fast nonselective Ricean fading.
18.5.5 Noncoherent BFSK with Slow Nonselective Ricean Fading
The bit‐error performance of NCBFSK in an AWGN channel is given by
and, in keeping with the previous discussions, the performance in the slow fading Ricean channel is evaluated as

Substituting the variable ![]() results in the expression
results in the expression

The integrand in (18.35) can be expressed in terms of the pdf pR(x), in the form of (18.12), by substituting ![]() in the argument of the Bessel function and adding and subtracting b to the exponent. The result is
in the argument of the Bessel function and adding and subtracting b to the exponent. The result is

The integral in (18.36) is equal to unity, so the expression for the bit‐error probability becomes simply

and, upon substituting for the previously defined parameters ![]() and β (18.37), results in
and β (18.37), results in
Equation (18.38) represents the performance of NCBFSK in a slow fading Ricean channel and is plotted in Figure 18.9. The SFRL limit is evaluated with β = 0 and is

FIGURE 18.9 NCBFSK with slow nonselective Ricean fading.
18.5.6 Noncoherent BFSK with Fast Nonselective Ricean Fading
The bit‐error performance of NCBFSK in an AWGN channel is given by
Because the result is very similar to the performance for DCBPSK, the performance for NCBFSK in the fast fading Ricean channel is readily evaluated as
or, in terms of the parameters ![]() and β,
and β,
Equation (18.42) is the bit‐error performance of NCBFSK in a fast fading environment and is plotted in Figure 18.10. The FFRL is evaluated with β = 0 and is

FIGURE 18.10 NCBFSK with fast nonselective Ricean fading.
18.6 GENERATION OF RICEAN RANDOM VARIABLES
Ricean distributed random variables are easily generated by using the expression for the magnitude of a narrowband signal plus AWGN given by
where nI and nQ are iid Gaussian random variables N(0, σr) and ϕ is a uniformly distributed random phase over ±π. The signal or specular value Vs is determined from the signal‐to‐noise specification, γsr, as
Figure 18.11 shows the pdf for the normalized random variable r/σr formed using 100K Ricean random variables r corresponding to SNRs γsr = −∞, −3, 3, 6.5, and 9 dB. Considering that the responses represent a single record, or ensemble of a stochastic process, the plots are in reasonable agreement with the corresponding theoretical results shown in Figure 18.2.

FIGURE 18.11 Normalized Ricean probability density functions (based on 100K computer‐generated samples).
Correlated Ricean random variables can also be generated based on the conditional pdf4 expressed as

Where ni and ni−1 are the underlying zero‐mean iid Gaussian random variables and ρ is the correlation coefficient. Using (18.46), the magnitude of the correlated random variables, corresponding to (18.44), is computed as

where the initial conditions correspond to ![]() . The quadrature variables nIi and nQi can be thought of as the discrete‐time wss stochastic process n(ti,ζ) with ζ representing the quadrature outcomes. The received signal plus noise complex random process is characterized as
. The quadrature variables nIi and nQi can be thought of as the discrete‐time wss stochastic process n(ti,ζ) with ζ representing the quadrature outcomes. The received signal plus noise complex random process is characterized as
where ϕi is a uniformly distributed random variable over ±π with pdf p(ϕ) = 1/2π. The complex random variables ni are discrete‐time Ricean distributed random variables with t = iΔt corresponding to the sampled wss random process n(t) with autocorrelation response given by

The range of the integration in (18.49) can be limited to TI corresponding to a negligible correlation response. The normalized correlation response is expressed as

The sampling interval Δt is established by the channel bandwidth Bch necessary to support the modulated waveform, such that, Δt ≤ 1/2Bch.
18.6.1 Multipath Rayleigh Fading Simulator
A multipath Rayleigh fading simulator for mobile radio applications is described by the functional diagram in Figure 18.12 [6]. The quadrature noise generators provide zero‐mean iid Gaussian random samples5 denoted as N(0,σn). The sampled output sT(t), in Figure 18.12, represents a real carrier‐modulated waveform; however, the following analysis is based on the complex envelope given by

FIGURE 18.12 Multipath Rayleigh fading simulator.
In this context, the baseband signal is identical to (18.48) with Vs = 0 resulting in Rayleigh fading. The movement of the mobile radio results in a Doppler frequency shift with the envelope of the received signal fluctuating about the local mean of the Rayleigh distribution and a uniformly distributed random carrier frequency phase. The characterization of the frequency response of the shaping filters is the principal factor in the design of mobile radio channels.
The shaping filter spectrum is dependent on the directive gain of the mobile radio antenna pattern and can be designed to accommodate any directivity characteristic [7]. However, for the commonly used omnidirectional antenna, the theoretical spectral density of the complex envelope of the received signal is expressed as [8]

where E is the rms value of the signal envelope and fd is the Doppler frequency given by
where V is the mobile vehicle velocity, λ = c/fc is the wavelength of the carrier frequency fc, and c is the speed of light. The theoretical Doppler frequency is evaluated by defining the n‐th moment of the spectrum, bn, as

Upon substituting (18.52) into (18.54), the Doppler frequency is evaluated as

The theoretical filter spectrum has an infinite response at fd and zero response at higher frequencies and the practical or simulated filter spectrum, ![]() (f), is designed to increase to a normalized peak of 6 dB at fd with a roll‐off of 18 dB/octave above fd. The moments of the simulated spectrum are denoted as
(f), is designed to increase to a normalized peak of 6 dB at fd with a roll‐off of 18 dB/octave above fd. The moments of the simulated spectrum are denoted as ![]() and the simulated Doppler,
and the simulated Doppler, ![]() , is computed using (18.55) with
, is computed using (18.55) with ![]() and
and ![]() . The simulated vehicle speed is
. The simulated vehicle speed is ![]() .
.
Using this approach the simulated fade rate is related to the theoretical fade rate by equating second moments of the respective spectrums. The authors report that the measured Rayleigh envelopes are within 3 dB of the theoretical envelopes down to nearly 40 dB below the rms level. The fading level crossing rate and average fade duration were also compared to the respective theoretical values, expressed as [9]
and

where Γ is the fade level relative to the rms level of the Rayleigh pdf. The authors report excellent agreement with theory in both of these performance measures when normalized by fd and ![]() .
.
18.7 RELATIONSHIPS BETWEEN FADING CHANNEL PARAMETERS
For multipath channels with N discrete paths, the multipath delays are denoted as τn and the channel baseband impulse is expressed as the summation [10, 11]

where an(t, τ) is the multipath time‐dependent amplitude function and the corresponding phase function is
where fc is the carrier frequency. Considering the analytic baseband transmitted signal ![]() , the received baseband signal is described as the convolution
, the received baseband signal is described as the convolution

In the expressions h(t; τ) and ![]() , the parameter t represents the time variation of the channel resulting from the relative motion between the transmitter, receiver, multipath points of reflection, and the multipath delay τ = τn(t) at time t corresponding to each reflection path. For the time‐invariant channel, or a channel that is relatively constant over a period of time, the channel impulse response in (18.58) simplifies to
, the parameter t represents the time variation of the channel resulting from the relative motion between the transmitter, receiver, multipath points of reflection, and the multipath delay τ = τn(t) at time t corresponding to each reflection path. For the time‐invariant channel, or a channel that is relatively constant over a period of time, the channel impulse response in (18.58) simplifies to

with
These relationships and their impact on wireless communications in urban and rural environments play an important role in the understanding and application of cellular communication technologies. Because of the complexity in analyzing the link performance, a common practice is to perform in situ measurements using test signals to evaluate the signal losses in the various environments, including indoor applications. Chapter 19 reviews the conditions and results for various in situ link models.
Although (18.60) is dependent on the discrete multipath though the implicit delta function ![]() , the expressions
, the expressions ![]() and h(t; τ) are considered to be continuous in τ by applying the impulse
and h(t; τ) are considered to be continuous in τ by applying the impulse ![]() to the channel response [12]; this simplifies the characterization of the underlying multipath parameters. In the following descriptions, the channel is considered to be wss with autocorrelation response X(t; τ1) with the corresponding two‐dimensional Fourier transform6
to the channel response [12]; this simplifies the characterization of the underlying multipath parameters. In the following descriptions, the channel is considered to be wss with autocorrelation response X(t; τ1) with the corresponding two‐dimensional Fourier transform6 ![]() . These functions are expressed, respectively, as
. These functions are expressed, respectively, as

and

where the delta function δ(τ1 − τ2) is used to denote that the multipath reflections are uncorrelated.
18.7.1 Channel Coherence Time and Doppler Spread
The channel coherence time, Tc, is characterized by the correlation response X(t; 0) and is defined, by the normalized form, as X(Tc; 0)/X(0; 0) = k where 0 < k < 1. The value of k is selected based on an acceptable decorrelation point in the response, for example, k = e−1 = 0.368. However, Tc can also be determined from the Doppler spread as described in the remainder of this section.7
The Fourier transform, H(fd; 0), of the correlation response X(t;0) characterizes the Doppler frequency corresponding to the time varying channel. This is consistent with the notion that the time dependence of the channel is the result of the changing path lengths due to the relative motion between the transmitter, receiver, and reflecting surfaces. The underlying principle is that the Doppler frequency is related to the velocity along the propagation path as
where fc is the carrier frequency, c is the free‐space speed of light, and v = Δd/t is the velocity, normal to the plane of the receiver antenna. The velocity results from a change in the propagation path length Δd that, in turn, results from variations in the multipath reflections. Based on the Fourier transform relationship, Tc and Bd are inversely related as
where Bd is the bandwidth beyond which the Doppler spread in H(fd; 0) is negligible. In practice it is found that (18.66) results in considerable signal decorrelation and intersymbol interference (ISI) and selecting Tc, such that X(Tc; 0) = 0.5 results in the approximation [13]
where fd(max) is the maximum Doppler expressed in (18.65). However, Rappaport [14] points out that the coherence time in (18.67) is too restrictive and suggests a rule of thumb given by
The coherence time is an important system design parameter, in that, it represents the time over which contiguous received modulated symbols are correlated and is a principal channel parameter because data symbols separated by more than Tc seconds are affected independently by the channel. Therefore, Tc influences the selection of the forward error correction (FEC) coding, the span of data interleavers, and the type of noncoherent combining.
As discussed in this section, fast and slow fading are characterized by the Doppler spread in terms of the dynamics of the channel. However, in Sections 18.4 and 18.5, fast and slow fading are characterized in terms of the coherence time relative to the symbol rate, for example, if the coherence time is less than (or comparable to) the symbol duration, then fast fading occurs. Because of the inverse relationship between Tc and Bd, these parameters impact the system performance in the same way, that is, high Bd and low Tc result in fast fading and vice versa.8 In either event, to improve the system performance, some combination of FEC coding, interleaving, combining, or other mitigation technique as outlined in Tables 20.13 and 20.14 is most likely required. The use of higher symbol rates to avoid the fast fading regime has its limits as discussed in Section 18.7.2.
18.7.2 Channel Coherence Bandwidth and Time Dispersion
The channel multipath spread is characterized by the correlation response X(0; τ) and is defined in the normalized form using τ = Tm and expressed as X(0; Tm)/X(0; 0) = k where 0 < k < 1. The parameter k is selected as a suitable decorrelation point in the response, for example, k = e−1 = 0.368.
The Fourier transform, H(0; f), of the multipath spread correlation response X(0; τ) characterizes the channel coherence bandwidth, Bc.9 This is consistent with the notion that the time dispersion of a signal can be characterized as delayed signal replicas10 corresponding to the channel multipath delays [15]. Based on the Fourier transform relationship, Tm and Bc are inversely related as
The bandwidth Bc is the bandwidth beyond which the Doppler spread in H(0; f) is negligible. For example, ![]() ; however, Rappaport [16] quantifies the delay dispersion for wideband wireless systems in terms of the mean and second moment of the excess delay and the rms delay spread of the power delay profile, defined, respectively, as
; however, Rappaport [16] quantifies the delay dispersion for wideband wireless systems in terms of the mean and second moment of the excess delay and the rms delay spread of the power delay profile, defined, respectively, as

and
where n corresponds to the number of signal paths arriving at the receiver, an is the power of the n‐th multipath received signal, and the excess delays are measured relative to the first received signal. The maximum excess delay corresponds to the delay of the last multipath signal that exceeds a defined threshold relative to the maximum of the multipath levels; an example threshold is −10 dB. The power delay profile can be generated by examining the return of a narrow pulse, wide bandwidth test signal.
Defining the coherence bandwidth as the frequency for which ![]() , then (18.69) is approximately related to the rms delay spread as [17]
, then (18.69) is approximately related to the rms delay spread as [17]
and with ![]() the approximate relationship is
the approximate relationship is
The results vary widely and the impact of the time‐varying multipath on a particular waveform demodulator must be examined by simulation [13, 18, 19] using accurate multipath channel models [20, 21].
The coherence bandwidth is an important system design parameter, in that, modulated waveforms with bandwidths greater than the coherence bandwidth will experience severe delay dispersion distortion requiring processing intense equalizers. It is also used to limit the chip rate of spread‐spectrum pseudo‐noise (PN) codes in code division multiple access (CDMA) systems if equalization is to be avoided. The coherence bandwidth is the frequency domain equivalence of the coherence time. For example, the frequency‐hopping spread‐spectrum (FHSS) and frequency diversity (FD) systems must use carrier frequencies separated by at least the coherence bandwidth to provide a combining gain and a net improvement in performance.
18.8 DIVERSITY TECHNIQUES FOR FADING CHANNELS
As mentioned in the introduction, diversity combining is an important aspect in providing robust communications in fading environments. The various forms of diversity, for example, temporal, frequency, spatial, angle‐of‐arrival, and polarization, are typically combined in the communication receiver or demodulator using time and frequency domain processing based on estimates of relative power levels and SNRs. Temporal diversity includes a variety of techniques including channel coding, involving FEC coding, data interleaving, message repetition, and various methods of ARQ [22] involving error detection and correction (EDAC) coding. In many applications, the diversity combining takes place between multiple or parallel receivers and demodulators that are dedicated to an independent diversity channel or communication link. In these applications, smart transmit and receive antennas [23] play an essential role in the diversity combining. Therefore, because of the common time and frequency domain processing, diversity techniques are generally applicable to a variety of fading channel conditions. In the slow nonselective Rayleigh and Ricean fading regimes, diversity combining is the most effective method of improving the system performance, providing significantly improved bit‐error performance and a reduction in message throughput under severe time and frequency fading conditions.
In Sections 18.8.1 and 18.8.2, diversity combining is described in terms of the number, N, of independently received signals that are available. The basic concept involves choosing an appropriate system performance parameter and then determining the best diversity selection algorithm based on combining signals or selecting one of N signals. The system performance parameters and the diversity selection options are apparent in the following discussions of the commonly used forms of diversity combining [12, 24, 25]. The diversity performance is based on the underlying Rayleigh channel fading, described in terms of the SNR using (18.12) with ![]() and the average SNR
and the average SNR ![]() . The pdf of the instantaneous SNR (γ) is expressed as
. The pdf of the instantaneous SNR (γ) is expressed as
The diversity selection algorithm must form the estimates of γ in the time equal to the reciprocal of the fade rate and, because of the relative short estimation times, the estimate is typically evaluated in terms of the signal‐plus‐noise to noise ratio or simply the signal‐plus‐noise. The automatic gain control (AGC) of each of the N receivers must establish identical receiver estimates for the diversity combining.
18.8.1 Frequency Nonselective (Flat) Fading
In this section, diversity selection techniques are discussed that are applicable to either frequency nonselective fading or frequency selective fading. In the former case, the combining interval must exceed the decorrelation time, whereas, with frequency selective fading the combining bandwidth must exceed the channel decorrelation frequency. The commonly used diversity techniques are selection diversity (SD) or switching diversity, maximal ratio combining diversity, and equal gain diversity. The diversity performance is based on the underlying SFRL, that is, the fading is slow relative to the transmitted symbol duration, and the reduction in the required Eb/No ratio to achieve a specified bit‐error probability is examined for several waveform modulations.
18.8.1.1 Selection Diversity
SD is the simplest type of diversity, in that, the demodulator uses the received signal with the largest estimate of the SNR. When the largest SNR is selected from among the N independent Rayleigh fading received signals, the underlying Rayleigh random variable (r) is transformed to the random variable r′. With the SNR of r′ defined as ![]() , the probability density function of the transformation is expressed as [26]
, the probability density function of the transformation is expressed as [26]
where ![]() is the average SNR of the Rayleigh pdf in (18.74). The derivation of (18.75) is rooted in the concept of order statistics discussed in Section 1.5.8.
is the average SNR of the Rayleigh pdf in (18.74). The derivation of (18.75) is rooted in the concept of order statistics discussed in Section 1.5.8.
SD Performance in a SFRL Channel
The performance of SD in a SFRL channel is examined in terms of the bit‐error probability of the DCBPSK and NCBFSK waveform modulations. The performance is based on (18.14) with Pr (bit‐error|γ) equal to the underlying bit‐error probability of the modulation, given, respectively, by (18.24) and (18.33), and p(γ) is the channel SD pdf expressed by (18.75). Upon performing the integration in (18.14) over the range 0–∞, the resulting bit‐error probability for each of the modulations is evaluated (see Problem 4) as

where ![]() and Γ(x) is the gamma function. The bit‐error performance for these modulations with SD is shown in Figure 18.13 for various values of N. For N = 1, (18.76) is simply the expression of the SFRL channel corresponding to β = 0 in Figures 18.7 and 18.9. The bit‐error results corresponding to the dashed curve represents the ideal AWGN performance of the respective underlying modulations.
and Γ(x) is the gamma function. The bit‐error performance for these modulations with SD is shown in Figure 18.13 for various values of N. For N = 1, (18.76) is simply the expression of the SFRL channel corresponding to β = 0 in Figures 18.7 and 18.9. The bit‐error results corresponding to the dashed curve represents the ideal AWGN performance of the respective underlying modulations.

FIGURE 18.13 Performance of DCBPSK and NCBFSK with SD and SFRL.
18.8.1.2 Maximal Ratio Combining Diversity
The maximal ratio combining diversity (MRCD) algorithm generates a composite envelope based on the summation of the N gain‐weighed and phase‐adjusted individual received signals and is expressed as

In (18.77), the phase of each received signal is adjusted to zero so the summation represents a coherent integration.
If each receiver has the same average noise power ![]() , the SNR in each receiver is
, the SNR in each receiver is ![]() . Consequently, the composite noise and signal powers are
. Consequently, the composite noise and signal powers are ![]() and
and ![]() corresponding to the SNR
corresponding to the SNR ![]() . Upon defining the gain as Gn = rn/N, Couch [27] shows that the maximum SNR occurs when
. Upon defining the gain as Gn = rn/N, Couch [27] shows that the maximum SNR occurs when

and that the corresponding pdf of γ is expressed as

where ![]() is the average SNR of the Rayleigh pdf expressed by (18.74). The individual channel SNRs (γn) are estimated using independent quadrature Gaussian samples characterized as N(m, σn). Therefore, based on the summation of N independent SNR estimates, expressed by (18.78), the distribution in (18.79) describes the chi‐square pdf with 2N degrees of freedom as discussed in Section 1.5.7.1.
is the average SNR of the Rayleigh pdf expressed by (18.74). The individual channel SNRs (γn) are estimated using independent quadrature Gaussian samples characterized as N(m, σn). Therefore, based on the summation of N independent SNR estimates, expressed by (18.78), the distribution in (18.79) describes the chi‐square pdf with 2N degrees of freedom as discussed in Section 1.5.7.1.
Maximal Ratio Combining Diversity Performance in SFRL Channel
The performance of MRCD in a SFRL channel is examined in terms of the bit‐error probability of the DCBPSK and NCBFSK waveform modulations. The performance evaluation follows that described in Section 18.8.1.1 for SD; however, in this case, the maximal ratio combining pdf expressed by (18.79) is used. Therefore, with these substitutions, (18.14) is integrated over the range 0–∞ and the resulting bit‐error probability for each of the modulations with MRCD is evaluated (see Problem 5) as

where ![]() . The bit‐error performance for these modulations with MRCD is shown in Figure 18.14 for various values of N. For N = 1, (18.80) is simply the expression of the SFRL channel corresponding to β = 0 in Figures 18.7 and 18.9. The bit‐error results corresponding to the dashed curve represents the ideal AWGN performance of the respective underlying modulation.
. The bit‐error performance for these modulations with MRCD is shown in Figure 18.14 for various values of N. For N = 1, (18.80) is simply the expression of the SFRL channel corresponding to β = 0 in Figures 18.7 and 18.9. The bit‐error results corresponding to the dashed curve represents the ideal AWGN performance of the respective underlying modulation.

FIGURE 18.14 Performance of DCBPSK and NCBFSK with MRCD and SFRL.
18.8.1.3 Equal Gain Diversity
Equal gain diversity (EGD) is similar to MRCD with Gn = 1 ∀n, that is, equal gains for each receiver, so it is easier to implement. However, the phase of each received signal is adjusted so that (18.77) represents a coherent integration. There is no known closed‐form solution for the resulting pdf p(γ); however, through testing and numerical evaluations, the performance is better than SD and slightly worse than that of MRCD [24].
18.8.2 Frequency Selective Fading
As mentioned previously, when the bandwidth of the modulated symbol is close to or exceeds the coherence bandwidth of the channel the received signal encounters a delay spread resulting in ISI distortion. In the absence of mitigation techniques, an irreducible degradation or flaring of the bit‐error performance occurs as the Eb/No is increased. To mitigate the performance degradation, the receiver or demodulator must use processing intense symbol equalization as discussed in Chapter 12. In urban wireless communication environments, the distortion appears as interfering signals from discrete multipath reflections. The reflections are characterized by the power delay profile with multipath delays τn: n = 1,…, N ranging over the multipath delay spread of Tm measured in µs. The impulse response of the discrete multipath channel is modeled as a tapped delay line as characterized by (18.61). For example, an average delay spread of 2 µs results in a coherence bandwidth of Bc ≅ 500 kHz and, operating under this condition, the American Digital Cellular (ADC) system uses a distortion‐free symbol rate of 48.6 ksps, approximately Bc/10, whereas, the Global System for Mobile Communications (GSM) signaling rate is 271 ksps and requires a 26‐bit equalizer training sequence [28].
Another important aspect of signaling in a frequency selective channel is the use of direct‐sequence spread‐spectrum (DSSS) and CDMA modulated waveforms. These modulations divide the bit interval into N′ PN code chips of a duration of Tch = Tb/N′ and use a correlator or matched filter sampled at the peak or zero lag of the correlator output to detect the received bit. The sampled correlator output corresponds to a processing gain of Gp = 10log10(N) dB relative to the correlation sidelobes so correlation lags in excess ±Tch are essentially uncorrelated for sufficiently large values of N. Under these conditions, a DSSS or CDMA waveform will resolve multipath delayed reflections as long as Tch < Δτn = min(τn−1,τn). The RAKE11 correlator [29–31] or matched filter is the optimum demodulator detection filter for wideband PN spread signals. The processing involves L ≤ N parallel correlators to resolve the largest L uncorrelated multipath delay returns that span the multipath spread interval Tm. The functional implementation is shown in Figure 18.15. Each RAKE correlator is implemented to locate and track an independent correlated multipath component of the received signal. This is accomplished by assigning a different and adjustable time‐shifted reference sequence from that of the known PN code. The parallel correlators output the optimally sampled multipath responses corresponding to the peak of the respective RAKE correlator responses. Defining the PN code chip bandwidth as W = 1/Tch ≫ Bc, the minimum number of correlator taps required to span the multipath spread is Ntaps = ceiling(TmW) or ≅ ceiling(W/Bc).
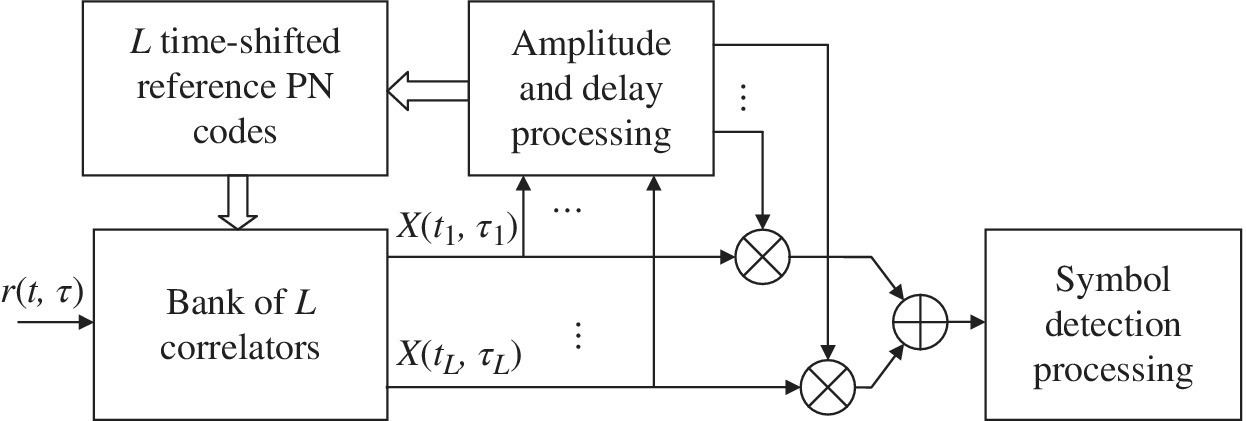
FIGURE 18.15 RAKE correlator processing of signals in frequency selective fading channels.
The multipath components and the L correlator outputs represent weighted signal powers or SNR estimates and are combined to form an MRCD receiver as described in Section 18.8.1.2. The pdf of the combined multipath components is the chi‐squared distribution described by (18.79) with 2L degrees of freedom.
ACRONYMS
Note: RAKE is not an acronym; it is the name applied to a wide bandwidth multipath correlator.
- ADC
- American digital cellular
- AGC
- Automatic gain control
- ARQ
- Automatic repeat request
- BFSK
- Binary frequency shift keying
- BPSK
- Binary phase shift keying
- CBPSK
- Coherent binary phase shift keying
- CDMA
- Code division multiple access
- DCBPSK
- Differentially coherent binary phase shift keying
- DSSS
- Direct‐sequence spread‐spectrum
- EDAC
- Error detection and correction
- EGD
- Equal gain diversity
- FD
- Frequency diversity
- FEC
- Forward error correction (coding)
- FFRL
- Fast fading Rayleigh limit
- FHSS
- Frequency‐hopping spread‐spectrum
- FRF
- Fast Ricean fading
- GSM
- Global System for Mobile Communications
- ISI
- Intersymbol symbol interference
- LOS
- Line of sight
- MRCD
- Maximum ratio combining diversity
- NC
- Noncoherent (detection)
- NCBFSK
- Noncoherent binary frequency shift keying
- PN
- Pseudo‐noise
- RF
- Radio frequency
- SD
- Selection diversity
- SFRL
- Slow fading Rayleigh limit
- SRF
- Slow Ricean fading
PROBLEMS
- Consider the analytic description of the baseband signal
 with amplitude Vs, phase ψ, and additive narrowband zero‐mean Gaussian noise ñ(t) with uniformly distributed phase ϕ over ±π. Show that the magnitude of the signal plus noise can be expressed by (18.44).
 - Write a program to compute correlated Ricean samples as described by (18.46) and (18.47) and compute and plot the normalized correlation responses Rr(t) and ρr(t) expressed, respectively, in (18.49) and (18.50) and determine the value of Tc corresponding to
 . Use an underlying correlation of ρ = 0.8 and unit standard deviation σr = 1 in (18.46). Also, use a channel bandwidth of Bch = 100 kHz and compute Vs using (18.45) for SNRs of γsr = 0 (−∞ dB) corresponding to the Rayleigh fading channel. Note: Once the program is completed, it is a simple matter to evaluate the performance under a variety of conditions.
 - Evaluate the Fourier transform of the correlation response Rr(t) in Problem 2 and determine the Doppler spread based on the spectral response Hr(Bd) = 0.368 and 0.1. What are the corresponding channel coherence times? What are the corresponding maximum symbol rates that the channel will support without distortion? In each case, what percentage of the symbol rate is the Doppler spread?
- Evaluate the solution for DCBPSK waveform modulation with SD and the SFRL channel as described by (18.76). Hints: Perform a transformation of variables using
 , then use the solution to the following integral and the definition of the beta function given by [32]where the beta function is defined as
 The solution to the beta function in terms of gamma functions is found in Korn and Korn [33].
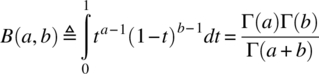
- Evaluate the solution for DCBPSK waveform modulation with MRCD and the SFRL channel as described by (18.80). Hint: Use the following integral solutions given by Korn and Korn [34].

REFERENCES
- 1. E. Ström, H. Hartenstein, P. Santi, W. Wiesbeck, Guest Editors, “Vehicular Communications,” Special Issue: Proceedings of the IEEE, Vol. 99, No. 7, pp. 1158–1326, July 2011.
- 2. A.D. Kucar, J. Uddenfeldt, Editors, “The Mobile Radio Centennial,” Special Issue: Proceedings of the IEEE, Vol. 86, No. 7, pp. 1303–1527, July 1998.
- 3. D. Middleton, “Man‐Made Noise in Urban Environments and Transportation Systems: Models and Measurements,” IEEE Transactions on Communications, Vol. COM‐21, No. 11, pp. 1232–1241, November 1973.
- 4. M. Abramowitz, and I.A. Stegun, Handbook of Mathematical Functions with Formulas, Graphs, and Mathematical Tables, National Bureau of Standards, Applied Mathematics Series 55, United States Department of Commerce, Washington, DC, June 1964.
- 5. I.S. Gradshteyn, I.M. Ryzhik, Table of Integrals, Series, and Products, Corrected and Enlarged Edition, by A. Jeffrey, Academic Press, New York, 1980.
- 6. G.A. Arredondo, W.H. Chriss, E.H. Walker, “A Multipath Fading Simulator for Mobile Radio,” IEEE Transactions on Communications, Vol. COM‐21, No. 11, pp. 1325–1328, November 1973.
- 7. M.J. Gans, “A Power‐Spectral Theory of Propagation in the Mobile‐Radio Environment,” IEEE Transactions on Vehicular Technology, Vol. VT‐21, pp. 27–38, February 1972.
- 8. R.H. Clarke, “A Statistical Theory of Mobile‐Radio Reception,” Bell System Technical Journal, Vol. 47, pp. 957–1000, July/August 1968.
- 9. W.C. Jakes, Jr., “A Comparison of Specific Space Diversity Techniques for Reduction of Fast Fading in UHF Mobile Radio Systems,” IEEE Transactions on Vehicular Technology, Vol. VT‐20, pp. 81–92, November 1971.
- 10. T.S. Rappaport, Wireless Communications, Principles and Practice, Second Edition, Prentice‐Hall PTR, Upper Saddle River, NJ, 2002.
- 11. G.L. Turin, F.D. Clapp, T.L. Johnston, S.B. Fine, D. Lavry, “A Statistical Model of Urban Multipath Propagation,” IEEE Transactions on Vehicular Technology, Vol. VT‐21, Issue 1, pp. 1–9, February 1972.
- 12. J.G. Proakis, Digital Communications, Second Edition, McGraw‐Hill Book Company, New York, 1989.
- 13. R. Steele, Editor, Mobile Radio Communications, IEEE Press, New York, 1994.
- 14. T.S. Rappaport, Wireless Communications, Principles and Practice, Second Edition, pp. 203–205, Prentice‐Hall PTR, Upper Saddle River, NJ, 2002.
- 15. W.C. Jakes, Jr., “An Approximate Method to Estimate an Upper Bound of the Effect of Multipath Delay Distortion on Digital Transmission,” IEEE Transactions on Communications, Vol. COM‐27, No. 1, pp. 76–81, January 1979.
- 16. T.S. Rappaport, Wireless Communications, Principles and Practice, Second Edition, pp. 199–203, Prentice‐Hall PTR, Upper Saddle River, NJ, 2002.
- 17. W.C.Y. Lee, “Smaller Cells for Greater Performance,” IEEE Communications Magazine, Vol. 9, No. 11, pp. 19–23, November 1991.
- 18. J. Chuang, “The Effect of Time Delay Spread on Portable Communications Channels with Digital Modulation,” IEEE Journal on Selected Areas in Communications, Vol. SAC‐5, No. 5, pp. 879–889, June 1987.
- 19. V. Fung, T.S. Rappaport, B. Thoma, “Bit Error Simulation for π/4 DQPSK Mobile Radio Communication Using Two‐Ray and Measurement‐Based Impulse Response Models,” IEEE Journal on Selected Areas in Communications, Vol. SAC‐11, No. 3, pp. 393–405, April 1993.
- 20. T.S. Rappaport, S.Y. Seidel, K. Takamizsawa, “Statistical Channel Impulse Response Models for Factory and Open Plan Building Radio Communication System Design,” IEEE Transactions on Communications, Vol. COM‐39, No. 5, pp. 794–806, May 1991.
- 21. B.D. Woerner, J.H. Reed, T.S. Rappaport, “Simulation Issues for Future Wireless Modems,” IEEE Communications Magazine, Vol. 32, No. 7, pp. 42–53, July 1994.
- 22. S. Lin, D.J. Costello, Jr., M.J. Miller, “Automatic‐Repeat‐Request Error‐Control Schemes,” IEEE Communications Magazine, Vol. 22, No. 12, pp. 5–15, December 1984.
- 23. J. Kennedy, M.C. Sullivan, “Direction Finding and “Smart Antenna” Using Software Radio Architectures,” IEEE Communications Magazine, Vol. 33, No. 5, pp. 62–68, May 1995.
- 24. M. Schwartz, W.R. Bennett, S. Stein, Communication Systems and Techniques, McGraw‐Hill Book Co., New York, 1966.
- 25. T.S. Rappaport, Wireless Communications, Principles and Practice, Second Edition, pp. 380–394, Prentice‐Hall PTR, Upper Saddle River, NJ, 2002.
- 26. W.C. Jakes, New Techniques for Mobile Radio, pp. 326–330, Bell Laboratories Record, New York, December 1970.
- 27. L.W. Couch, Digial and Analog Communication Systems, Fourth Edition, Macmillan, New York, 1993.
- 28. R.C.V. Macario, Cellular Radio: Principles and Design, p. 207, McGraw‐Hill, Inc., New York, 1993.
- 29. R. Price, P.E. Green, “A Communication Technique for Multipath Channels,” Proceedings of the IRE, Vol. 46, pp. 555–570, March 1958.
- 30. M.K. Simon, J.K. Omura, R.A. Scholtz, B.K. Levitt, Spread Spectrum Communications, Vol. II, Chapter 1, “Coherent Direct‐Sequence Systems,” p. 46, Computer Science Press, Inc., Rockville, MD, 1985.
- 31. R. Price, “The Detection of Signals Perturbed by Scatter Noise,” IRE Transactions on Information Theory, PGIT‐4, pp. 163–170, September 1954.
- 32. I.S. Gradshteyn, I.M. Ryzhik, Table of Integrals, Series, and Products, Corrected and Enlarged Edition, by A. Jeffrey, p. 305, No. 3.312‐1, and p. 948, No. 8.380‐1, Academic Press, New York, 1980.
- 33. G.A. Korn, T.M. Korn, Mathematical Handbook for Scientists and Engineers: Definitions, Theorems, and Formulas for Reference and Review, Second Edition, Section E‐3, p. 973, No. 3, McGraw‐Hill Book Company, New York, 1968.
- 34. G.A. Korn, T.M. Korn, Mathematical Handbook for Scientists and Engineers: Definitions, Theorems, and Formulas for Reference and Review, Second Edition, Section E‐3, p. 977, No. 38, McGraw‐Hill Book Company, New York, 1968.