
CHAPTER ONE
WHY DRAW?
Great digital products start with great design. A great design isn't created in a vacuum. It takes time, research, and the unique perspective of many contributors along the way. I've always viewed the design process as a form of problem solving, and as technology advances, the problems become more complex. As a result, our teammates from all functional areas are participating in this process, whether they realize it or not.
Throughout this process, drawing is the key method for developing, testing, and collaborating on new ideas, and there are several benefits to including drawing in your product development process, as illustrated in the mind map in Figure 1.1.

Drawings attract people to an idea. It's true that a picture is worth a thousand words, and drawing has withstood the test of time, having been used as an effective communications tool for tens of thousands of years. This isn't an exaggeration. Figure 1.2 is a recreation of a drawing from the rock shelters of Bhimbetka. Some of the drawings in these shelters are considered to be 30,000 years old. In today's digital age, drawing is not only still relevant but needed more than ever.
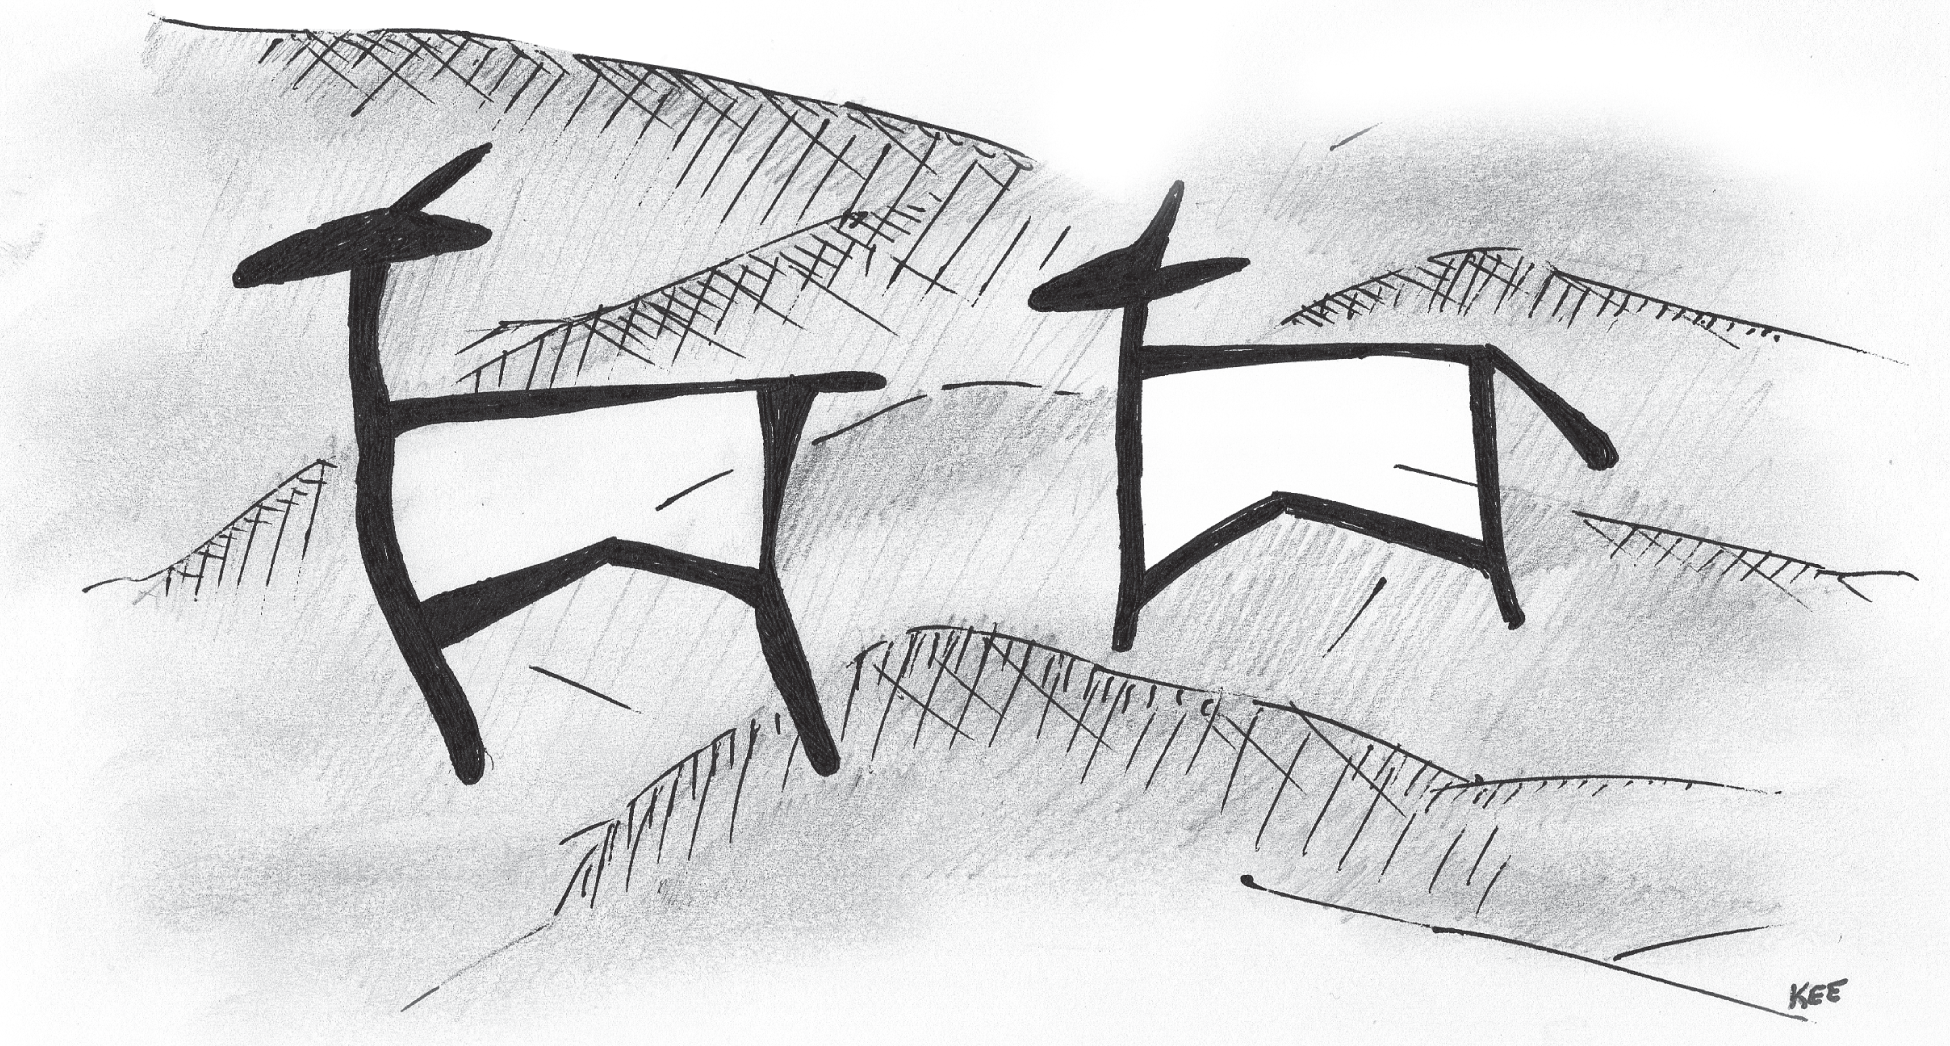
Source: Based on Bhimbetka drawings (Kent Eisenhuth)
Drawing is a quick and easy way to start putting form to an early idea. Let's go back to our original mind map of the benefits of drawing and further examine the three main types of benefits that come from including drawing in your product development process.
EXPLORE AN IDEA
Drawing is a low-risk exercise that allows you to rapidly work through many concepts. Early in the process, I usually start with some quick doodles. The focus on quantity over quality helps me clear out initial biases, and it forces me to think of alternate solutions. It brings me closer to the problem at hand, because thinking about alternative ideas causes the creative juices to flow.
Usually my first few ideas are bad before they're even penned. It's usually my fourth, fifth, and sixth doodles that represent ideas that begin to hold water.
I'm not alone in this line of thinking. As my former professor David Bullock used to say, there's nothing quite like developing an idea through mind, hand, and paper. Putting a multitude of ideas down on paper instead of focusing on the first thing that comes to mind leads to a better solution. Breadth in thinking enables you to discover connections between two seemingly disconnected ideas, which can lead you to focusing on the right answer.
In doing this, I found that it's important to get the bad ideas down on paper first so I can open up the headspace to focus on other, more thoughtful ideas. Most of my doodles have a long-standing date with the trash can, and they never see the light of day. They're merely chicken scratch and that's okay. I'm the only one who has to understand them at this point in the process. Once seeing the idea on paper, I can better understand why it might not work, learn from it, and move on to a better idea. I learn a lot from these quick doodles. In Figure 1.3 you can see some quick doodles I created to help me explore some ideas for visualizing an organizational structure within a company.

At one point, I was working on a website that would shed light on the digital divide in America. Our goal was to highlight segments in the American population that live in urban and rural areas alike. We wanted to spotlight critical issues affecting these areas that were caused by a lack of high-speed Internet access.
The first goal was to compare the two categories. To do this, the first and most obvious way was to show two tables side by side as drawn in Figure 1.4. One table would list all the urban counties, their populations, and the number of people without Internet access. The second would focus on the rural counties and do the same. During this process, I knew I wanted to get the obvious ideas down on paper first.

Once I was able to get the obvious down on paper, I was able to think more clearly about the information we wanted to share and how it would support the underlying story. As a result, I started to think about how different charts and graphs might be used to display the information in a more insightful way.
For example, I explored how a graph might help us compare access rates across the two categories. Additionally, I wanted to explore where the most affected people are located. Finally, I wanted to see how resulting issues affected the populations in each category. My later explorations, as depicted in Figure 1.5, represent concepts that uncover more of these insights. I was even able to explore a few experimental ideas just so that I could start the right conversations with my teammates and project stakeholders.
Drawing enables you to quickly explore alternate, possibly better ways to solve the problem at hand. It can help you understand when and why you should break the rules of your company's underlying design guidelines and not just use an out-of-the-box component available to you.
Drawing can help you intimately connect with the problem you're trying to solve and explore a range of solutions that provide a range of benefits to your product's users. Too many times this part of the process is overlooked, and it shows in the end result. Product teams should never be happy with the status quo. We need to push the boundaries of our work. Let me ask you this, Do you want to create a product that meets expectations or exceeds them?

GAIN A SHARED UNDERSTANDING
Drawing is essential to comprehension. A picture will resonate with your audience more than a long explanation. Remember, the earliest forms of communication were drawings. Early written languages often used pictograms to capture history, ideas, and concepts. With the growing use of emojis and pictures in our text communications, it almost feels like we're getting back to that.
Recently I had a chance to catch up with Professor Dan Boyarski, a professor emeritus at Carnegie Mellon University. During our chat, he was describing a guest lecture he gave to a class at CMU's business school. Before he started his lecture, he tried to engage the business students by asking them to discuss a project they were working on. For this project, both individuals and teams were working on solving complex business problems. Professor Boyarski asked if anyone wanted to describe their problem.
An individual stood up by his seat and spent about two to three minutes explaining his project. At the end of it, Professor Boyarski asked the class if they all understood the problem and if it was clear. He explained that most of the students were quiet and didn't really respond.
Another volunteer stood up and asked if he could use his chair as a visual aid. He moved to the center aisle in the lecture hall and explained the problem his team was trying to solve. He went on to explain that a lot of people drive to work. Once they're at the office, their car sits for hours in a lot. His team was wondering how people without cars could use the idle cars to drive to meetings and other events out of the office. Each time he referred to the parked car, he pointed to the chair. At the end of his explanation, Professor Boyarski asked the business students if they understood the problem. This time several students nodded, and when asked why, the students answered, “Because he used his chair.”
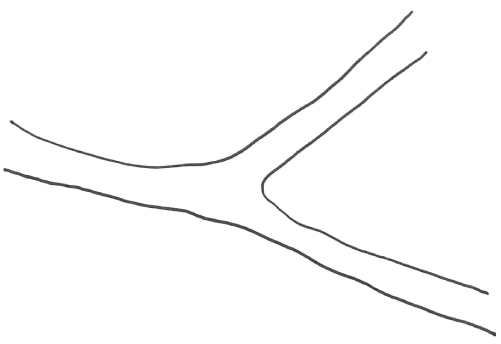
As the story goes, Professor Boyarski asked a third group to explain the problem they were solving, but this time use the available whiteboards in the room to explain it. A volunteer from this group described her group's project. She explained how they were looking at the barges going up and down the three rivers surrounding Pittsburgh. As she began to speak, she drew lines representing the three rivers as depicted in Figure 1.6.
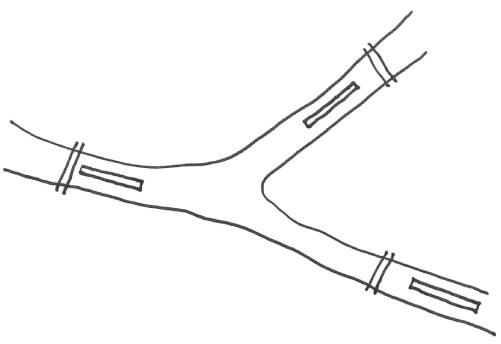
Then she described how there are locks located on each river. As she was talking, she drew locks across each of the three rivers. She described how barges traveling in each direction have to travel through these locks. She drew boxes representing the barges at each lock station as highlighted in Figure 1.7.
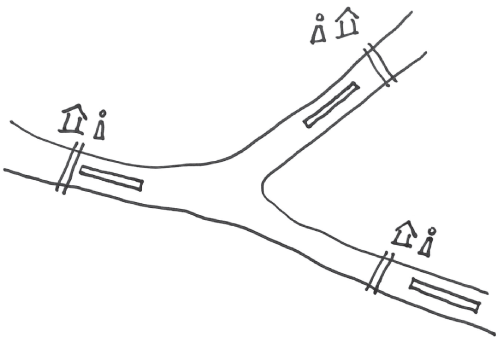
She went on to describe how each lock includes a little building, so she drew huts to represent the buildings. In each building there are a few people that manage traffic through the lock. This is necessary since you can only let one barge pass through the lock at a time. She drew people next to each of the huts as depicted in Figure 1.8.
She said, “Our project is to look at an efficient and cost-effective way for these people to talk to each other as they control barge traffic on the rivers.” She drew lines connecting all the people across the different locks, shown in Figure 1.9.
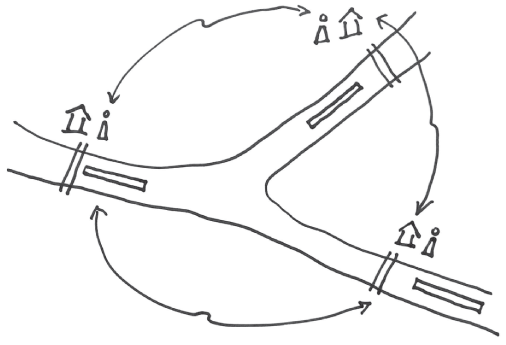
Once she put down her marker, the audience applauded. When Professor Boyarski asked the business students why they applauded, they described how the student told a story through building a drawing in a way that they could all quickly understand the problem at hand. Instead of talking about the problem, she showed it.
This student used drawing to help her colleagues understand the problem and opened up the door for ideas and collaboration.
IMPROVE COLLABORATION
In addition to using it as a tool to aid comprehension, we use drawing to build on each other's ideas. As design thinking becomes a mainstream practice, we find ourselves making key product decisions at the whiteboard. At some companies, design thinking is the centerpiece of the product development process. At Google, we use design sprints to create solutions for complex design problems. Our cross-functional teammates spend a lot of time drawing and ideating with us designers. Key product decisions are made during these sessions, and drawing is the main collaboration tool used to ideate and build consensus across our teams. It's a low-risk activity that drives alignment on an idea before a lot of time, resources, and work are invested in it. I'll share more on this later on.
ANYONE CAN DRAW
Drawing is a means to an end. Your goal is not to create the best drawing, it's to contribute to the best possible outcome for your team's product. But even with this in mind, why is drawing so intimidating?
According to Joseph Biondo, FAIA, professor of architecture at Lafayette University and author of House Equanimity, we stop drawing at an early age. As Professor Biondo explains, when we were children, our peers, parents, and teachers started providing feedback on our early and primitive drawings. Because of this, we limited our skills and crushed our creative spirit, and in most cases, we gave up. This is why the majority of us have the drawing skills of a young child. As far as this book is concerned, our drawings only have to be good enough to hang up on our kitchen refrigerator, or “refrigerator museum” as he puts it.
By not focusing on creating the perfect drawing, you'll free up the headspace to focus more on the idea you're trying to communicate, and you'll automatically become better at drawing. Would you like to see this in practice? Let's try something out. Grab a sheet of paper and a pen.
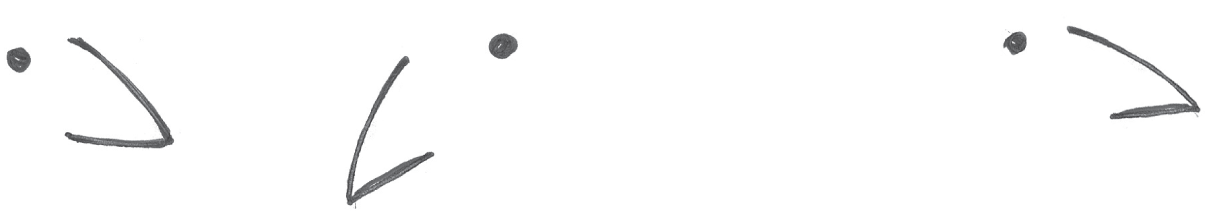
Draw a few quick scribbles. You don't have to think about it. Just do it. Figure 1.10 provides a few example squiggles to get you started.
Next, can you draw a wedge and a dot as depicted in Figure 1.11? Try it out.
Add a dot and a wedge shape to each of your scribbles and voilà! You just drew a flock of birds! Figure 1.12 provides a few examples.

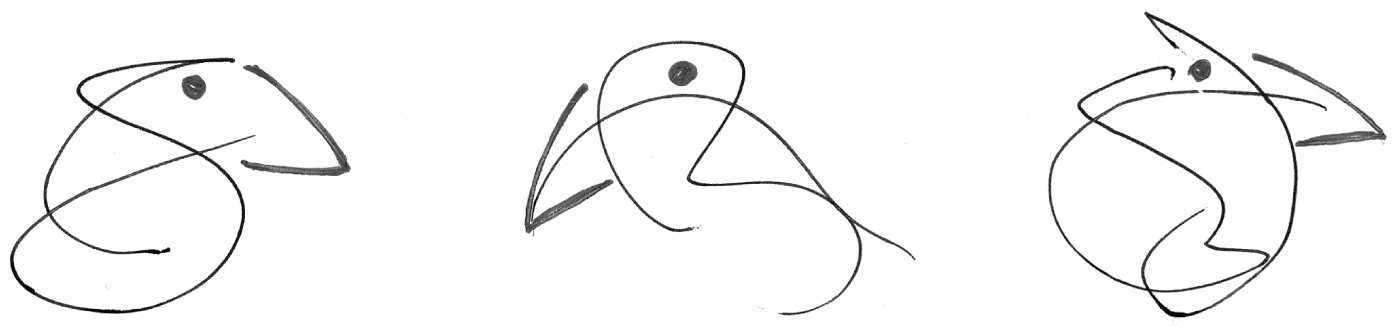
Not sure how to turn your scribble into a bird drawing? You might have to be creative in how you add your wedges. Check out Figure 1.13 for some inspiration. Sometimes a picture frame helps too!

So what do you think? Did it work for you? This exercise is called Squiggle Birds, and it is an example of a warm-up exercise I've used during cross-functional design workshops to get everyone in the right mood to start drawing and exploring new product ideas. Not only is this a great warm-up exercise, it's a good method for proving that anyone can draw. Thank you to my friend, mentor, and fellow Googler Vaishali Jain, who introduced me to this activity years ago.
If you're on a plane heading across the United States to your next meeting, you should be able to vastly improve your drawing skills before you land. You can even start practicing the ideas and concepts described in this book and draw along with me. By doing this, you'll supercharge the collaboration skills you'll be using in your upcoming meeting.
RIGHT TIME AND PLACE
Before we go any further, let's take a minute to acknowledge something. Drawing has its time and place. Doodling and drawing are fine tools to employ at any point in your design process. That said, there are times where it works better than others. Here are a few instances when drawing can lead to a great outcome.
In the Beginning
I rely on drawing very early in the design process. It works really well when we're just starting to give form to solutions to a large, ambiguous problem. I'll draw a mind map or a diagram that helps me organize my thoughts and understand the problem space. I'll draw a process diagram to help me understand the journey of a user and to better empathize with them.
Once I have a few ideas in mind, I'll use drawing to explore a range of ways in which a product can solve the problem at hand. Usually this is a visualization concept or a flow of screen proposals. I'll explore conservative and edgier ideas alike. It's typical for a designers to develop 30 or more drawings per day during this phase of the process (Buxton 2007, 160). At this point in the process, it's all about exploring as many ideas as possible. It's a low-risk activity after all.
Once I have some of these big ideas down on paper, I usually include another designer and researcher in my process. I like to sketch with them so we can build on each other's ideas. It's also a good early sanity check for me. My sketches are typically gestural and leave a lot to the imagination, and that's by design. I'm trying to invite others to build on my ideas. I've found some of my best design work has started in sketching sessions with one or two other colleagues.
During Workshops
As previously mentioned, drawing is an essential collaboration tool. Sometimes collaboration takes place in the form of design sprints and workshops. Carolyn Knight and Steve Hassard are two design sprint leaders at Google. If you're not familiar with design sprints, it's essentially a version of an extended design workshop. Carolyn and Steve have sprinted with countless teams inside and outside of the company. One thing they confirmed is that drawing is essential to the sprint process. In fact, it fits into most stages of the sprint process. You may already know this if you're familiar with the Google Ventures design sprint process and the book Sprint, How to Solve Big Problems and Test Ideas in Just Five Days by Jake Knapp, John Zeratsky, and Braden Kowitz (Simon & Schuster, 2016).
According to Carolyn and Steve, drawing is key to many aspects of the design sprint, starting with the day one icebreaker activity. Icebreakers are a good way to break down the barriers to drawing. As the sprint progresses, they are invaluable to get engineers into drawing. For the people who aren't designers in the room, an activity like this pushes them to where they need to be.
As the workshop continues, the drawings help people understand which seemingly disparate ideas can neatly fit together. I've also been involved in countless sprints and workshops. During these activities, it's really interesting to see the cross-pollination of ideas and the consensus forming around one or two big ideas.
According to Carolyn and Steve, some form of drawing is used in nearly every sprint, and seeing these drawings enables people to better understand how the pieces of an idea best fit together. In this case, drawing is a magical tool that enables this to happen. It's amazing to see great ideas unfold in these sessions, and it has been a go-to method for my own design process.
To Facilitate Conversations
Drawing can also enable you to facilitate a conversation on a complex topic as discussed in the earlier story of Professor Boyarski's lecture (Figures 1.6 through 1.9). It's a way of informally showing and not telling. When I worked in consulting, I applied design to many complex business problems.
I remember working with a large logistics and truck rental company. We were helping them rethink the driver experience. During a few informal discussions with key executives, we were sharing our research and findings. The conversation was becoming very complex, and I found the group was getting lost in thought. People's eyes were glazing over and others were just blindly arguing their points.
As a result, I started a mind map of our ideas. Keep in mind, whiteboarding was not part of the culture of this particular client. At the time, I thought I wasn't adding any value to the conversation at hand, and I was just doodling some nonsense on a whiteboard. During the conversation, the executive team started pointing to my sketch and referencing it in their conversation. At one point, the president of the client's logistics division got out of his seat and redrew most of my drawings. At the time, I was mad at myself for not understanding the problem space.
During a quick break in the conversation, my mentor, Matthew Bartholomew, who had witnessed the scene, explained that I shouldn't be mad at myself and that it was a big deal for these people to start drawing on top of my mind map. Apparently this was something he had never witnessed in a meeting before.
When the conversation continued, other executives followed suit. It was amazing to see how the other people started adding to my drawing and using it as a communications tool for facilitating and organizing their thoughts. What I originally thought was nonsense turned out to add a lot of value.
This experience helped me realize that drawing is such a versatile tool. I also realized that I needed to brush up on my showmanship at the whiteboard, because I planned on doing this more often—especially for those that don't consider themselves “whiteboarding types.”
Unbuttoning the Process
Digital designers and producers, really anyone working in User Experience (UX), love a good process. Sometimes these processes become too buttoned up. It's important to have fun, and drawing is a way to do so. Sometimes a few quirky doodles give your work the personality it needs. Who knows? Maybe that squiggly bird you drew earlier will find its way into your next design presentation.
Having fun with drawing is a great way to unbutton the process and enable your colleagues, partners, and stakeholders to loosen up and join in on the creative process. When we're all having fun, we do our best work.
Eliciting the Right Kind of Feedback
If the process is done right, you'll receive a lot of constructive feedback from your team. The low fidelity of a drawing implies that your idea isn't fully baked and that you're looking for feedback. When designers show high-fidelity computer-generated mockups, the rest of the team is more likely to focus on the finer details, and they don't provide feedback on the foundational idea you're trying to build upon.
A few years ago, I was working on redesigning a very prominent cloud product. We were rebuilding the experience from the ground up. Early on, we used drawing to explore many new ideas, capture the product's information architecture, and explore some new patterns for navigating the product. As I was presenting the drawings to the stakeholder team, a very prominent engineering director interrupted me just to thank me for showing drawings and nothing more. After this, I noticed members of his team perking up and actively providing feedback and building on our ideas. It was a great moment, although I was surprised that the team hadn't been sharing preliminary drawings or process work in the past.
Challenging the Status Quo
For this last point, I'm going to get on my soapbox for a minute. If you're a designer, please make note of this. Drawing unlocks a part of the process that has been getting lost in recent years. Yes, this is true, and please hear me out on this one.
More often than not, the design of most digital products is based on some sort of component library. It's very tempting to jump right into using your library's predefined patterns, components, and sticker sheets. It's easy for designers to fall into the rut of jumping into creating high-fidelity designs by using canned templates, patterns, and designs already provided. Some designers thrive on this, and they insist this is the way to go. While that might work for very minor additions to mature products, it doesn't work when starting a new challenge. In my opinion, opportunities are missed when this happens.