In presentations, you’ll often find it useful to present data in tables. A table’s rows and columns make it easy to present complex information in a simple way. Examples of such data would be quarterly financial results, a performance comparison of two or more products, or even a simple list.
PowerPoint provides an excellent set of tools for creating and formatting tables and their contents. These tools allow you to make even dry financial data visually interesting. Using object builds, you can also make parts of your table animate onto the screen, allowing you to build your points one step at a time. You’ll find more information about using animation in Chapter 10.
In this chapter, you’ll learn how to use PowerPoint to create and modify a table, and ensure that tables and their content look the way you intend.
Tables consist of rows and columns. Rows are the horizontal divisions of the table; columns are the vertical divisions. A row and a column intersect to form a cell, which is where the content of the table goes. You can put either text or a graphic (or both) into a cell.
When you add a table to a slide, PowerPoint allows you to create a table with whatever number of rows and columns you want. After the table is added, you can modify the table and its contents by changing the table’s graphic design or the number of rows and columns, formatting the text, modifying table and cell borders, and changing the size of the table.
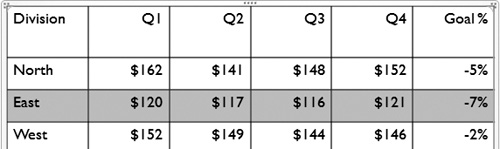
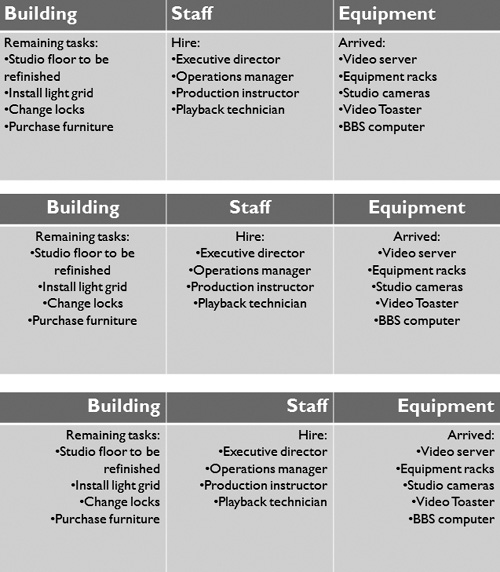
You’re probably familiar with using tables in word processors, such as Microsoft Word. Using tables in PowerPoint is similar, with one important caveat: tables in presentations should be simpler than tables that you would use in a printed document. Too much information in a table can overwhelm the viewer (Figure 8.1).

Procedure 8.1. To create a table:
In the Normal View pane, select the slide on which you wish to create a table, or create a new slide by choosing Home > Slides > New Slide.
If you created a new slide, choose an appropriate slide layout using the Layout pop-up menu in the Home > Slides group.
Because you want to leave enough room on the slide for the table, you’ll probably want to choose a slide master such as Blank, Title and Content, or Title Only. PowerPoint attempts to place tables so that they will fit properly on the slide, so, for example, if you choose the Two Content layout, adding a table will create a small table in one of the content boxes on the slide.
If your layout has a content box, click its table icon (Figure 8.2).
The Insert Table dialog appears (Figure 8.3).
Choose the number of rows and columns for the table, then click OK. The table appears on your slide.
or
If your layout does not have a content box, choose Insert > Tables > Table.
The Table button is a pop-up menu that allows you to select the number of rows and columns by dragging (Figure 8.4). Drag to the table size you want, then release the mouse button.
The table appears on the slide (Figure 8.5). To increase the number of rows and/or columns, see “Inserting Rows and Columns,” later in this chapter.


To work effectively with a table, you’ll need to know how to select its elements. You can select an entire table; one or more rows and columns; an individual cell or multiple cells; and nonadjacent cells, rows, or columns.
Procedure 8.2. To select the entire table:
Click once anywhere in the table.
Eight selection handles appear at the edges of the table; use them to resize the table, as described later in the chapter (Figure 8.6).
Procedure 8.3. To select a single cell and its contents:
Move the mouse pointer near the left edge of a cell until the cursor changes to an arrow pointing to the upper right, then click (Figure 8.7).
Procedure 8.4. To select just a cell’s contents:
Hold down the Control key, position the mouse pointer in the cell and to the left of its contents, and click.
Procedure 8.5. To place a text insertion point in a cell:
Click inside a cell. A text insertion point appears inside the cell (Figure 8.8).
When the insertion point appears in a table cell, you can move the cursor between table cells by pressing Tab.
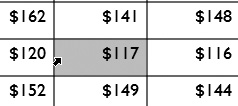
Procedure 8.6. To select a contiguous group of cells:
Click in the first cell, and drag to the last cell you want to select.
or
Click the first cell, hold down the Shift key, then click the last cell.
The selected cells will be highlighted in blue (Figure 8.9). You can use these techniques to select any rectangular group of cells, be it a row, column, or any other area of the table.
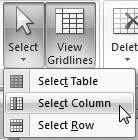
You can also use the Table Tools > Layout > Table > Select to select a row or a column (Figure 8.10). Click in a cell, then make a choice from the pop-up menu under the Select button. You can also use this to select the entire table.
Procedure 8.7. To move or copy the contents of one cell into another:
To move a cell’s contents, select the contents of a single cell, hold down the mouse button for a moment, then drag the contents to another cell.
or
To copy the cell’s contents, select the contents of a single cell, hold down the mouse button for a moment, press the Control key, then drag the contents to another cell.
As you drag, you’ll see the cursor change. The cursor looks different, depending on whether you are moving or copying cell contents (Figure 8.11).
When you reach the destination cell, release the mouse button.
The contents of the first cell will be moved or copied into the second cell.
✓ Tips
The cell contents you are dragging will be appended to the contents of the destination cell, if any.
If you select multiple cells (like a row or a column) and drag, the contents of all the cells will be moved to the destination cells. If you select multiple cells and Control-drag, the contents of all the cells will be copied into the destination cells.
You can resize tables horizontally or vertically, and also make columns wider and rows taller.
Procedure 8.8. To resize an entire table:
Click anywhere in a table to select it.
The selection handles will appear at the edges of the table (see Figure 8.6).
Drag one of the selection handles. To widen the table, drag the handle on the right edge of the table; to make the table taller, drag the handle on the bottom edge of the table; and to make the table grow in both directions simultaneously, drag the handle at the bottom-right corner of the table.
Procedure 8.9. To resize a row or column:
Click once outside the table to make sure that no table element is selected, then click once in the table to select it.
As you hover your cursor over a border between two rows or two columns, it will turn into a double-headed arrow (Figure 8.12).
Drag the border to resize the row or column.

Procedure 8.10. To distribute row heights or column widths evenly:
Select a table that has some rows taller than others, or some columns wider than others.
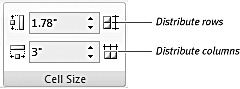
Depending on what you want to do, choose Table Tools > Layout > Cell Size > Distribute Rows, or choose Table Tools > Layout > Cell Size > Distribute Columns (Figure 8.13).
PowerPoint will even out the space between rows or columns, depending on what you chose (Figure 8.14).

PowerPoint makes it easy to remove tables, cell contents, rows, or columns.
Procedure 8.13. To delete rows:
Select one or more rows.
Press Backspace.
or
Choose Table Tools > Layout > Rows & Columns > Delete, then choose Delete Rows from the pop-up menu (Figure 8.15).

PowerPoint allows you to add rows or columns to your table, either by adding rows or columns to the overall table, or by inserting rows or columns at a selected spot in the table.
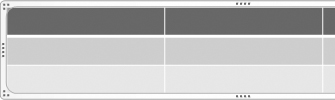
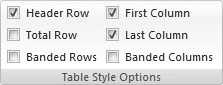
PowerPoint usually includes a header row at the top of your table. A header row is formatted differently than the rest of the table to highlight the information in the headers (the exact formatting is specified by the table design). You would typically use the contents of a header row as labels for information in the rest of the table.
You can also have PowerPoint automatically apply different formatting for three other parts of the table:
The total row is the bottom row of the table.
The first column is the leftmost column in the table.
The last column is the rightmost column in the table.
Procedure 8.15. To specially style one row or column:
Click the table’s border to select it.
The Table Tools contextual tab appears, with two subtabs: Design and Layout.
In the Table Tools > Design > Table Style Options group, choose one or more of the following (Figure 8.16):
Header Row
Total Row
First Column
Last Column
Banded Rows makes the background color of alternating rows lighter and darker, to improve readability.
Banded Columns makes the background color of alternating columns lighter and darker, to improve readability.
PowerPoint styles the rows or columns you chose.
✓ Tip
Sometimes the table design overrides the settings in the Table Style Options group. Choose a different table design, if needed. See “Applying Table Designs,” later in this chapter.
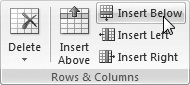
Procedure 8.16. To insert rows in a table:
Choose Table Tools > Layout > Rows & Columns, then click either Insert Above or Insert Below (Figure 8.17).
PowerPoint inserts an empty row above or below your selection, depending on which button you used. This will also increase the height of the table.
✓ Tip
You can also right-click and choose Insert > Insert Rows Above or Insert > Insert Rows Below from the resulting shortcut menu (Figure 8.18).

Procedure 8.17. To insert columns in a table:
Click anywhere in a column.
Choose Table Tools > Layout > Rows & Columns, then click either Insert Left or Insert Right.
PowerPoint inserts an empty column before or after your selection, depending on which button you used. Unexpectedly, this does not increase the table’s width.
✓ Tips
As with rows, you can right-click and choose Insert > Insert Columns to the Left or Insert > Insert Column to the Right from the resulting shortcut menu (Figure 8.18).
Though the shortcut menu choices refer to “Rows” and “Columns,” those menu choices only add one row or column at a time.
PowerPoint lets you merge cells, which is combining two or more adjacent cells into one larger cell, or you can split a single cell into two or more cells, either vertically or horizontally.
Procedure 8.18. To merge cells:
Select the cells you want to merge.
Choose Table Tools > Layout > Merge > Merge Cells (Figure 8.19).
or
Right-click the selection and choose Merge Cells from the contextual menu.
The cells merge (Figure 8.20).


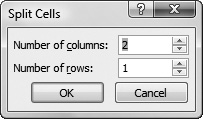
Procedure 8.19. To split cells:
Choose Table Tools > Layout > Merge > Split Cells (Figure 8.21).
or
Right-click the selection and choose Split Cells from the contextual menu.
The Split Cells dialog appears (Figure 8.22).
Set the number of rows and columns you want the cell to split into, then click OK.
The cell splits as you command.

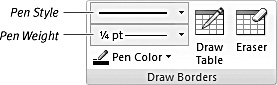
To dress up your tables, PowerPoint allows you to style and modify the borders between cells. You can change a border’s color, line weight, or line style. If you would like to create or eliminate a border, PowerPoint also provides border drawing and erasing tools.
Procedure 8.20. To style cell borders:
Click anywhere in a table to select it.
The Table Tools contextual tab appears in the Ribbon.
In the Table Tools > Design > Draw Borders group (Figure 8.23), do one or more of the following:
From the Pen Style pop-up menu, choose the kind of line you will draw (Figure 8.24).
Select the thickness of the line from the Pen Weight pop-up menu (Figure 8.25).
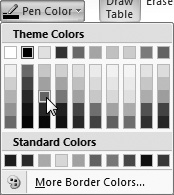
Set the color of the line from the Pen Color pop-up menu (Figure 8.26).
After you’ve made your selection from the pop-up menus, the Draw Table button highlights and the cursor turns into a pencil.
Use the pencil cursor to draw over one of the existing borders.
The border changes to match the settings you made in the Draw Borders group (Figure 8.27).


Procedure 8.21. To draw cell borders:
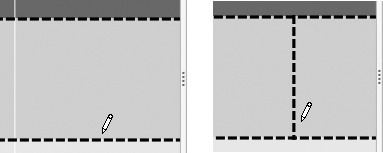
You can also use the Draw Table button in the Draw Borders group to add additional borders (and therefore to split table cells). Begin by setting the pen style, weight, and color.
The Draw Table button highlights and the cursor turns into a pencil.
Draw a line within a cell to split it into two rows or two columns (Figure 8.28).
Procedure 8.22. To erase cell borders:
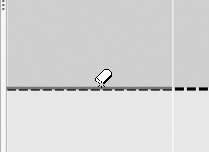
If you want to subtract a border between two table cells, choose Table Tools > Design > Draw Borders > Eraser.
The Eraser button highlights and the cursor turns into an eraser.
Click the Eraser on the cell border you wish to eliminate.
The border disappears (Figure 8.29). Because you have eliminated a border between cells, the cells merge.
Once you have the layout of your table set to your liking, you can turn your attention to the formatting of the text and graphics within the table. Much of the time, this will be done for you, because PowerPoint’s table styles are part of the presentation’s overall design theme. When you assign a theme (see Chapter 2 for more on themes), PowerPoint supplies a number of table styles that complement the rest of the theme’s background, font, layout, and chart styles. You can, of course, override the program’s design choices if they aren’t to your liking. Like most other style choices in PowerPoint, when you apply a table style, you choose from a gallery, and PowerPoint displays a live preview of your choice.
Procedure 8.23. To set a table’s design:
Click anywhere in a table to select it.
The Table Tools contextual tab appears in the Ribbon.
In the Design tab of Table Tools, hover your mouse cursor over the styles in the gallery within the Table Styles group (Figure 8.30).
The table shows a live preview of the style thumbnail you are hovering over.
Click the style thumbnail to apply that style to the table.
The table changes.
or
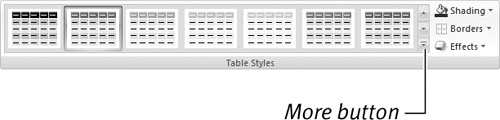
To see more styles, click the More button in the gallery.
The gallery expands to show all the styles (Figure 8.31). Click a style thumbnail to apply that style to the table.

You can set alignment for the contents of all of the cells, and there are separate controls for horizontal and vertical alignment, and also for text direction. The alignment controls work for text within the cell, but not graphics, which float in a separate layer from the table. Working with cell backgrounds, another table attribute, will be covered in “Adding Cell Backgrounds and Graphics,” later in this chapter.
If you want to apply alignment to the contents of a single cell, or group of cells, you must select the cell or cells first. In addition to text alignment, you have the same control over the text in tables that you do with any text in PowerPoint. See Chapter 4 for more information about text handling in PowerPoint. You can also control how large the margins are within table cells.
Procedure 8.24. To set alignment in cells:
Select the cells to which you wish to apply text alignment.
Use the alignment tools in the Table Tools > Layout > Alignment group to set your desired text alignment (Figure 8.32). You can set horizontal alignment (Figure 8.33) and vertical alignment (Figure 8.34) separately.

Procedure 8.25. To set text direction:
If you want to rotate text within a cell, you can set the text direction. Begin by selecting the cell or cells where you want to rotate the text.
Choose Table Tools > Layout > Alignment > Text Direction, then make a choice from the resulting pop-up menu.
The preset choices are Horizontal, Rotate all text 90°, Rotate all text 270°, or Stacked (Figure 8.35).
The text in the cells changes as you command.

Procedure 8.26. To apply and change cell margins:
Select the table, or if you only wish to make changes to a particular set of cells, select those cells.
Choose Table Tools > Layout > Alignment > Cell Margins, then make a choice from the resulting pop-up menu.
The preset choices are Normal, None, Narrow, or Wide (Figure 8.36).
The cell margins change.
(Optional) If you don’t like the cell margin presets, choose Custom Margins from the Cell Margins pop-up menu.
The Cell Text Layout dialog appears (Figure 8.37). Make changes in this dialog as needed, then click OK to lock in the settings.


Once you have set the overall table style, you can dress it up further. PowerPoint allows you to change the background color or texture for individual cells or for the whole table.
Filling cells with a background image is an excellent way to help give your table a slick, professional look. PowerPoint gives you four choices for cell backgrounds:
Shading puts a solid color in the cell background.
Picture puts an image in the cell background, shrinking the image to fit. You’ll also use this option for images you wish to place in a cell.
Gradient puts a smooth color blend in the cell background.
Texture puts an image into the cell background, but in contrast to the Picture background, tiles the image to fill the cell.
The benefit of using one of these background choices is that they will move with the table and adjust their positions within cells when you resize the table, which can save you a tremendous amount of time.
Cells (or the whole table) can also have effects, which are bevels, shadows, and reflections that make the cells stand out.
Procedure 8.27. To fill cells with a color, picture, gradient, or texture:
In Table Tools > Design > Table Styles > Shading, choose the type of fill—a color, Picture, Gradient, or Texture—from the pop-up menu (Figure 8.38).
Depending on your choice, you may be able to choose from a fly-out gallery. For example, Gradient gives you a variety of gradient fills from which to choose (Figure 8.39).
The table cell or cells are filled.
✓ Tips
When adding cell backgrounds, always keep in mind that the most important information in a table is the text in it, not the cell backgrounds. You don’t want to add cell backgrounds that will detract from the readability of the text in the table cells. That goes for the pattern, as well as the color, of the cell background. Remember that the data in the table needs to be easily read by the people in the back row of the auditorium.
Make sure that the cell backgrounds complement, rather than clash, with the rest of the slide. Again, you should evaluate patterns, as well as the colors.


Procedure 8.28. To apply a color or picture to a table background:
Choose Table Tools > Design > Table Styles > Shading > Table Background (Figure 8.38), then choose a color or picture from the fly-out menu (Figure 8.40).
If you chose Picture, the Insert Picture dialog appears. Navigate to the picture you want, select it, then click Open.
The color or picture you chose appears as the table background (Figure 8.41).


Procedure 8.29. To apply cell effects:
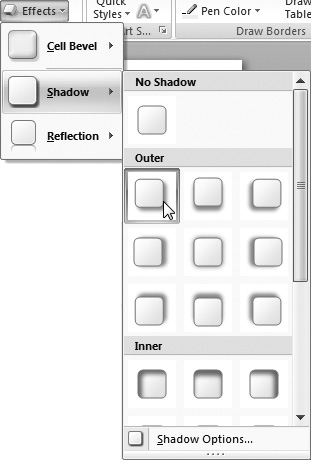
Choose Table Tools > Design > Table Styles > Effects, then choose an effect from the pop-up menu (Figure 8.42).
The effect is applied to the table.
(Optional) To modify the effect, right-click the table, then choose Format Shape from the shortcut menu. In the Format Shape dialog that appears, adjust the effect to your liking (Figure 8.43). When you’re done, click Close.
✓ Tip
Choosing Shadow Options from the pop-up menu in Figure 8.42 is another way to open the Format Shape dialog, set to the Shadow category, as in Figure 8.43.