
Understanding the measurement and analysis of mobile marketing campaigns
Setting up databases, profiles, and CRM systems
Collecting data and analyzing reports
Calculating return on investment (ROI)
Measuring and tracking the results of your marketing programs, including both your direct and mobile-enabled traditional marketing programs, is an essential part of your job as a marketer. Over the last few years, marketers have been put under a significant amount of pressure to demonstrate a return on investment for the organizational resources they consume. Return on investment (ROI) is the measurement of dollars received for every dollar invested. In other words, you need to show the value of your effort and how those efforts contribute to meeting the company's goals and objectives.
Mobile analytics provide valuable insights into the performance of your mobile campaigns. Mobile analytics refer to the process of measuring, monitoring, and tracking your mobile marketing campaigns. With mobile marketing analytics, you can
Track individual user participation in all your programs by time, frequency, location, and other measurements
Measure and compare all your mobile marketing campaigns, in some cases in real time, so that you can make immediate adjustments to your programs
Use data to calculate your ROI to see if you're making more than you spend (a positive ROI) or if you're losing money on your programs (a negative ROI)
This chapter shows you a number of ways you can collect information and analyze it to improve your mobile marketing programs.
Mobile analytics is the process of collecting data from your mobile marketing efforts so that you can compare a change in a single metric over time and compare multiple sets of data to each other. Mobile analytics impact your mobile strategy in two ways:
Analytics help you plan your mobile campaign strategy
Analytics help you evaluate the success of your strategy
To gauge your mobile marketing success, you need to analyze which parts of your strategy work and which parts don't. Measurable data collected for the purpose of analysis are often called metrics. A metric is any number expressed in a scale, used to quantify how much you have of something. (Think temperature in degrees Fahrenheit, or speed limits in miles per hour, for example.)
Marketers use metrics all the time in other media, especially digital, direct, and retail. Although you could track literally hundreds of metrics, Table 14-1 shows you a list of the main mobile campaign interactions and the metrics you should be prepared to track and analyze.
Table 14-1. Mobile Interactions and Associated Metrics
Interaction | Metrics Worth Paying Attention To |
|---|---|
SMS | Unique participants in a campaign |
Number of respondents, opt-ins, opt-outs, total churn (% of people who opt out compared to the total list) | |
Successfully and unsuccessfully delivered messages | |
Carrier participation and which mobile carriers drove the most participation | |
Participation by geography | |
Count of embedded URL visited | |
Average revenue per user (ARPU) | |
Total revenue per campaign | |
MMS | All the SMS metrics listed previously |
Number of unsupported devices | |
Mobile operator MMS policy rejections | |
Content downloads | Unique downloads |
Total downloads | |
Failed downloads | |
Total revenue | |
Unique visitors | |
Repeat visitors | |
Entry and exit points | |
Bounce rates (number of visitors who see only one page) | |
Number of page views | |
Geographic location of visitors | |
Devices used by visitors | |
Mobile operators used by visitors | |
Average time spent on a site, on a page | |
Conversion rate | |
Mobile advertising | Cost per impression (CPI) |
Cost per click (CPC) | |
Cost per conversion (CPC) or cost per acquisition (CPA) | |
Total number of click-throughs (the number of times an ad is clicked on) | |
Voice campaigns | Date and time of incoming calls |
Number of calls | |
Total minutes per call | |
Billable minutes | |
Average call length | |
Number of transactions per call | |
Revenue per call | |
Error messages processed | |
Mobile applications | Number of downloads |
Download count by handset type | |
Unique active users | |
Failed downloads | |
Time to download | |
Total revenue | |
Location of download | |
User reviews of your application | |
Time spent using application | |
Mobile e-mail | Click-through rate (CTR) |
Conversion rate | |
Open rate | |
Unsubscribe rate | |
Forwards and shares | |
Bluetooth and Wi-Fi | Total delivered sessions |
Total content downloads | |
Frequency and time spent per location | |
The type of phone interacting with the system | |
The mobile carrier used | |
Location access point by location |
The metrics in Table 14-1 are by no means an exhaustive list; they simply highlight some of the more prominent measures tracked.
Tip
Metrics aren't just about measuring success. In fact, just as often, metrics help you recognize that parts of your mobile marketing are not working, so you can fix them.
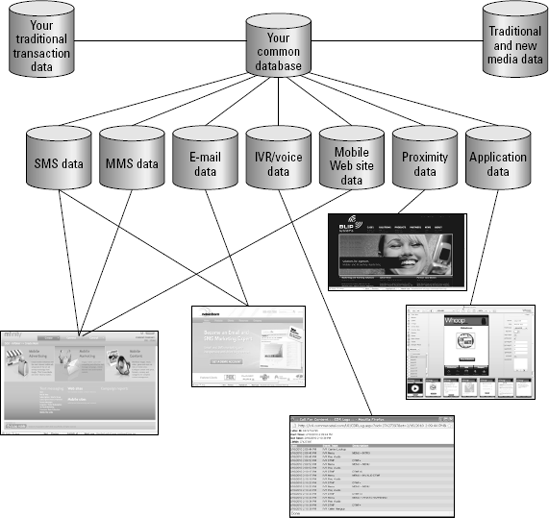
A mobile marketing database (see Figure 14-1) is simply a database that houses all the information about each and every mobile customer you have and all the campaigns and programs you run. A mobile marketing database allows you to link your mobile marketing campaign interactions with the people in your database and apply metrics to individuals and groups of individuals.
Tip
You'll probably end up working with a number of databases, depending on how many mobile marketing companies you work with. Many companies support multiple mobile media paths (see Chapter 1), but no one supports them all. For a specific setup of programs, a database is typically built and hosted by your mobile marketing application provider. Or, you may already have your own customer relationship management (CRM) system or database that you work with.
In any event, whether your mobile marketing database is hosted by your application provider, integrated with your CRM solution, or is some hybrid model, you need to set up your database files to accept the data you need to collect and analyze from each type of interaction.
The following sections show you the types of information to consider adding to your database for each customer or prospect who interacts with your mobile marketing campaigns.
Demography is all about studying populations; consequently, demographic data are the data points that detail a population's characteristics. You want to think about the various demographic data points you'll find helpful for your business (every business is different). Data you might consider including in your database include
Age (either in the form of a birth date or age range, for example, 14-24, and so on)
Sex (male/female)
Marital status (single, married, divorced, domestic partnership, and so on)
Number of children (zero, one, two, three, more than you can handle)
Level of education (high school, some college, college graduate, doctorate, life experience)
Occupation (there simply are too many to list — isn't that a great thing?)
Income (typically presented in monetary ranges, for example, $50,000-$75,000 per year)
Nationality (American, French, British, Chinese, and so on)
Geography (residence, place of work, or, if you're a road warrior, American Airlines, seat B17)
Note
In tech speak, all this data is commonly referred to as metadata, or "data about" something. When your engineer asks you, "What kind of metadata do you want to capture?" You can say, "I need demographic metadata — age, geography, and psychographic data (that is, information about your preferences, attitude, intention, and so on)." Now you're cooking!
You may wish to capture and organize psychographic data about members of your audience. Psychographic data is qualitative data used to measure an individual's lifestyle. Examples could include
You can include psychographic information in your database to help you describe and identify customers and prospective customers in more detail and to aid in developing promotion strategies designed to appeal to specific psychographic segments of the market for a product or service.
Preference data is data volunteered by members of your audience regarding their preferences, for example, their likes and dislikes (favorite food, music, and so on). Other preference criteria may include the days of the week and times the consumers prefer to be messaged or called, how many times the consumers are willing to let you contact them within a particular time frame (for example, ten times a month, but no more than three times per week).
Note
By setting up your database to include preferences information and using it appropriately, you have a much better chance of pleasing the customers and prospects who interact with your mobile marketing campaigns.
Behavioral data includes information about past behavior or expected behavior based on past interactions or predictions based on other data. Including behavioral data in your database can tell you whether someone is likely or unlikely to respond to a specific campaign. For example, a person with a behavioral profile that indicates procrastination may not respond to a limited time offer.
Tip
You can get some great mobile subscriber behavior data from comScore (www.comscore.com) and Nielsen (www.nielsen.com), two research firms that track user behavior on mobile phones.
Behavioral data is an emerging field in marketing. Talk to your application provider and connection aggregator to get a sense of what they're doing in this area or with whom they're working.
Location is a dynamic data point that can be used to adjust your interaction with members of your audience so that those interactions are contextually relevant to their location. For example, if they're browsing mobile Internet sites and your database knows their location, you can display location-relevant advertising or guide them to the nearest location. You can also track location in real time and use that information to deliver location-based messages when your customers give you permission to use their location data.
Syndicated data is consumer purchasing data compiled from individually scanned consumer transactions from thousands of purchase locations. The data is collected by market research firms, cleansed, and put into aggregate to protect the privacy of individuals. It's then used by marketers to better understand the purchasing behavior of their target audience. Marketers use syndicated to data to
Improve sales tracking of their products and their competitors.
Monitor marketing promotions and merchandising for both their own products as well as those of their competitors.
Determine which distributors are using their products.
Segment customers effectively, identifying their best and worse prospects.
Perform market basket analysis, understanding what other products are typically purchased at the same time as theirs.
Syndicated data can be very useful; in fact, it can often be better than data you collect yourself because it amasses information not just about your own client interactions but those of your competitors as well.
Warning
Although data and information collection may give you knowledge and power, with this knowledge and power comes great responsibility and liability. You must protect the data you collect. If you don't protect it (if you misuse it, or it gets in the hands of someone else), you may face many commercial and legal challenges. Seriously think through all the liabilities before you collect and use data. Be sure to consult your legal counsel. You can read more about the laws governing mobile marketing in Chapter 3.
After you've identified the types of customer and prospect data that you're going to collect and you've worked with your own internal team or mobile marketing application provider to build a database, you're ready to start populating the database, that is, loading it up with all the information about your campaigns and your customers.
The following sections show you how to collect profile information about your customers when they interact with your campaigns. We show you how to track the details of each interaction with your campaigns in the next section.
With SMS, you can collect some data automatically as well as request that participants of your campaigns provide the data. When a consumer opts into your campaign via SMS, the mobile marketing application captures the participant's mobile phone number. From this mobile phone number, your application provider can identify the following:
Previous participation in other programs you've run: You can match the number to see if the number has been used in other campaigns.
Wireless carrier: Discover which wireless carrier the subscriber is using.
Crude location: Using the country code and area code of the number, you can make a crude estimate of location (country, state, city, and time zone). This method should not be used for real-time location detection because it does not tell you where the person is, just where his phone was registered.
Porting history: Find out if the number has ever been moved from one wireless carrier to another.
Technical bits: Discover if the phone supports binary data (for example, pictures and video), text messaging, or WAP push. (WAP push is a method of delivering content and mobile Internet sites. Ask your mobile marketing application provider about this.)
Tip
Your mobile marketing application provider, connection aggregator, or even Neustar's Wireless Message Routing Service (WMRS) service (www.neustar.biz/interoperability/wmrs.cfm) can help you collect the preceding information.
In addition to the preceding data, the marketer can request the user to submit any number of different types of data points, including demographic, physiographic, and preference data via SMS. For example, you may ask the user to submit her birth date as an opt-in challenge if you're marketing a program not suitable for children. You simply need to make sure that your text messaging application supports the ability to collect the data you are asking for and in the manner you're asking for it.
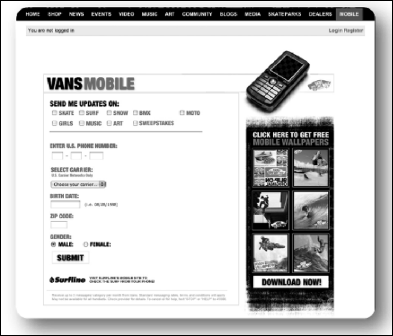
You can use Internet and mobile Internet browser forms or forms in an installed application to collect information from your prospects and customers by requesting that the visitor to the site complete the form. Upon submission, you capture the requested data.
For example, a leading marketer to youth retail markets, Access 360 Media, uses Web forms that can capture different consumer preference attributes, as shown in Figure 14-2.
Tip
You can use forms on mobile Internet sites, but be sure to keep them short. Mobile subscribers do not have the patience to complete long forms via their phones, so ask only the basics. If you need more info, augment the experience with another mobile (for example, voice) or traditional path (for example, the Internet). But be careful. Make sure you understand your audience. For example, not all demographics use all mobile technology, like the mobile Internet, so take care to understand your audience.
Note
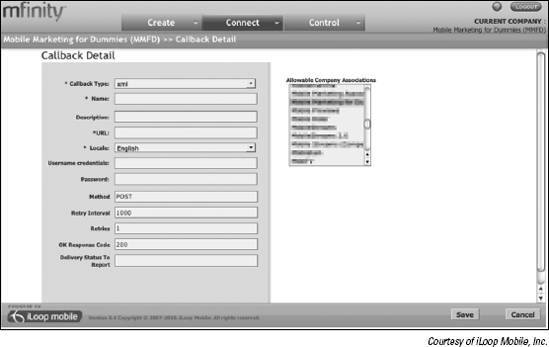
Be sure to ask your application provider if you'll be able to create your data schema and forms. Companies like iLoop Mobile have robust mobile customer relationship management elements that give you this capability.
There may come a time when you want to merge your mobile campaign data with that data stored in your company's customer relationship management (CRM) system. This is easy to do and typically can be handled in one of three ways:
Manually: You can ask your mobile marketing application provider to provide you a manual report (in Microsoft Excel or in an XML data structure) so that you can combine your data with that of the mobile marketing campaign database manually.
Via data feed: Your mobile marketing application provider should be able to give you access to an XML data feed that you can pull from on a regular basis (once a day, every five minutes — the timing depends on your application needs) so that you can combine your data with that of the mobile marketing campaign database automatically per the set schedule.
In real time: You can also ask your mobile marking application provider if it can pass you data in real time as your participants interact with the system (see Figure 14-3). For example, maybe you need to know immediately if someone opts out of your mobile marketing campaign so that you can update the other permission marketing management system in other parts of your company.
Your mobile marketing application is capable of tracking most, if not all, interactions a mobile subscriber has with it. That includes any calls, text clicks, snaps, scans, StarStars (**), pounds (#), presses, pictures taken, acceptances, submits, votes, requests, replies, and more.
Note
How this information is tracked and reported on, however, varies significantly by the type of mobile method you're using; moreover, you should consult with your mobile application provider prior to running your campaigns(s) to ensure the data you need (that is, the data you want to use to measure and report on the efficacy of your program(s)) is being tracked and retained.
You have your choice of a number of mobile analytics providers to track consumer interactions on your mobile Web sites and applications. For example, if you want to track interactions on your mobile Web sites, you can consider using Google Analytics (www.google.com/analytics). Google Analytics allows users get rich Web site information, and the account creation process is simple:
Go to
www.google.com/analytics/.Sign up for a new account (or use your existing account credentials).
Add a Web site profile.
You need to enter the URL of your Web site, give the profile an account name, and specify the time zone of your site. Also, provide the first and last name for the primary site contact person and agree to the terms and conditions.
After you've completed the preceding steps, you are asked to follow the tracking instructions.
After you've completed the preceding steps, you are asked to follow the tracking instructions, which basically means you copy a bunch of HTML code from Google. This code can then be pasted into your mobile Web site's code. The code acts as a sort of tag that Google can use to track the user's behavior on the site. You can ask your site designer or partner for help at this point. Google sends you an e-mail with the necessary information that you can simply copy and send to your designer — they really make it easy for you.
Click Save and you're done.
After you have the tracking code successfully copied, pasted, and saved into your mobile Web site's code, Google immediately starts tracking and monitoring your site. You can then log in to Google Analytics as often as you'd like to see how your site traffic is doing.
Bango has a similar process. See Figure 14-4 for a sample Bango mobile Web report.
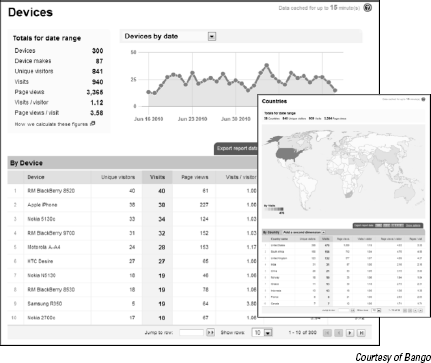
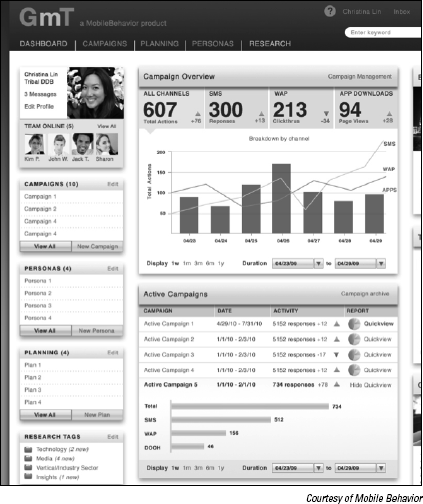
You can choose between a number of application provider reporting tools, including Flurry (www.flurry.com), Medialets (www.medialets.com), Motally (www.motally.com), Bango (www.bango.com), Omniture's SiteCatalyst (www.omniture.com/en/products/online_analytics/sitecatalyst), Mobile Behavior (www.mobilebehavior.com), and others. See Figure 14-5 for an example of Mobile Behavior's reporting tool.
Tip
If your mobile application provider won't let you integrate a third-party reporting tool, go find another vendor. Third-party validation is incredibly important.
You should be able to obtain from your mobile application service provider a wealth of operational and business metrics from your campaigns. In general, obtaining metrics is a straightforward process, and as a marketer, you have to assess what mobile metrics are appropriate for you to measure.
Here is a list of the common metrics, tools, and questions you should be asking your provider about so that you can develop your mobile analytics strategy:
Frequency of data available: How often are the reports updated? (Many providers only provide previous day snapshots, not real-time data.)
Summary levels of data (in addition to detailed transactional data from the mobile campaign): For example, do they provide you with a total SMS message count or mobile Web page view count in a summary report?
Specific data elements available: Ask your provider what data elements they can provide you, like those listed in Table 14-1.
Sorting and selecting data capability: Can you sort and filter the data online, or do you need to export it and do it in a spreadsheet program like Microsoft Excel?
Availability of campaign dashboard tools: Campaign dashboards are graphical Web-based tools provided to marketers for manipulating and visualizing data.
Charts and graphs availability: Similar to summary level data, can you get bar charts, pie charts, time line graphs, and other visual representations of your campaign data?
Customization options (alarms, triggers, views): In other words, can the system send you an e-mail notifying you if your opt-out rate exceeds a threshold that concerns you, or if your text message campaigns hit previously unreached heights?
Integration capability: Do you have the ability to integrate with databases or other proprietary tools for data delivery?
Help support availability: Is both business and technical help available?
Privacy controls: Can you administer privacy controls, such as masking a user's phone number out of reports?
Process analysis (for user flows and consumer acquisition): Can you evaluate consumer engagement across different types of campaigns, such as moving from initial acquisition and into a loyalty or customer service program?
Tip
If your mobile service provider cannot comply or provide the majority of these items, either as a standard offering or by developing a customer report or tools for you, you may want to consider finding another vendor who can help you.
Note
Before you set up a customer report with a service provider or agency, make sure you are clear about who owns the information gathered. Also, be sure you understand and are comfortable with its process for data security. You want to make sure you own the data and that you can take the information with you if you choose to move on to another service, even if the information is collected through its platform. You can revisit more related to this and code of conduct and ethics in mobile marketing in Chapter 3 of this book.
An analytics report is a collection of mobile metrics presented to you in a single report so that you can see all your data as a whole and begin to gather insights from it. You can then use these insights to make decisions on how to best move forward with your business (see Figure 14-5). In other words, reporting and analyzing the data generated from your programs are absolutely critical components of your mobile marketing efforts. What good is the best mobile marketing campaign if you do not have strong insights into exactly how it performed or is performing?
Many of the companies in the mobile marketing space today can provide a high level of reporting sophistication. Campaign dashboards are often configurable so that you can see the metrics that matter to you and see them in a variety of formats.
Reports typically are summary views of a mobile campaign on a daily, weekly, or monthly basis, but they can also be unprocessed and unformatted data files, which require additional work to arrange and present the data.
Every mobile application provider has a different user interface for pulling its reports. Ask about the reporting feature in the application as well as the mobile Web site reports available when you're selecting a mobile service provider.
Tip
You'd be amazed by how quickly data can be amassed as mobile subscribers interact with a mobile marketing application. Every click, snap, and call can be, for the most part, tracked.
Note
Your application provider(s) no doubt has a lot of experience with collecting and analyzing transaction data; however, more often than not, the application provider is not in your business and doesn't know exactly how you want to look at the data or what analysis of the data is meaningful. Rather than assuming it knows what you need, tell it the type of results and data you want to see in the transaction reports. Have this discussion before your campaign launches; otherwise, you may have some late nights slogging through log files to get the answers you need. If you plan and coordinate with your application provider prior to the launch of your program(s), the application provider can give you the answers you seek in a perfectly packaged report, often in real time.
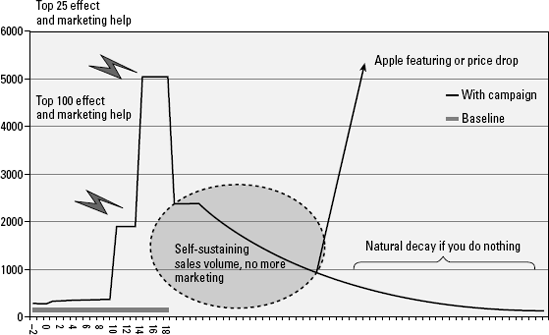
Often mobile marketing reports can contain both graphs and data for the metrics and be made available in a variety of formats (such as Microsoft Excel spreadsheets, Adobe Acrobat PDFs, or other). A current trend is to provide visual representation, typically in graph form, so a user can quickly see how his campaign is doing.
Figure 14-6 shows a sample trend graph on the effectiveness of mobile advertising.
Return on mobile marketing investment (ROMMI) is an important measure to keep track of because it lets you know whether you're achieving your objectives and getting more out of your mobile marketing than you're putting into it. There are two basic ROMMI measures: a ROMMI against direct revenue generating programs and a ROMMI against indirect revenue generating programs. Both are discussed in the following sections.
Calculating your ROMMI for revenue generating mobile marketing programs is a simple math exercise. The ROMMI for revenue generating programs compares the sales you generated, or expect to generate, in revenue terms against your mobile marketing spending, or expected spending, that helped generate those revenues.
Here's the formula:
| Return on mobile marketing investment (ROMMI) = [incremental revenue attributed to mobile marketing (in dollars) * sales contribution margin - mobile marketing spending (in dollars)] / mobile marketing spending (in dollars) |
Here's an explanation for each variable:
Incremental revenue attributed to mobile marketing (IRAMM), is the total additional revenue, in monetary terms (for example, in dollars) you generate by running the mobile marketing program as opposed to the revenue you'd receive if you did not run the mobile marketing program. For example, if your revenues were going to be $22,000 before running the mobile marketing program and you estimate they'll be $30,000 by adding the mobile marketing element to your marketing program, your IRAMM is the difference, $8,000.
Marketing spending is the total cost for running the mobile marketing program, including all strategy, creative, tactical execution, and technology elements. See Chapter 2 for details on estimating the cost of your mobile marketing programs.
Contribution margin is the calculation of the marginal profit (a percentage) generated from the product or service being sold. To calculate this, you need to know the selling price of the product(s) or service(s) that is contributing to the revenues being tracked and the variable cost it takes to produce it. With this information, you can use the following formulas to calculate your contribution margin. The calculation is a two-step process. You first must calculate the contribution per unit and then you can calculate the contribution margin:
Contribution per unit (in dollars) = Selling price per unit (in dollars) - variable cost per unit (in dollars)
Contribution margin (percentage) = contribution per unit (in dollars) / selling price per unit (in dollars)
Here is an example: Say you're selling T-shirts. The shirt sells for $10 and it costs you $1.50 to make it.
The contribution per unit (in dollars) is $10.00 - $1.50, which equals $8.50. The contribution margin is $8.50/$10.00, which equals 85%.
Tip
If you plan to use mobile marketing for the promotion and sales of multiple products, you can use the same model. You simply have to run the math for each product and add things up.
For example, say you own a chain of retail outlets and you want to use mobile marketing to drive traffic to your store to generate T-shirt sales. You're already spending money on a direct mail campaign and you want to mobile enhance the program by adding a mobile coupon call to action. The total cost of the mobile marketing element to enhance your existing marketing campaign is $5,000. You expect the mobile marketing element of the campaign to increase revenues from $22,000-$30,000. You previously calculated that the contribution margin of the T-shirts sales averages out at 85%.
In this case, your ROMMI would be
ROMMI = [incremental revenue attributed to mobile marketing (in dollars) * contribution margin percentage - marketing spending (in dollars)]/marketing spending (in dollars)
The ROMMI for this example = [$8,000 * 85% - $5,000]/$5,000 = 36%
In this case, your mobile marketing program is estimated to generate $0.36 per every dollar of spending. Not bad!
Calculating your ROMMI for indirect revenue programs can be a bit harder than doing so from direct programs, but it is not impossible. The same premise applies as for direct revenue programs: You want to estimate the overall value of the mobile market program to your achievement of the company's objectives.
Your goal for indirect revenue objectives is not sales, but rather some other trackable measure (opt-ins, impressions, clicks, traffic, redemptions, and so on). For example, maybe you want to measure the number of new leads in the opt-in database (opt-ins), total mobile advertising impressions generated (impressions), increased traffic in the store or on Internet or mobile Internet sites (traffic), the number of loyalty points redeemed by customers (redemptions), or whatever. In order to calculate your ROMMI, you need to know what each of these measures means to you. Look at your historical data and calculate how much additional revenue an opt-in, impression, redemption, or traffic means to you in terms of real revenue. You can then compare the value of an indirect measure, like an impression, against the estimated/actual costs of running the marketing program to estimate your indirect ROMMI and see if the program is worth doing.
Here's the formula:
| ROMMI for indirect programs = [estimated value of measure – mobile marketing spending (in dollars)] / mobile marketing spending (in dollars) |
Here's an explanation for each variable:
Estimated value of measure is the total revenue you'd expect from the metric. For example, say historically that you've calculated that every new impression on your Web site, on average, is worth $0.20 in expected revenue.
Mobile marketing spending is the total cost for running the mobile marketing program, including all strategy, creative, tactical execution, and technology elements. See Chapter 2 for details on estimating the cost of mobile marketing programs.
As an example, say that a travel agency wants to sponsor a live event. The sponsorship costs $35,000 (including the mobile marketing program costs). The agency assumes the sponsorships will generate 250,000 impressions, which results in a cost of $0.14/impression ($35,000/250,000). The agency knows that historically an impression is worth, on average, $0.20 in future revenues.
The ROMMI for these indirect programs = [$0.20-$0.14] / $0.14 = 43%
Based on these estimates, the sponsorship is worth the expense.