Chapter 10
Treating Cyber Risks—Using Insurance and Finance
Aon Global Cyber Solutions Kevin Kalinich, Esq., Aon Risk Solutions Global Cyber Insurance Practice Leader, USA
CEO Tom’s objectives include growing sales and reducing costs by effi-ciently increasing reliance on technology and data analytics. While Tara, his chairperson, and her board of directors are happy with the optimistic financial projections based in part on Tom’s embracing technology, the board has also inquired as to whether technology and information asset reliance increases risk to the financial statements from cyber exposures. Can Tom’s organization build a quantitative model that addresses cyber exposures in order to maximize efficient allocation of resources, budget, and reporting? If so, can cyber exposures be quantified and cyber risk transferred to insurers in an effective manner? Tom rose to the challenge. He saw to it that his chief financial officer, Gloria, and chief risk officer, Nathan, were collaborating with key internal stakeholders (such as the general counsel, human resources, sales and marketing, product development, treasury, chief information officer [CIO], chief information security officer [CISO], and chief security officer [CSO]) and that they were developing a cyber risk transfer solution aligned with their organization’s enterprise risk management system in order to address the total cost of risk (TCOR).1
Tailoring a Quantified Cost-Benefit Model
The reason for the board’s ask is simple. A cyber breach, no matter what kind or if it makes the front page of the paper, could have an impact on the organization’s balance sheet.2 The global cost of cybercrime is predicted to hit $6 trillion annually by 2021.3 This is mapped in Figure 10.1. (D&O Policy is a directors and officers policy.)
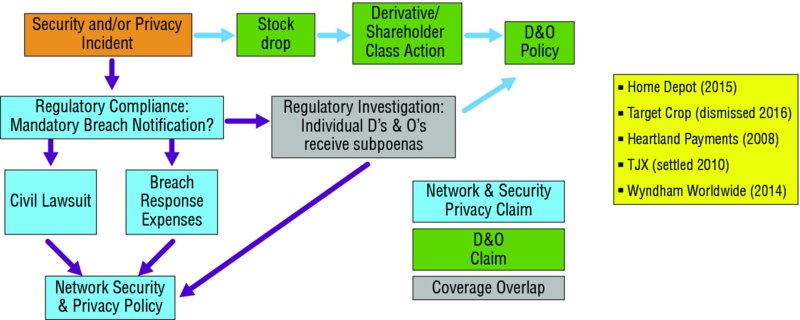
Figure 10.1 Financial statement impact
Constraints on Financial Impact Modeling
While we hear about the big cyber hacks, like Sony, TJ Maxx, and the massive October 21, 2016, Internet of Things (IoT)-facilitated attack on Dyn, there are many types of cyber risks that could have a materially negative impact on an organization. System failures, employee mistakes, and simple negligence, such as leaving a laptop or thumb drive in a taxi, are some of the noncriminal cyber perils that can lead to material financial economic losses. In fact, the average cost of a cyber breach ranges from $2 million to nearly $8 million, with eight incidents over $75 million and the largest losses over $300 million, according to publicly disclosed documents.4 (Note: All dollar values in this chapter are U.S. dollars).
However, large portions of the cyber incident studies include damage estimates of subjective intangible assets that are difficult to quantify and almost impossible to insure. For instance, brand and reputation are often cited as the largest portion of a breach loss, which are speculative and largely uninsurable. Similarly, how can one calculate the value of the trade secrets disclosed as part of the 2016 Mossack Fonseca law firm Panama Papers breach? The same issues arise for loss of confidential information regarding mergers and acquisitions from investment banks or new formulas and technology innovations such as algorithms, design plans, and secret proprietary products. The value of trade secrets, proprietary information, and patent infringement is almost impossible to quantify and is virtually uninsurable.
Modeling the Cost-Benefits of Investments in Insurance versus Cybersecurity
Until we develop quantitative models that equate the actual dollar cost of an incident with the return on investment for total mitigation on a macro-enterprise level, organizations are simply spending money on information technology security to address micro-level issues. Is antivirus software important? Yes, but it is one of literally hundreds of measures and only a small part of cyber exposure issues. Does deployment of enterprise security governance practices moderate the cost of cyber perils? Yes, but what is the marginal incremental benefit of each dollar deployed for cyber risk prevention? Can we measure the total cost of risk value to an organization buying cyber insurance compared to the total cost of risk value of information technology (IT) security in the network layer, versus detection, versus remediation, versus incident response, versus employee training and awareness? Any cyber intelligence system is only as secure as the weakest link in the system, including the people who use it. Cyber insurance underwriters expect such controls to be deployed (along with many others) and that will influence the insurance premium to be paid and scope of coverage obtained.
The CFO should consider modeling their organization’s cyber exposure frequency and severity. Figure 10.2 shows one way to frame example cyber exposures to start the quantification process.
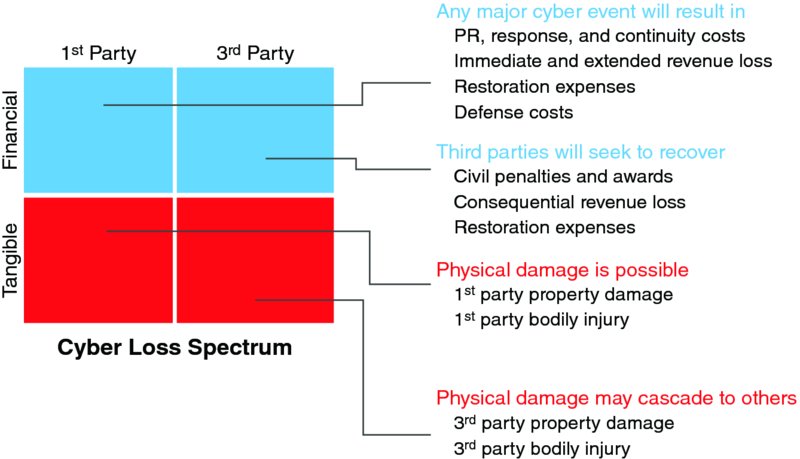
Figure 10.2 Cyber risk impacts all quadrants
Once completed, the CFO can compare the costs involved and perform a cost-benefit analysis of investing another dollar in IT security versus insurance. According to Aon’s actual cyber loss claims data, measurable and insurable cyber damage losses are approximately as follows5:
- 80 percent = Total damages < $1 million
- 15 percent = Total damages between $1 million and $20 million
- 5 percent = Total damages > $20 million (with certain events exceeding $100 million)
- Average = $3.8 million; range between $0 and $300+ million.6
Cyber Losses Underinsured Compared to Property Losses
How does this compare to potential losses from other organization perils, such as fires? The probability of any particular building burning down is much less than 1 percent. Yet most organizations spend multiples more in premiums for fire insurance than cyber insurance even though they state in their publicly disclosed documents that a majority of the organization’s value is attributed to intangible assets.
The Ponemon Institute conducted the first global research report7 to examine how entities understand and compare tangible property versus intangible information risks. Figures 10.3 through 10.6 are drawn from this report.
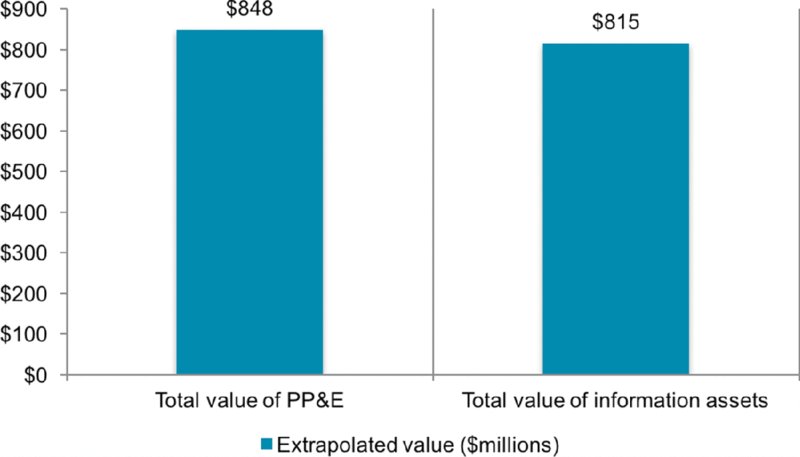
Figure 10.3 Asset value comparison: Property, plant and equipment (PP&E) versus information assets

Figure 10.4 Probable maximum loss (PML) value for PP&E versus information assets
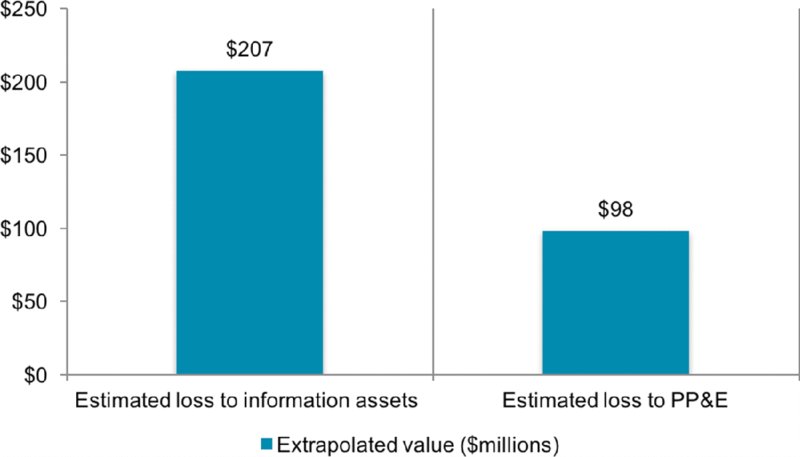
Figure 10.5 Impact of business interruption
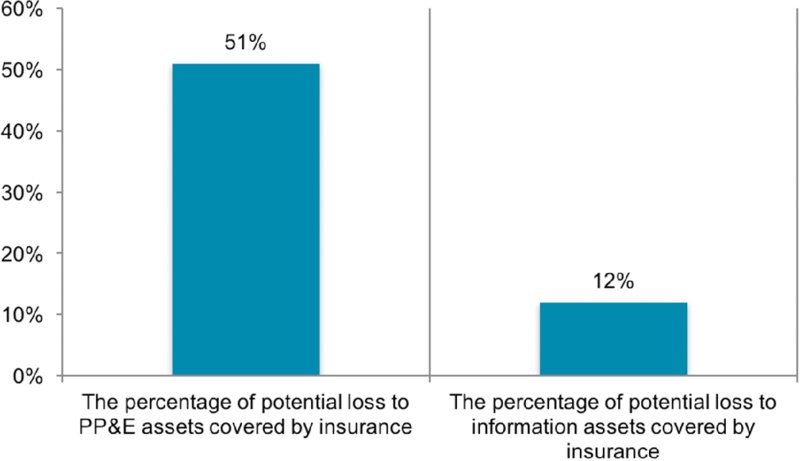
Figure 10.6 Information assets covered by insurance compared to PP&E
Figure 10.3 represents for organizations the relative value of certain tan-gible assets (property, plant and equipment) versus certain intangible assets (primarily information assets), with the implication that tangible assets are barely more valuable than intangible assets.
Figure 10.4 compares the total value of the loss that could result from damage to tangible assets versus the loss that could result from damage to intangible assets. Again, the predicted losses to tangible and intangible assets are relatively close.
Cyber-related threats are considered “intangible perils” to organizations and insurers. Figure 10.5 represents for organizations the relative potential financial statement impact of business interruption caused by tangible perils (i.e., weather, tangible asset damage) versus intangible perils (i.e., malware, hacking, system failure, etc.). These are in estimated dollar terms.
Figure 10.6 represents for organizations the percentage of losses to information assets covered by insurance compared to that for PP&E.
These Ponemon Institute results shown in Figures 10.3 through 10.6 collectively indicate that cyber losses are underinsured compared to property losses. They indicate over four times more insurance cover levels for PP&E over information assets (51 percent over 12 percent). This, despite the value of the assets and largest losses being equal and PPE accounting for only half the comparable business interruption impact ($98 PP&E vs. $207 for information assets).
Such research results also suggest a road map for CFO’s to advise their risk managers. CFO’s should advise how to appropriately allocate insurance spend on an enterprise-wide risk management (ERM) basis by considering a broader approach to their organization’s overall risk profile.8 Below are a few tips to consider:
- Information technology assets are 39 percent more exposed than property assets on a relative value to insurance protection basis.
- Proliferation of mobile devices, ransomware, social media, third-party vendors/cloud computing, Big Data analytics, and IoT to send cyber risk skyrocketing over next five years (e.g., projected growth in the use of Internet-connected devices will grow from 10 to 50 billion).9
- Thirty-seven percent of companies surveyed experienced a “material or significantly disruptive security exploit or data breach one or more times during the past two years, and the average economic impact of the event was $2.1 million.”10
- The most frequent type of incident was a cyber attack that caused disruption to business and IT operations (48 percent of respondents) followed by 35 percent of respondents who say it was a system or business process failure that caused disruption to business operations.
- Catastrophic cyber losses can result in potential D&O allegations.
- Process and documentation of determining cyber exposures and considering alternative solutions (such as cyber insurance) could assist in satisfying D&O fiduciary duties with respect to cyber assets.
- Underwriting and purchasing of cyber insurance process can assist to:
- Satisfy customer and partner cyber insurance contract requirements (i.e., increase sales).
- Stabilize balance sheet, including reduce earnings volatility.
- Address regulatory guidelines.
- Reduce TCOR.
- Enable organization-wide cyber risk management culture.
- Align cyber insurance solution with enterprise-wide risk management.
- Avoid D&O allegations.
Planning for Cyber Risk Insurance
Organizations should regularly look at their evolving cyber exposures and solutions to help weather a storm if an incident occurs. Risk and/or insurance managers should collaborate with business units when coordinating and agreeing to prevention, mitigation, and response plans and ensure the pitch is in the board’s own language. A cyber risk insurance plan should take into account an organization’s planning and desired response. There are four key steps involved.
1. Conduct Pre-Breach Education and Planning
It is important to look at pre-breach planning. Proper planning decreases the frequency likelihood and positively impacts an organization’s ability to respond to an incident. A key component of planning is organization-wide education. It is not just about the IT personnel. Education should occur from the board to the basement.
2. Develop an Incident Response Plan and Crisis Management Plan11
An incident response plan escalating to a crisis management plan outlines responsibilities, procedures, and decision trees at a high level if an incident occurs that is then not contained within standard IT incident protocols. It is important to keep such plans fresh, as technology and the cybercrime landscape continue to evolve. The plans should consider issues at an enterprise-wide level, not just IT security.
3. Create a Breach Business Continuity Plan12
An organization is advised to take a hard look at its capability to recover from a breach. Organizations have business continuity plans in place to weather physical perils that shut down operations. The same should be in place for cyber incidents that bring operations to a halt. This means augmenting an organization’s business continuity plan to address technology breaches and the responses required to maintain operations.
4. Review or Implement Cyber Insurance
Conduct an assessment of current insurance policies, such as property and general liability, to determine the potential need for additional coverage and an insurance action plan to address same. The assessment of coverage and gaps can encourage an open dialogue about opportunities to shore up systems and procedures. It can also help identify holes in processes and protocols as well as gaps in insurance coverage that potentially could be filled with cyber insurance.
The Risk Manager’s Perspective on Planning for Cyber Insurance
The risk and/or insurance managers have an important coordination role and should follow a sequence of steps.
First, they should coordinate all four plans summarized above.
Second, they should position cyber insurance treatment solutions as a subset of ERM system capabilities for the organization. Once the organization’s unique cyber risks have been identified, quantified, and collaboratively prioritized, tailored ERM stakeholder protocols should include:
- Ensuring that organization leadership has an appropriate governance structure, particularly reporting on noninsurable cyber risk magnitude.
- Ensuring that the organization has appropriate training through human resources to mitigate breaches via stolen credentials or social engineering.
- Understanding specific cyber vulnerabilities associated with operations.
- Understanding the legal liabilities and financial exposure from IT systems and related customer and vendor contracts.
Third, they should review vendors and the supply chain to evaluate potential insurance coverage and contractual indemnities from the organization’s vendors. Vendors are often the cause of the cyber peril.13
Fourth, they should look for insurance gaps by reviewing existing insurance coverages (such as property, general liability, crime, D&O, kidnap and ransom, and professional liability insurance).14 When identifying cyber coverage gaps, it is useful to leverage external expertise. For instance, it is critical to partner with an insurance broker who has cyber policy wording customization and claims-handling expertise and to consider outside legal counsel to evaluate coverage options. The most popular current combination of cyber-related covers includes third-party defense and liability, business interruption, cyber extortion, and regulatory proceedings. It is also possible to include bodily injury, supply chain, and tangible property damage coverage from IoT exposures.
Fifth, they should prepare the mechanisms of filing a cyber claim well in advance of any such event, although one hopes to never file a cyber claim. Such claim mechanisms should be agreed upon in advance with the insurance carrier and set forth in the cyber insurance policy. They include:
- Retention figure your organization is comfortable with paying prior to the insurance kicking in.
- Selection of legal counsel, forensics experts, cyber assessment firms, breach notification firms and credit monitoring firms (if necessary).
- Business interruption “proof of loss” form and calculation.
Sixth, they may also want to consider the use of a captive insurer to address cyber exposures, which could provide policy wording flexibility, claims administration, tax advantages, and access to additional program limits.
Seventh, they must stay abreast of cyber insurance market trends. This market is still emerging, fast moving, and in a state of flux.
Cyber Insurance Market Constraints
Like any market, cyber insurance is influenced by trends. Some of the trends that have the biggest impact on an organization’s cyber insurance decision deal with constraints.
Regulatory Constraints
Organizations should continually review their cyber insurance in light of the growing number of country regulations. For example, the European Union’s General Data Protection Regulation new rules become effective May 25, 2018. Among other provisions, these require a 72-hour notification and contemplate fines for the most serious incidents of up to 4 percent of total worldwide annual turnover. Privacy and security laws are on the horizon in other jurisdictions as well.
Capacity Constraints
Several cyber insurers announced new cyber facilities in 2016 with up to $100 million limits per placement and other new cyber capacity. This has increased the generally available stand-alone cyber limits from traditional insurance carriers from approximately $200 million (pre-2015) to approximately $400 million for most organizations in most industries. Add in the potential reinsurance capacity for some large organizations seeking catastrophic coverage and the total global capacity approaches $500 million to $1 billion in select cyber insurance programs with retentions of $10 million to $200 million-plus.
However, there are cyber capacity gaps and/or lack of insurance carrier competition in a number of areas that are in the process of being considered by the insurance market players. Aon Cyber Enterprise Solution™ policy, launched in the fourth quarter of 2016, is intended to address some of the following challenges:
- Large data aggregators with massive amounts of personally identifiable information, including personal health records, such as retail, health care, financial institutions, and hospitality (e.g., hotels and restaurants).
- Organizations with the potential for bodily injury and/or tangible property damage from purely cyber perils (e.g., manufacturing, power/energy, utilities, transportation, agribusiness, driverless cars, and the IoT-connected devices);
- Unauthorized transfer of funds via some combination of hacks (e.g., malware on a system) and social engineering (e.g., employee is tricked into sending a wire transfer at the request of a fake/imposter CFO or CEO such as the $81 million heist from the Bank of Bangladesh via the Federal Reserve Bank of New York).
- Industries where business interruption is of greater concern than breach of personal information, such as transportation, agribusiness, energy, utilities/power, and manufacturing.15
- Industries where the value of the lost information is most critical, which is generally excluded from today’s cyber insurance policies, such as investment banks involved in mergers and acquisitions, defense contractors, research labs, and law firms (think Mossack Fonseca breach).
Insurance Placement Constraints
There are over 67 different cyber insurers with over 67 different applications, submission processes, underwriting, policy forms, and claims handling. The key to a successful go-to-market strategy is to tailor what best fits your organization context and to allow time before any potential incident. Figure 10.7 summarizes typical components that make up an optimal cyber insurance program.
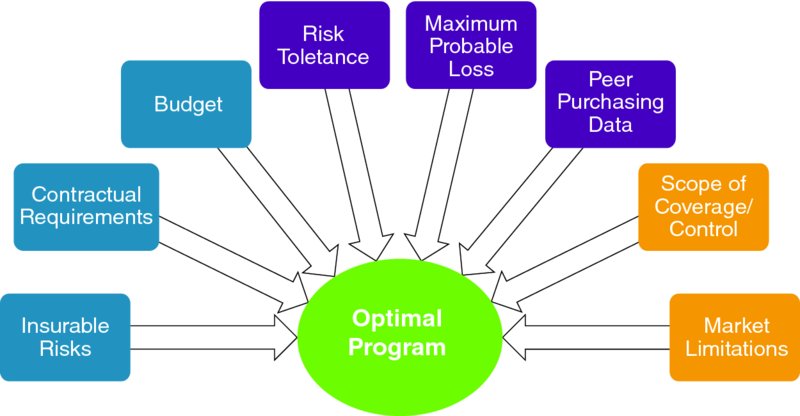
Figure 10.7 Optimal cyber insurance components
Figure 10.8 summarizes minimum timings and insurer steps to place a cyber program. Organizations need to plan around these in order to place an optimal program and tap the global insurance market.
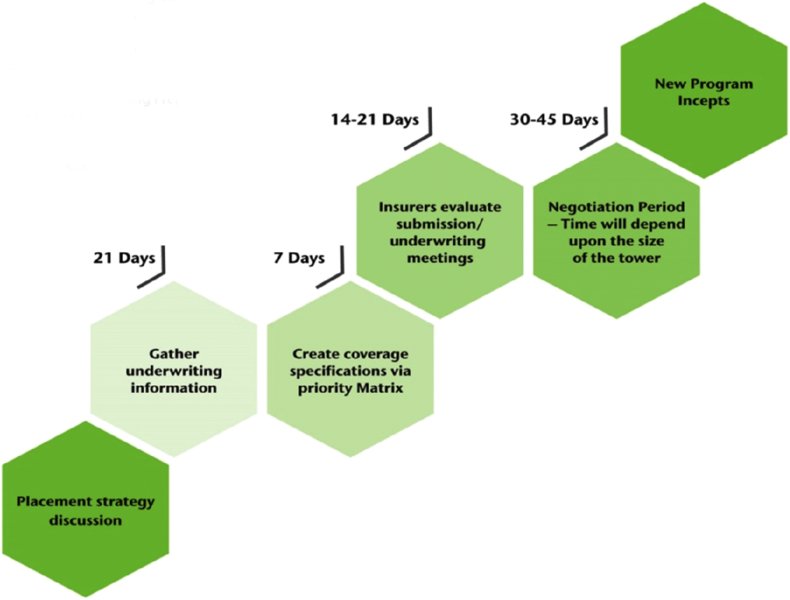
Figure 10.8 Cyber insurance placement minimum timings and steps
Conclusion
The relationship between cyber risk management and profit margin growth is stronger than correlation; it is cause and effect. The following cyber risk management statement represents those organization capabilities the CEO and board expect to be demonstrated in terms of cyber risk insurance and risk finance.
Notes
About Aon
Aon plc (NYSE: AON) is a leading global provider of risk management, insurance and reinsurance brokerage, and human resources solutions and outsourcing services. Through its more than 72,000 colleagues worldwide, Aon unites to empower results for clients in over 120 countries via innovative and effective risk and people solutions and through industry-leading global resources and technical expertise. Aon has been named repeatedly as the world’s best broker, best insurance intermediary, reinsurance intermediary, captives manager, and best employee benefits consulting firm by multiple industry sources. Visit www.aon.com for more information on Aon.
About Kevin Kalinich, Esq.
Kevin leads Aon’s global practice to identify exposures and develop insurance solutions related to Technology Errors and Omissions, Miscellaneous Professional Liability, Media Liability, Network Risk, and Intellectual Property. Kevin is a 2007, 2008, 2009, 2010, 2011, 2012 (Finalist), 2014, and 2016 (Finalist) Risk & Insurance “Power Broker.” Kevin has been quoted in numerous publications, including in Ted Koppel’s 2015 book, Lights Out (along with Berkshire Hathaway’s Ajit Jain), the Wall Street Journal, Time, and Bloomberg, and a frequent speaker regarding professional liability–related issues in various venues, including CNBC, RIMS, American Bar Association, American Bankers Association, FERMA, World Economic Forum, Stanford Program in Law, Science and Technology, CCH Computer Law Advisory Council, and Association of Financial Professionals. Kevin joined Aon in September 2000, from Altima Technologies, where he served as chief executive officer and led the successful launch of a Web-enabled software product that provides intelligent visualization of network equipment in the areas of telecommunications, data, cables, and computers. Prior to Altima, he was a partner at Chapman and Cutler Law Firm, where he represented domestic and international public and private entities in general corporate matters, intellectual property, M&A, venture capital, institutional investor, and IPO transactions. Kevin holds a JD from the University of Michigan and received his BA degree in economics and mathematics, cum laude, from Yale University.