Chapter 20
Physical Security
Radar Risk Group Inge Vandijck, CEO, Radar Risk Group, Belgium Paul Van Lerberghe, CTO, Radar Risk Group, Belgium
The head of security, Flory, is impressing on CEO Tom that “. . . physical asset security—not just digital asset security by the IT department—is also important. One without the other does not work.”
“OK,” Tom replied, “but I need to understand exactly how.”
Flory lists several physical risk scenarios in her mind such as:
- A break-in and theft at the data center.
- An imposter physically penetrating their facility pretending to be a visitor or supplier and stealing laptops or leaving lots of USBs on desks hoping someone will eventually plug it in or using latest desktop internal phones to gain digital access, or other means of gaining access to data assets (e.g., network).
- Social engineering by the adversary becoming friendly with guards and physically penetrating the location to gain access to data assets (e.g., network).
- Blackmail and other pressures on guards.
- An employee insider and collusion or sabotage.
In the end, Flory decides to explain a plan to build a state-of-the-art physical security risk management system in order to assist the IT information security function by considering various physical security threat scenarios such as theft, sabotage, and break and entry to the data center.
Tom Commits to a Plan
Tom commits to what he calls Tom’s plan on the advice of Flory, his head of security. It sets out how to plan, implement, monitor and review a physical security management system. Figure 20.1 represents how Tom plans to report to the board by working through the following steps:
- Get a clear view on the physical security threat landscape as it relates to cybersecurity.
- Understand how the physical security system’s organization specifically relates to cybersecurity: Who does what? What are the resources and competences available?
- Identify the security controls that are in place as they relate to cybersecurity.
- Evaluate the effectiveness of controls by calculating the probability of interrupting an adversary.
- Map and evaluate the cost-efficiency of the controls in place based on their total cost of security.
- Get a clear view on how mature the physical security risk management system is, how it supports and augments cybersecurity, and on its compliance with applicable laws and regulations (e.g., Tier requirements for data rooms).

Figure 20.1 Tom’s plan to build a state-of-the-art physical security risk management system
Get a Clear View on the Physical Security Risk Landscape and the Impact on Cybersecurity
Tom needs to get a clear view on the physical security risk landscape as it may impact cybersecurity. So he considers:
- Why may adversaries be motived to target the digital assets of the organization?
- What are digital information asset targets?
- Where are these digital information asset targets located?
- How will adversaries potentially operate?
- With what means will adversaries potentially operate?
- When will adversaries most likely attack?
- Who are our adversaries?
If cyber risks that may affect the objectives of the organization are not clearly assessed, there is an exposure that some cyber risks are not secured, undersecured or oversecured. In terms of capabilities, the organization might have invested in the wrong security controls.
Effective identification and profiling of physical security risk scenarios rests on seven elements. Figure 20.2 depicts these. A good understanding of physical security risks will enable the design of the right security measures in a step-by-step approach.
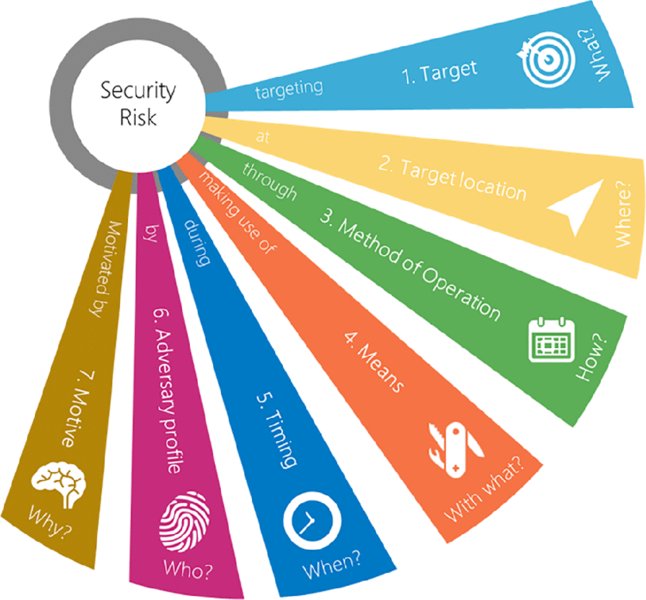
Figure 20.2 How to identify physical security risk scenarios using seven key elements
Step 1 is to establish the internal and external context in which his organization seeks achievement of the objectives. The ISO 31000:2009, Risk management—Principles and guidelines standard provides excellent guidelines. Elements in the external context that can play a role in Tom’s cyber risk assessment include the legal, regulatory, technological, and competitive environment. Other elements to consider are relationships with and perceptions and values of external shareholders. The organization’s internal context may include governance, organizational structure, roles and accountabilities, the information systems, information flows, and decision-making processes.
Finally, set the context of the risks that require assessment: Does the organization need to focus on cyber risks with a criminal intent, or does it also include cyber risks that can have nonintentional causes? Figure 20.3 represents a stepped approach to such risk assessment.
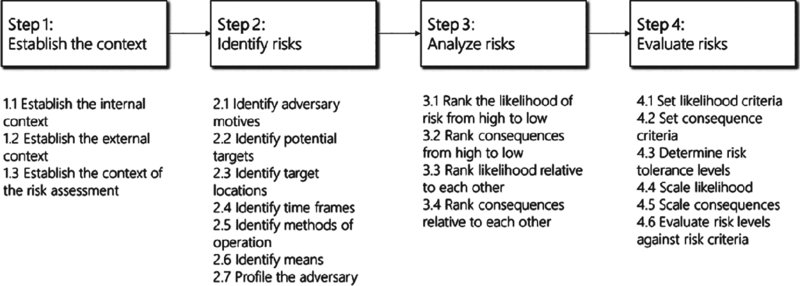
Figure 20.3 Risk assessment stepped approach
Step 2 documents criminal cyber risks. This involves:
- What are adversaries’ potential motives to commit cybercrime? For example, espionage, sabotage, fraud based on money gain, frustration, revenge.
- Why may our organization be a target? Which information assets does our organization possess that are attractive for adversaries? For example, R&D, client information, trade secrets.
- Where are these target information assets located? For example, in the cloud, network, data rooms, printed, tablets.
- When do adversaries attack, are their vulnerabilities in timing? For example, during maintenance, e-mail exchanges.
- How do adversaries operate? For example, hacking, direct denial of service (DDoS) attack, social engineering, infiltration, breaking and entry.
- With what means do adversaries attack? For example, exploits, social engineering skills, breaking and entry material.
- Who may be adversaries executing a cyber attack? For example, staff, competitors, activists, terrorists.
A list of identified cyber-crime risk scenarios delivers a clearer view on the risk landscape since not all these scenarios have the same likelihood or consequences.
Step 3 ranks the likelihood of the identified risk scenarios from high to low and does the same for the consequences. This can be refined by taking into account the current security controls in place to arrive at residual risk.
Assuming that the two highest-ranked cyber risk scenarios based on likelihood of occurrence are theft and sabotage, then the risk identification statements may read as follows:
- Theft (with motive money gain) of information on new product release (target), stored on servers in the data room (target location) during server maintenance (time frame) through unauthorized server access (MO) using a stolen access token (means) by a criminal pretending to be maintenance staff organized by a competitor (profile).
- Sabotage (with motive bringing reputation damage to the organization out of frustration) of the organization’s web site (target) which is managed in the cloud (target location), anytime (time frame) through hacking the web site (MO) by exploits (means) by an internal IT staff member (profile).
The board will likely want to know how much more likely is scenario 1 (theft) is relative to scenario 2 (sabotage) and equally in terms of consequences. The risk landscape analysis of risk scenarios in Figure 20.4 is helpful to a board as a heat-map format. The board will have an immediate clear view on the various cyber risk scenarios and the organization’s risk criteria should indicate whether or not the various cyber risk scenarios fall within acceptable tolerance levels.

Figure 20.4 Risk landscape heat map example
Manage or Review the Cybersecurity Organization
Once there is an understanding of the probability of interrupting the identified cyber risk scenarios, the organization can move to analyze organization roles and responsibilities, resources and competence management. To complete Tom’s plan for physical security to augment and support cybersecurity, use a RASCI methodology to detail who does what by following the eight steps shown in Figure 20.5.
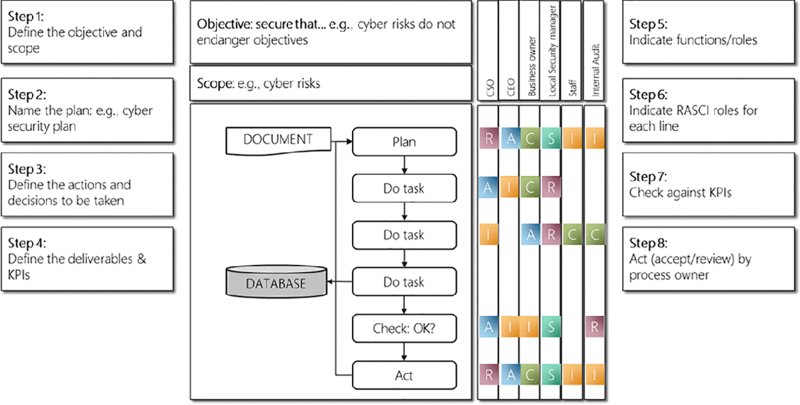
Figure 20.5 Tom’s RASCI plan for the physical security organization
The RASCI matrix is a powerful tool to assist in the identification of roles and assigning of cross-functional responsibilities to a project deliverable or activity. RASCI represents: responsibility, accountable, support, consulted, and—informed.
RASCI definitions follow:
- Responsibility: Person or role responsible for actually doing or completing the task.
- Accountable: Person or role who ensures that the whole task is completed, approved and/or successful (often called the “approver” or “owner” of the task).
- Support: Person or role responsible for providing support to the task.
- Consulted: Person or role whose subject matter expertise is required before and/or during the task in order to complete it.
- Informed: Person or role that needs to be kept informed during and/or informed after the task (including the status of task completion).
Design or Review Integrated Security Measures
Now that Tom has a clear view on the cyber-related physical security risk landscape of his organization, he is ready to design and/or review organizational and technical security measures to deter, delay, detect, alarm, and respond to adversary attacks.
This starts with evaluating if the security measures in place do effectively deter, detect, alarm, delay or respond to the identified cybersecurity risks. If not, scarce resources may have been allocated on the wrong security controls.
One leading method uses a three-step approach to designs and/or reviews typical physical security measures as shown in Figure 20.6. This is based on organizational measures, physical security, access control, intrusion detection, camera surveillance, information and communications technology (ICT) security alarm handling and response.
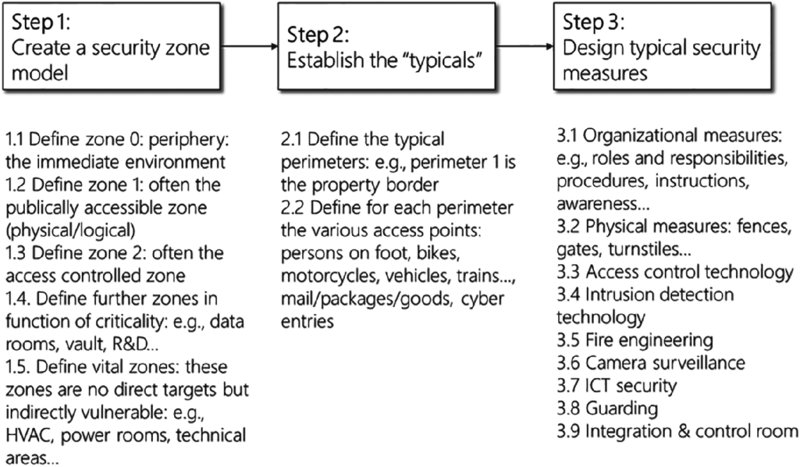
Figure 20.6 “Typical” physical security design in three steps
Step 1 is to consider the various security zones that are in place both physically and virtually and create a model. If a security zone model does not exist, one should be developed to organize a layered defense-in-depth. In the conceptual zone model in Figure 20.7, the largest-area shaded zones indicate the least critical areas, the medium-area shaded zones indicate zones with higher criticality and the darkest-shaded smallest zones are locations with high criticality that an adversary may be more likely to target.
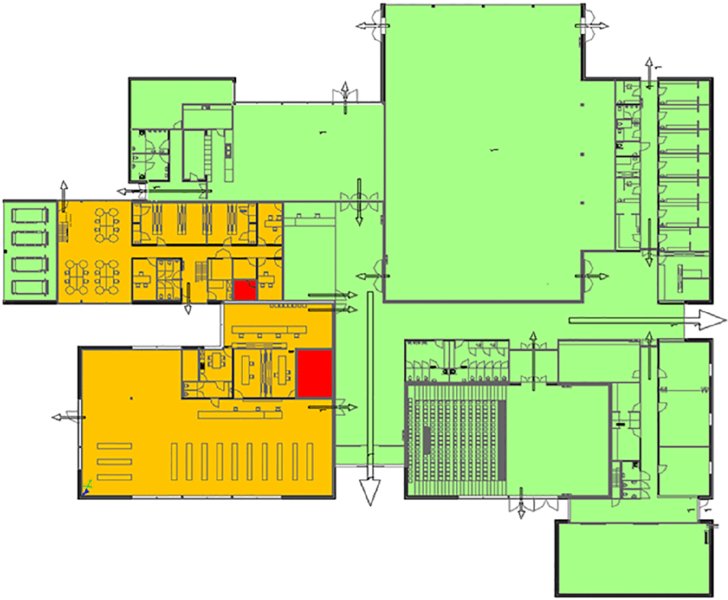
Figure 20.7 Security zone model example
Step 2 is to consider and evaluate the various typical perimeters. These include the various perimeter and perimeter accesses—both physical and logical. This should take the Tier certification requirements into account for the server- or data room. The Telecommunications Industry Association, a trade association accredited by ANSI (American National Standards Institute) defined four levels (called tiers) of data centers in a thorough, quantifiable manner. TIA-942 was amended in 2008 and again in 2010. TIA-942: Data Center Standards Overview describes the requirements for the data center infrastructure. The simplest is a Tier 1 data center, which is basically a server room, following basic guidelines for the installation of computer systems. The most stringent level is a Tier 4 data center, which is designed to host mission critical computer systems, with fully redundant subsystems and compartmentalized security zones controlled by biometric access controls methods. Another consideration is the placement of the data center in a subterranean context, for data security as well as environmental considerations such as cooling requirements.
Now, consider a cyber risk scenario that involves break and entry. There needs to be a clear view on what measures are in place for the various perimeters and perimeter access points. If the board member asks how the organization has secured the outer perimeter of its sites, the following “typical” security design in Figure 20.8 will give the board a clear insight and can be tailored to the organization.
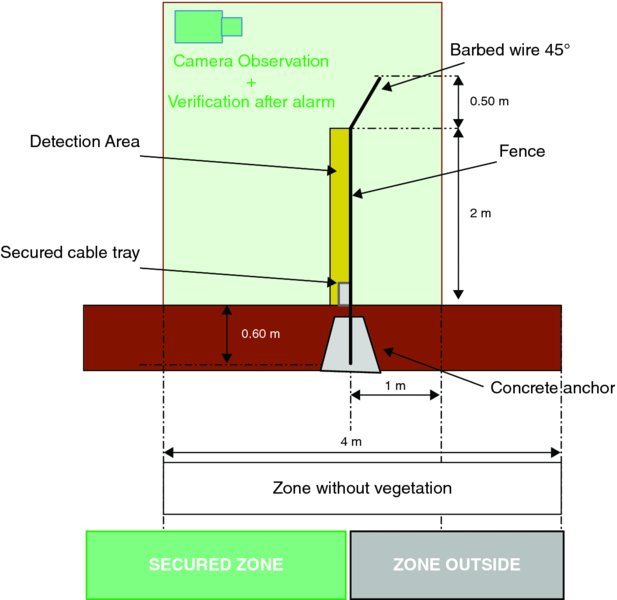
Figure 20.8 Typical security design example
Step 3 is to become well informed about the various physical security measures that are in place and how they relate to cybersecurity. These measures include:
- Organizational measures: For example, roles and responsibilities, procedures, instructions, awareness, and so on.
- Physical measures: Fences, gates, turnstiles, etc.
- Access control technology.
- Intrusion detection technology.
- Fire engineering.
- Camera surveillance.
- Guarding.
- ICT security: Firewalls, anti-malware.
- Integration and control room.
Figure 20.9 depicts the key objectives and various purposes for security measures. While guarding can also act as a corrective measure, most security measures are preventative and detective in nature. That is, to deter the adversary, to detect the adversary, to raise an alarm, to assess the alarm and to respond to the alarm.
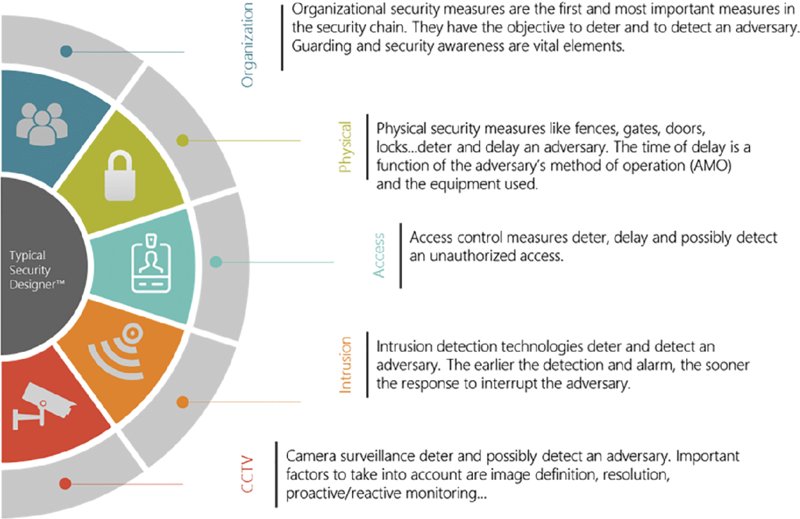
Figure 20.9 Key objectives for security measures
It takes some effort to plan, implement, monitor, and review security controls. Use the following tips:
- Be clear on the security goals.
- Apply technology by defense-in-depth.
- Integrate technology in a smart way.
- Take into account the impact of the environment on technology.
- Set clear functional requirements.
- Define the optimal locations.
- Choose the right technology.
- Install technology according to good workmanship.
- Organize maintenance.
- Use technology in the way it is intended for.
Reworking the Data Center Scenario
Let us evaluate the security objectives and controls for the data center scenario we have begun.
Understanding Objectives for Security Measures
Let us evaluate the security objectives by continuing the risk scenario identified earlier, as follows:
Theft of information on a new product release, stored on servers in the data room during server maintenance through unauthorized server access using a stolen access token by a criminal pretending to be maintenance staff.
First, evaluate what security controls are in place to deter an adversary trying to gain unauthorized access to the data room in this particular scenario. Are alert people around? Are visible security controls in place? Are strong access rights based on need to have access?
Second, evaluate what security controls are in place to detect and alarm and to assess an adversary in this particular scenario:
- Alert people around? Yes, alert people around can identify that the criminal is not part of the maintenance staff.
- Access control system? No, access will be granted through the stolen access card unless a good procedure is in place to immediately block an access card when reported stolen. A higher degree of security would be to have double or even triple access controls in place:
- An access card is something you have.
- A pin code is something you know.
- Biometry like a fingerprint, eyes, or vein patterns is something you are.
- Camera surveillance? Yes, potentially, if designed to detect a person gaining access with a stolen access card. This would require an integration between the access control system and the camera surveillance system and an operator verifying that the picture of the person entering the control room is the rightful owner of the access badge. Face recognition software is also an option.
Third, evaluate what security controls are in place to delay the adversary in this scenario. Locks and robust doors and walls will have no effect in this scenario since the adversary has access to the data room through a stolen access card and pretending to be a maintenance technician. Evaluate the measures in place to delay an adversary trying to get digital access to the information on the new product release.
Fourth, evaluate what security controls are in place to respond to the alarm. Are guards on site? What is their response force time? Are controls for lockdown in place?
Understanding Controls for the Data Center Scenario
The impact of all of these controls on all barriers on the path to the target (i.e., the data room in this scenario) need to be considered. What controls are in place to gain access to the first perimeter, the controlled zone, and, finally, the data room in this scenario?
Integration of controls is one element to consider. For example, an integration of physical security and intrusion detection in the case of the control room can give an operator information on the status of doors. An integration can also automatically close doors in an alarm situation. Integration of camera surveillance and access control can initiate automatic steering of a preset in camera surveillance triggered by an access control action or provide pop-up camera images.
How the environment affects technology is another element to consider. For example, if the data room walls are made of fabric, an enforced door will have no impact.
The functional requirements for technology can vary. For example, resistance times vary for the different physical security measures for doors, windows, and roof skylights, or the throughput time of access control systems.
The location and the use of security controls when choosing the right new technology (such as physical security measures, access control, camera surveillance, intrusion detection) is another element to consider. Often, many legacy controls have been installed, but they are not in line with current or future organization expectations or needs. Therefore, the right new technology needs to take account of the objectives of each new security control that is newly required. This includes defining the functional needs of each new measure to augment those currently in place. And not only the technical objectives, but also the procedural and operational objectives (e.g., a camera needs “line of sight” to provide to good footage, a right height, and an angle).
The right security equipment can now be chosen once each “typical” security design element is defined. The technical specifications for such equipment must match the security goals and must be suitable to operate in the organization’s specific Tier environment. The correct equipment to install can be vital, such as choosing a door made from wood or metal for its type of magnetic contact.
The installation of this equipment needs to be considered even though the right security equipment can be found most of the time. Clarity is needed as to how security equipment and material will be installed. The installation must be done taking into account at least the basic installation requirements for security controls (e.g., according to the prioritized security zone model) and the possibilities to overrule the detection of the equipment. Certain arrangements must be specified up front. These include, for example, that a magnetic contact must be installed at the most secured zone, that cabling is located at this same zone, that locks are not larger than the door leaf, or that the inclination on the fences are towards the less secured zones.
The technology needs to be correctly used. Just wearing a badge does not mean anyone needs to have access to all locations. People make use of wedges to keep doors open. Alarms are not followed up.
Maintenance is another key attention point. If controls are in place and are currently used but are not well maintained, then they may lose their mitigation effectiveness. Examples of poor maintenance include badges of employees who left the company that are still being enabled with all their access rights and cameras not functioning due to broken cabling, condensed dome cameras, or video loss.
Calculate or Review Exposure to Adversary Attacks
Now that there is a clear view on the cyber risk scenarios and the various security controls in place, it is possible to simulate the path of an adversary and the probability of interrupting the adversary.
Simulating the Path of an Adversary
The organization’s capabilities in physical security risk management in terms of the probability of interrupting the identified cyber risk scenarios can be done by simulation of the probability of interrupting an adversary along a certain path. A security system accomplishes its objectives by either offering deterrence or a combination of detection, delay, and response—in the physical as well as the digital sense. Timing is everything. A clear understanding is required of the various timing aspects related to the identified cyber risk scenarios and how the timings are related to the controls in place. This can become quite technical and may be better left to security experts.
Figure 20.10 shows the four steps involved in simulating the probability of interrupting an adversary along a certain path of physical attack on a location holding data assets.
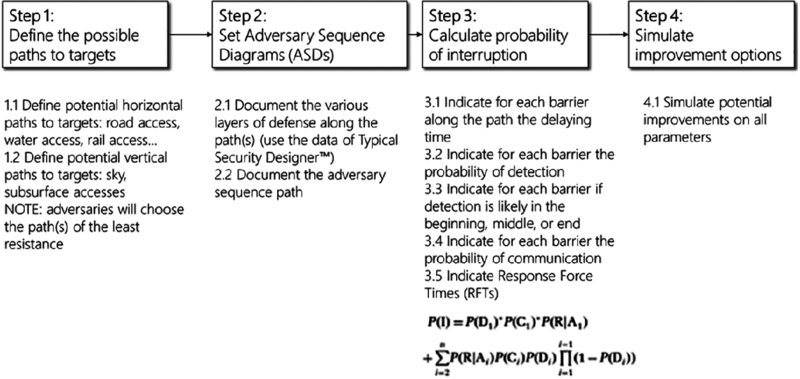
Figure 20.10 Adversary path analyzer in four steps
Calculating the Probability of Interrupting the Adversary
A variety of considerations are taken into account when calculating the probability of an organization being able to interrupt the path of an adversary for each cyber risk scenario. These include:
- T1: What is the penetration time to target?
- T2: At what time will a cyber attack be detected and alarmed?
- T3: What is the intervention time once the attack is detected and alarmed?
The first step to evaluate the probability of interrupting a cyber attack is to define the potential path(s) to target(s). These potential paths are a function of the cyber risk targets, target locations, time frames, method of operation, and access to means. In terms of identified cyber risk scenarios, consideration is to given to either potential horizontal paths (such as road access, water access, rail access) or potential vertical accesses (such as sky access) and to subsurface access in combination with access points to data asset access points for a cyber attack. Figure 20.11 captures the essential three points in time to mitigate an adversary attack.
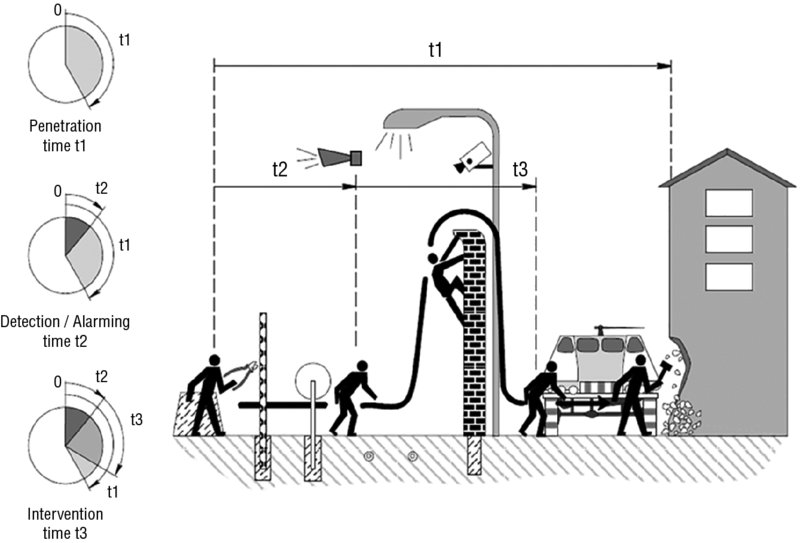
Figure 20.11 The three points in time to mitigate an adversary attack
Once potential paths to targets are assessed in view of (1) the shortest distance to target, (2) the lowest chance to be caught and, (3) the lowest consequences when caught, then the second step is to evaluate the various controls in place along the path. Here, a two-dimensional Adversary Sequence Diagram (ASD) is a valuable tool to evaluate this as in Figure 20.12. The ASD will help to define the paths an adversary will use to reach his target. Once the paths are defined and the control measures in place are inventoried, the time of resistance can be calculated.
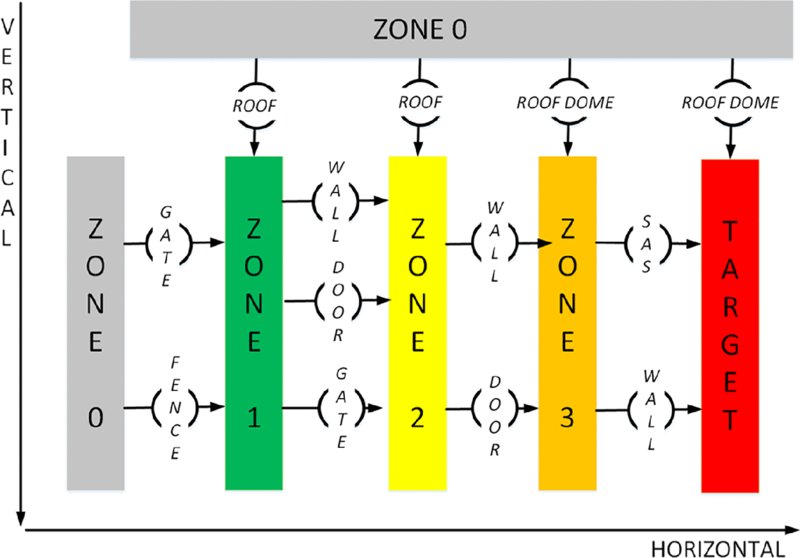
Figure 20.12 Adversary Sequence Diagram
The probability of interrupting an adversary’s attack is not the sum of all resistances divided by the intervention time. Rather, it is based on these probability (p) factors:
- The delaying time of each barrier.
- The probability of detection at each barrier.
- The location of detection: at beginning, middle, or end of the path.
- The probability of communication with response forces.
- The response force time.
Figure 20.13 looks at these p factors for interrupting an adversary’s attack.
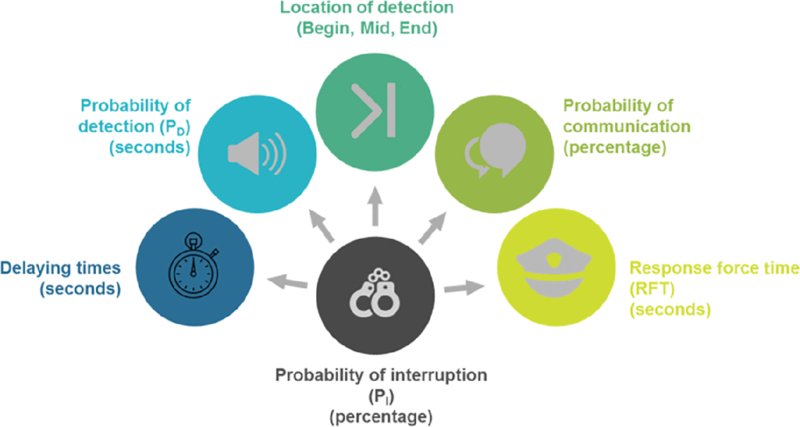
Figure 20.13 Probability (p) factors for interrupting an adversary’s attack
Optimize Return on Security Investment
Tom’s next—and perhaps biggest—challenge is to demonstrate how to optimize the costs and benefits of security to protect and create value. Bringing the right arguments to demonstrate return on security investment (ROSI) is not an easy task, but it is certainly not a mission impossible. The challenge is to present a clear link between the investment in security and the value added through securing the achievement of organization and information security objectives.
Costs for security are often regarded as a necessary evil and often driven by a need to meet regulatory obligations. In a mature risk management organization, the link between security and the value added is well understood as the security optimum: the point where the optimal costs for cybersecurity equals the marginal benefits. Figure 20.14 shows this crossover point in a line graph.

Figure 20.14 Optimizing return on investment
Conclusion
The following cyber risk management statement represents those organization capabilities CEO and board expect to be demonstrated in terms of cyber risk physical security to support and augment cybersecurity.
About Radar Risk Group
Radar Risk has developed a number of trademarked methodologies that have been outlined in this chapter above. Tom’s plan for cyber risk management capabilities is based on Securifyer™, a methodology that gives guidance on the planning, implementation, monitoring and review of a physical security management system. Crime Profiler™ is a method to identify physical security risk scenarios based on seven key elements of offender motives, potential targets, vulnerable locations, attack methods and means, vulnerable times, and offender profiling. Typical Security Designer™ is a three-step method that designs the organizational and technological security measures for optimal management of security risk scenarios. Path Analyzer™ is a four-step method to simulate an adversary’s path and provide a higher level of security. Path Analyzer™ is a method to calculate the probability (p) factors for interrupting an adversary’s attack. Radar Scanner™ measures the maturity of a security management system and compliance with a range of security laws and regulations such as International Ship and Port Facility Security (ISPS) Code, Customs-Trade Partnership Against Terrorism (C-TPAT) and the security-related ISO standard.
About Inge Vandijck
Inge is the CEO of the Radar Risk Group, a cooperative global network of risk management experts headquartered in Antwerp, Belgium, and New York. She is an economist and experienced enterprise risk management professional, specialized in security with a broad perspective on risk causes whatever their nature: criminal, natural, technological, or human error. Inge developed the Radar Risk’s Management Thought Process and has applied it in in the public and private sector with European, federal, regional, provincial and local governments, police, airports, seaports, oil and gas companies, energy and nuclear facilities, public transport, financial institutions, pharma and biologicals, the museum sector, the diamond industry, automobile industry, and food industry.
About Paul van Lerberghe
Paul is the Radar Risk Group’s CTO. He is an engineer and guest lecturer at the University of Antwerp and preparing his PhD at the UGent/UAntwerpen, faculty of Law & Criminology: “The impact of security awareness on security scenarios in organizations.” He started his security career as a development engineer where he gained experience in the conception and integration of physical security technologies such as access control systems, intrusion detection, fire engineering, camera surveillance, and control rooms. Paul has in-depth expertise in security technology and strong abilities to apply security technology from a risk and objectives point of view. Moreover, he knows all about the vulnerabilities in physical security technologies that adversaries exploit.