CHAPTER 13
PRECISIONS OF INDIRECTLY DETERMINED QUANTITIES
13.1 INTRODUCTION
Following an adjustment, it is important to know the estimated errors in both the derived quantities and the adjusted observations. For example, after adjusting a level net as described in Chapter 12, the uncertainties in both computed bench mark elevations and adjusted elevation differences can be determined. In Chapter 5, error propagation formulas were developed for indirectly measured quantities that were functionally related to observed values. In this chapter, error propagation formulas are developed for the quantities computed in a least squares solution.
13.2 DEVELOPMENT OF THE COVARIANCE MATRIX
![]() Consider an adjustment involving weighted observation equations like those in the level circuit example of Section 12.4. The matrix form for the system of weighted observation equation is
Consider an adjustment involving weighted observation equations like those in the level circuit example of Section 12.4. The matrix form for the system of weighted observation equation is
and the least squares solution of the weighted observation equations is given by
In this equation, X contains the most probable values for the unknowns, whereas the true values are Xtrue. The true values differ from X by some small amount ΔX, such that
where ΔX represents the true errors in the adjusted values.
Consider now a small incremental change, ΔL, in the observed values, L, which changes X to its true value, ![]() . Then Equation (13.2) becomes
. Then Equation (13.2) becomes
Expanding Equation (13.4) yields
Note in Equation (13.2) that X = (ATWA)−1 ATWL, and thus, subtracting this from Equation (13.5) yields
Recognizing ΔL as the errors in the observations, Equation (13.6) can be rewritten as
where the vector of residuals V is substituted for ΔL. Now let
Then
Multiplying both sides of Equation (13.9) by their transposes results in
Applying the matrix property (BV)T = VTBT to Equation (13.10) yields
The expanded left side of Equation (13.11) is

Also, the expanded right side of Equation (13.11) is

Assume that it is possible to repeat the entire sequence of observations many times, say a times, and that each time a slightly different solution occurs, yielding a different set of Xs. Averaging these sets, the left side of Equation (13.11) becomes

If a is large, the terms in Equation (13.14) are the variances and covariances as defined in Equation (6.7), and Equation (13.14) can be rewritten as

Also, considering “a” sets of observations, Equation (13.13) becomes

Recognizing the diagonal terms as variances of the quantities observed, ![]() , off-diagonal terms as the covariances,
, off-diagonal terms as the covariances, ![]() , and the fact that the matrix is symmetric, Equation (13.16) can be rewritten as
, and the fact that the matrix is symmetric, Equation (13.16) can be rewritten as

In Section 10.1, it was shown that the weight of an observation is inversely proportional to its variance. Also, from Equation (10.5), the variance of an observation of weight w can be expressed in terms of the reference variance as

Recall from Equation (10.3) that ![]() . Therefore,
. Therefore, ![]() , and by substituting Equation (13.18) into matrix (13.17) and replacing σ0 with S0 yields
, and by substituting Equation (13.18) into matrix (13.17) and replacing σ0 with S0 yields
Substituting Equation (13.8) into Equation (13.19) gives
Since the normal and weight matrices are symmetric, it follows that
Also, since the weight matrix W is symmetric, WT = W, and thus Equation (13.20) reduces to
Equation (13.15) is the left side of Equation (13.11), for which Equation (13.22) is the right. That is,
In least squares adjustment, the matrix ![]() of Equation (13.23) is known as the variance-covariance matrix, or simply the covariance matrix, and Qxx is the cofactor matrix for the adjusted unknown parameters. Diagonal elements of the cofactor matrix when multiplied by
of Equation (13.23) is known as the variance-covariance matrix, or simply the covariance matrix, and Qxx is the cofactor matrix for the adjusted unknown parameters. Diagonal elements of the cofactor matrix when multiplied by ![]() yield variances of the adjusted quantities, and the off-diagonal elements multiplied by
yield variances of the adjusted quantities, and the off-diagonal elements multiplied by ![]() yield covariances. From Equation (13.23), the estimated standard deviation Si for any unknown parameter having been computed from a system of observation equations is expressed as
yield covariances. From Equation (13.23), the estimated standard deviation Si for any unknown parameter having been computed from a system of observation equations is expressed as
where ![]() is the diagonal element (from the ith row and ith column) of the Qxx matrix, which as noted in Equation (13.23), is equal to the inverse of the matrix of normal equations. Since the normal equation matrix is symmetric, its inverse is also symmetric, and thus the covariance matrix for the adjusted unknown parameters,
is the diagonal element (from the ith row and ith column) of the Qxx matrix, which as noted in Equation (13.23), is equal to the inverse of the matrix of normal equations. Since the normal equation matrix is symmetric, its inverse is also symmetric, and thus the covariance matrix for the adjusted unknown parameters, ![]() , is also a symmetric matrix (i.e., element ij = element ji).
, is also a symmetric matrix (i.e., element ij = element ji).
Note that an estimate for the reference variance, ![]() , may be computed using either Equation (12.14) or (12.15), depending on whether the observations are unweighted or weighted. However, it should be remembered that this is only an estimate for the a priori (before the adjustment) value of the reference variance. The validity of this estimate can be checked using a χ2 test as discussed in Chapter 5. If it is a valid estimate for
, may be computed using either Equation (12.14) or (12.15), depending on whether the observations are unweighted or weighted. However, it should be remembered that this is only an estimate for the a priori (before the adjustment) value of the reference variance. The validity of this estimate can be checked using a χ2 test as discussed in Chapter 5. If it is a valid estimate for ![]() , the a priori value for the reference variance, which is 1 typically,1 can and should be used in the post-adjustment statistics computations discussed in this and the following chapters. Thus, the reference variance computed from the adjustment,
, the a priori value for the reference variance, which is 1 typically,1 can and should be used in the post-adjustment statistics computations discussed in this and the following chapters. Thus, the reference variance computed from the adjustment, ![]() , should be used only when the null hypothesis of the χ2 test is rejected. However, many software packages always use the computed reference variance rather than the a priori value. When the χ2 test fails to reject the null hypothesis and the a priori reference variance is not used in the computations, this typically only causes small differences in the computed statistical values. Thus, it is considered valid to use the a posteriori (after the adjustment) value for the reference variance in the post-adjustment statistical computations.
, should be used only when the null hypothesis of the χ2 test is rejected. However, many software packages always use the computed reference variance rather than the a priori value. When the χ2 test fails to reject the null hypothesis and the a priori reference variance is not used in the computations, this typically only causes small differences in the computed statistical values. Thus, it is considered valid to use the a posteriori (after the adjustment) value for the reference variance in the post-adjustment statistical computations.
13.3 NUMERICAL EXAMPLES
The results of the level net adjustment in Section 12.3 will be used to illustrate the computation of estimated errors for the adjusted unknowns. From Equation (12.6), the N−1 matrix, which is also the Qxx matrix, is

Also, from Equation (12.17), S0 = ±0.05. Now by Equation (13.24), the estimated standard deviations for the unknown bench mark elevations A, B, and C are

In the weighted example of Section 12.4, it should be noted that although this is a weighted adjustment, the a priori value for the reference variance is not known because weights were determined as 1/distance and not ![]() where
where ![]() was set equal to 1. From Equation (12.12), the Qxx matrix is
was set equal to 1. From Equation (12.12), the Qxx matrix is

Recalling that in Equation (12.18) S0 = ±0.107, the estimated errors in the computed elevations of bench marks A, B, and C are

These standard deviations are at approximately the 68% probability level, and if other percentage errors are desired, these values should be multiplied by their respective t values as discussed in Chapter 3.
It should be noted that in the weighted example, if variances had been used to compute the weights as ![]() , then a χ2 test could have been performed to check if the computed reference variance
, then a χ2 test could have been performed to check if the computed reference variance ![]() was statistically equal to
was statistically equal to ![]() . If they were determined to be statistically equal, that is H0 is not rejected, then the a priori value for
. If they were determined to be statistically equal, that is H0 is not rejected, then the a priori value for ![]() of one can be substituted for
of one can be substituted for ![]() in Equation (13.23).
in Equation (13.23).
13.4 STANDARD DEVIATIONS OF COMPUTED QUANTITIES
![]() In Section 6.1, the generalized law of propagation of variances was developed. Recalled here for convenience, Equation (6.13) was written as
In Section 6.1, the generalized law of propagation of variances was developed. Recalled here for convenience, Equation (6.13) was written as
where ![]() represents the adjusted observations,
represents the adjusted observations, ![]() the covariance matrix of the adjusted observations, Σxx the covariance matrix of the unknown parameters [i.e.,
the covariance matrix of the adjusted observations, Σxx the covariance matrix of the unknown parameters [i.e., ![]() ], and A the coefficient matrix of the observations. Rearranging Equation (10.2) and using sample statistics, there results
], and A the coefficient matrix of the observations. Rearranging Equation (10.2) and using sample statistics, there results ![]() . Also from Equation (13.23),
. Also from Equation (13.23), ![]() , and thus
, and thus ![]() where Sxx is an estimate for Σxx. Substituting this equality into Equation (a), the estimated standard deviations of the adjusted observations are
where Sxx is an estimate for Σxx. Substituting this equality into Equation (a), the estimated standard deviations of the adjusted observations are
where ![]() is the cofactor matrix of the adjusted observations.
is the cofactor matrix of the adjusted observations.
Computing uncertainties of quantities that were not actually observed has application in many areas. For example, suppose in a triangulation adjustment, that the x and y coordinates of stations A and B are calculated and the covariance matrix exists. Equation (13.25) could be applied to determine the estimated error in the length of line AB calculated from the adjusted coordinates of A and B. This is accomplished by relating the length AB to the unknown parameters as
This subject is discussed further in Chapter 14.
An important observation that should be made about the ![]() and Qxx matrices is that only the coefficient matrix, A, is used in their formation. Since the A matrix contains coefficients that express the relationships of the unknowns to each other, it depends only on the geometry of the problem. The only other term in Equation (13.25) is the reference variance, and that depends on the quality of the observations. These are important concepts that will be revisited in Chapter 21 when simulation and design of surveying networks is discussed.
and Qxx matrices is that only the coefficient matrix, A, is used in their formation. Since the A matrix contains coefficients that express the relationships of the unknowns to each other, it depends only on the geometry of the problem. The only other term in Equation (13.25) is the reference variance, and that depends on the quality of the observations. These are important concepts that will be revisited in Chapter 21 when simulation and design of surveying networks is discussed.
PROBLEMS
Note: Partial answers to problems marked with an asterisk can be found in Appendix H.
- 13.1 The reference variance of an adjustment is 1.23. The cofactor matrix and unknown parameter matrix are

What is the estimated error in the adjusted value for
- *(a) A?
- (b) B?
- (c) C?
- 13.2 In Problem 13.1, the adjustment had nine degrees of freedom.
- *(a) Did the adjustment pass the χ2 test at a 95% confidence level?
- (b) Assuming it passed the χ2 test in part a, what would be the estimated errors in the adjusted parameters?
For Problems 13.3 to 13.8, determine the estimated errors in the adjusted elevations:
- *13.3 Problem 12.1.
- 13.4 Problem 12.4.
- 13.5 Problem 12.6.
- 13.6 Problem 12.8.
- 13.7 Problem 12.10.
- 13.8 Problem 12.11.
For each problem, calculate the estimated errors for the adjusted elevation differences.
- *13.9 Problem 12.1.
- 13.10 Problem 12.4.
- 13.11 Problem 12.6.
- 13.12 Problem 12.8.
- 13.13 Problem 12.11.
Length Observations
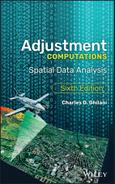
- 13.15 Use the accompanying sketch and the data below to answer the following questions.

Elevation of BM A = 1060.00 ft Elevation of BM B = 1125.79 ft Obs From To ΔElev (ft) σ (ft) Obs From To ΔElev (ft) σ (ft) 1 BM A V 12.33 ±0.018 8 Y Z 3.51 ±0.022 2 BM B V −53.46 ±0.019 9 W Z 58.84 ±0.022 3 V X −6.93 ±0.016 10 V W −28.86 ±0.021 4 V Y 26.51 ±0.021 11 BM A W −16.52 ±0.017 5 BM B Y −27.09 ±0.017 12 BM B X −60.36 ±0.020 6 BM A X 5.38 ±0.021 13 W X 21.86 ±0.018 7 Y X −33.50 ±0.018 14 X Z 36.90 ±0.020 What is the
- (a) Most probable elevation for each of stations V, W, X, Y, and Z?
- (b) Estimated error in each elevation?
- (c) Adjusted observations, their residuals, and estimated errors?
- (d) Elevation difference from bench mark A to station Z and its estimated error?
- 13.16 Do a χ2 test in Problem 13.15. What observation might contain a blunder?
- 13.17 Repeat Problem 13.15(a) – (c) without observation 5.
- 13.18 Repeat Problem 13.15(a) – (c) without observations 3, 5, and 11.
- 13.19 Repeat Problem 13.17 without observations 7 and 13.
- 13.20 Use the ADJUST to do Problems 13.17, 13.18, and 13.19. Explain any differences in the adjustment results.
PROGRAMMING PROBLEMS
- 13.21 Adapt the program developed in Problem 12.17 to compute and tabulate the adjusted.
- (a) Elevations and their estimated errors.
- (b) Elevation differences and their estimated errors.
- 13.22 Adapt the program developed in Problem 12.18 to compute and tabulate the adjusted.
- (a) Elevations and their estimated errors.
- (b) Elevation differences and their estimated errors.