
![]()
Android Sensor Networks
A sensor network is a series of stand-alone distributed sensor nodes that communicate information to a gateway for retrieval. Sensor networks are used to monitor a wide range of conditions over a greater area than is possible with a single sensor package. There is no typical setup for a sensor network; networks can range from just a few nodes to hundreds, collecting any kind of imaginable data. Sensor networks are commonly used for industrial, security, and scientific applications and can be set up as passive data collectors or active controllers. Sensor networks are not made upon any single technology; they are made by integrating a variety of other technologies.
Arduino provides a great development platform for sensor packages for data logging and system control. A sensor node is created when a sensor package is integrated with a communication method such as Bluetooth, Ethernet, XBees, Cellular/GSM, or light to create a network. Arduino has been used to make sensor networks to monitor environmental changes. For example, a distributed sensor network was created for the Fukushima nuclear disaster to keep track of radiation levels. The network for Fukushima used a combination of GSM and Ethernet to pass information from a Geiger sensor to a web service. Sebastian Alegria, a high-school student from Chile, created another successful example of a sensor network to detect and warn of earthquakes. Sebastian’s system used a simple seismometer to detect events that could cause destruction, his system passed the information through the Internet via Ethernet and used a buzzer to provide a local warning.
Sensor networks don’t have to be as grand as these two examples, however. For example, they can be made to monitor temperatures around a house or keep track of inventory being shipped out of a warehouse. When developing a sensor network, keep in mind of all the development requirements and choose the sensors and communication methods accordingly. For systems that monitor a smaller area, XBee modules can be used to avoid the need to run cabling. In harsh environments, a network that uses cabling might be needed. XBee modules and cable-based systems are great methods for creating stand-alone networks that don’t rely on other infrastructure systems but limit the range in which a sensor network can feasibly be created. To increase a senor network to a range that can monitor across a country or the world, it might be preferential to use an existing communication infrastructure, such as the Internet or telephone.
Android is a useful platform to integrate into a sensor network because of the variety of roles it can fill, along with its popularity and ease of development. Android can be used as a method to receive or send sensor information via a web service. Bluetooth can be used to wirelessly obtain data from a factory’s sensor network. Android in conjunction with the Open Accessory development kit can provide a portable method to retrieve data from a stand-alone sensor network.
This chapter focuses on building a small sensor network that integrates XBees, Android, and Arduino. The sensor network uses hardware that has been used in other chapters. The Mega ADK, SD breakout, XBee modules, XBee adapters, and an Android device are all required for this chapter. openFrameworks, Eclipse, and Arduino IDEs will also need to be available to complete the sensor network in this chapter.
![]() Caution This chapter uses concepts from and builds upon Chapters 3, 4, and 5. I recommend reading these chapters (on openFrameworks, the Android ADK, and XBees, respectively) before continuing with this chapter.
Caution This chapter uses concepts from and builds upon Chapters 3, 4, and 5. I recommend reading these chapters (on openFrameworks, the Android ADK, and XBees, respectively) before continuing with this chapter.
When starting the development of a sensor network, decide what information needs to be collected. This will help when qualifying sensor types. After determining the information to be collected, make a list of the requirements for the environment that the sensor network is to be deployed in. The environment has the biggest impact on what technologies to use; in an urban environment, power may be more readily available than in a rural or wilderness environment, where power may have to be generated or batteries extensively used. Wireless is probably the easiest type of node to deploy, but may have some reliability issues in environments with high electromagnetic interference; in such cases, shielded cabling may need to be run. The communication method also needs to not interfere with the sensor readings. If RF information is being collected, wireless may have to be avoided or the interference may have to be zeroed out of the information. In some special cases, fiber optics may be the best choice.
The sensor’s resolution is one factor that can determine the resolution of the whole network. The resolution can also be determined by the collection rate required by the system being monitored, with the amount of data collected to be sufficient for the application. The requirements need to be considered when starting to develop a sensor network. Systems that monitor machinery may require continuous sensor output every few milliseconds or even seconds, while networks measuring tidal flow may only need to be read every few minutes or even once an hour to achieve sufficient resolution. Some other requirements to plan for are how the collected data will be processed. The network will need sufficient processing power if the data needs to be processed in real time. The network will need to store the data if it’s to be processed at a later time than when it is collected.
Sensor networks do not need to be complex or use a lot of hardware in the initial development stages. Usually a sensor network has one gateway for the data and one to a few different node types to collect the data. Building a sensor network can start with a one or two nodes and a gateway and be planned to be expandable. In the initial stages of development, the passing of data is more important than the data itself. The data can be simulated to provide a constant to compare how successful the data transmission is.
The example in this chapter sets up a simple sensor network that demonstrates the integration of some of the technologies and concepts introduced in earlier chapters. The example is not a complete project to make a fully working sensor network.
The example creates a simulated sensor node with three different sensors that transmit predefined data for each sensor to the Mega ADK for logging and further retrieval by the Android device. The XBee modules are set up as router and coordinator in API mode with a baud of 115200. The pan ID needs to match on both XBees, but there is no need for the destination address to be set. The code implements a bit of error correction to ensure that the data is logged properly to the SD card and the serial connections stay synced. The Android device will be set up to pull a log from the Mega ADK and display the data via a graph. The Arduino connects the Android device, SD card, and XBee to create a data gateway. The Arduino also responds to the sensor node to confirm data was received or that the packet was malformed. Figure 8-1 shows the configuration of the Arduino Mega ADK.

Figure 8-1 . Arduino setup for sensor log node
As shown in Figure 8-1, the XBee module is connected to serial 3 on the Mega ADK; other connections are TX to RX and RX to TX, with the 5V and GND pins connected accordingly. On the SD adapter, the DI and DO pins are connected to the MOSI and MISO pins on the Mega ADK, CLK is connected to SCK, CS is connected to Arduino pin 10, and CD is connected to pin 2.
Set up the Arduino Mega ADK as shown in Figure 8-1, with the XBee module configured as the router and inserted in the serial adapter, and the coordinator plugged into the USB adapter. Individually testing each component attached to the Mega ADK before developing the code is vital to ensure that the hardware will not present many problems in the debugging stages. To test that the SD card can read and write, open the ReadWrite sketch in File ![]() Examples
Examples ![]() SD and add the line pinMode (53, OUTPUT); to make sure the slave select pin will not pull the Arduino out of SPI master mode. Change the line if (!SD.begin(4)) to if "(!SD.begin(10))" to map the SD card to the chosen slave-activation pin. Insert an SD card into the adapter and upload the ReadWrite sketch to the board. Start the serial monitor at baud 9600 and check that the sketch successfully runs.
SD and add the line pinMode (53, OUTPUT); to make sure the slave select pin will not pull the Arduino out of SPI master mode. Change the line if (!SD.begin(4)) to if "(!SD.begin(10))" to map the SD card to the chosen slave-activation pin. Insert an SD card into the adapter and upload the ReadWrite sketch to the board. Start the serial monitor at baud 9600 and check that the sketch successfully runs.
To test the XBee modules, open the software serial sketch example and modify it to accommodate the serial of the Arduino Mega ADK by changing all occurrences of mySerial to Serial3. Before uploading the sketch, remove the #include and SoftwareSerial code lines at the beginning of the program and change both baud rates to 115200 to match the current XBee configuration. Once the programs is running on the Arduino, plug in the USB explorer to a computer and start the X-CTU software, and try sending the HELLO packet from Chapter 5. The packet is
7E 00 13 10 01 00 00 00 00 00 00 FF FF FF FE 00 00 48 45 4C 4C 4F 7F
The packet should be entered into the packet assembly window in the terminal tab of the X-CTU software. The packet should show up on the serial monitor with a few unreadable characters along with a readable “HELLO.” You don’t need to test the Android ADK functionality if you’ve already completed the corresponding exercise in Chapter 5. The coding can begin for the sensor network components once the XBee and the SD card have been successfully tested.
openFrameworks
openFrameworks is used for this setup to create an application to create and transmit known data as a simulated sensor network over a single XBee module connected to a computer. As in Chapter 3, a program is created in a C++ compiler such as Code::Blocks and is made of at least three source files. A copy of the empty example found in openFrameworks directory/apps/myApps can be used as a base for the first part of the sensor network code. You need to modify the main.cpp file to set the drawing window to a smaller size by changing the ofSetupOpenGL function call to create a 276×276-pixel window. Change the call to match the following line of code: ofSetupOpenGL(&window, 276, 276, OF_WINDOW);.
testapp.cpp handles data creation and packet construction, responds to flow control, and graphically draws and indicates what data is being sent. The testapp.cpp code can be replaced with the code from Listing 8-1. The example is made of seven different functions. Part 1 sets up the serial connection declared by the serial object in testapp.h. The serial is connected to the location of the USB serial adapter (COM or TTY, depending on the system) and is connected at 115200 baud. The setup function initializes a destination address of a broadcast for this example, as well as flags needed for program control. Three unsigned byte arrays of 256 bytes are filled with data created by a sine wave–generation equation. The sine waves are zeroed at a value of 127. The sine wave follows the form y = a + b sin(k(x – c)), where a is the vertical transformation, b is the amplitude, c sets the horizontal shift, and k affects the period. The data generated will be drawn to the computer’s screen and sent over the XBee module to be eventuality displayed on an Android device.
Listing 8-1. testApp.cpp, Part 1 of 7
#include "testApp.h"
void testApp::setup(){
  printf ("Start
");
  serial.setup("/dev/ttyUSB0", 115200); // change to match where the Arduino is connected
  for (int i = 0; i < 256; i++){
    graph[i] = 127 + (100 * sin((1*(PI/127))*(i-0))); // sine functions
    graph1[i] = 127 + (75 * sin((2*(PI/127))*(i-10)));  // normalized in a 256×256-value area
    graph2[i] = 127 + (50 * sin((3*(PI/127))*(i-40)));
  } // end data fill installation
  for (int i = 0; i < 10; i++){
    destADR[i] = 0x00;  // set the 64-bit broadcast address
  } // end address fill
  destADR[6] = 0xFF; // set network broadcast address
  destADR[7] = 0xFF;
  destADR[8] = 0xFF;
  destADR[9] = 0xFE;
  point = 0; // zero data point indicator
  counts = 0; // used to delay packet send timing
  SensorsSent [0] = false; // packet flags
  SensorsSent [1] = false;
  SensorsSent [2] = false;
  FirstPacketsent = false;
} // end testApp::setup()
The next function is the loop that runs constantly during program execution. The update function waits for a set time to pass before trying to send the each of the sensor’s data. The time is based upon the amount of times the update function is run and will vary depending on the complexity of the code run. On average, the data is sent in intervals of half a second. Each time a data packet is sent, the code waits for a reply of an “OK” or “BAD,” signifying whether it should move on to the next packet or resend the last. Once all three sensors have been sent, the program starts sending the next data position in the array. All three of the sensor’s data packets could be sent in one packet, but for this demonstration they are split up to represent different nodes.
Listing 8-1. testApp.cpp, Part 2 of 7
void testApp::update(){
  unsigned char DatatoSend[3] ;
  if (counts == 500){
    printf ("sensor 1
");
    DatatoSend[0] = 'S';
    DatatoSend[1] = '1';
    DatatoSend[2] =  point;
    DatatoSend[3] = graph[point];
    CreatePacket(DatatoSend, 4);
    WaitForReply();
    SensorsSent [0] = true;
  }
  if (counts == 1000){
    printf ("sensor 2
");
    DatatoSend[0] = 'S' ;
    DatatoSend[1] = '2' ;
    DatatoSend[2] =  point;
    DatatoSend[3] = graph1[point] ;
    CreatePacket(DatatoSend , 4 );
    WaitForReply();
    SensorsSent [1] = true;
  }
  if (counts == 1500){
    printf ("sensor 3
");
    DatatoSend[0] = 'S';
    DatatoSend[1] = '3';
    DatatoSend[2] =  point;
    DatatoSend[3] = graph2[point] ;
    CreatePacket(DatatoSend , 4 );
    WaitForReply();
    SensorsSent [2] = true;
  }
  if (SensorsSent [0] == true && SensorsSent [1] == true && SensorsSent [2] == true){
    printf ("reset counts move point
");
    counts = 0;
    point++;
    SensorsSent [0] = false;
    SensorsSent [1] = false;
    SensorsSent [2] = false;
  }
  counts++;
  CheckForIncoming();
} // end testApp::update()
The last thing that the update function performs is to check for incoming data on the serial connection. Part 3 is the function that performs the check for incoming packets. The function tries to capture a complete packet from the XBee module and check to see if the packet has the correct checksum before attempting to read what the packet is and performing an action based on the packet’s information. The capture length is calculated by the first two bytes received after the packet start byte, not by the amount of available serial data. The buffer is cleared after each packet is captured and read. To attempt to keep the serial data incoming constantly, the buffers are cleared and variables reinitialized if an incoming packet is malformed.
Listing 8-1. testApp.cpp, Part 3 of 7
void testApp::CheckForIncoming(){
  incomingPacketChecksum = 0;
  incomingByteLen = 0;
  if (serial.available() && 0x7E == (incomingBuffer[0] = serial.readByte())){
    printf ("Incoming packet
");
    incomingBuffer[1] = serial.readByte(); // pull packet length
    incomingBuffer[2] = serial.readByte();
    incomingByteLen = incomingBuffer[1] + incomingBuffer[2];
    for (int i  = 3; i <= incomingByteLen + 3; i++){  // receive the rest of the packet's data
      incomingBuffer[i]  = serial.readByte();
      incomingPacketChecksum += incomingBuffer[i]; // add byte to checksum calculation
    }
    incomingPacketChecksum = (0xFF - incomingPacketChecksum);
    incomingByteLen += 3;
    if (incomingByteLen > 0 &&
      incomingPacketChecksum == incomingBuffer[incomingByteLen + 1 ] ){
      printf ("Has Corect Checksum
");
      ReadPacket();
      serial.flush(true, true); // flush incoming and outgoing serial buffers
    }
    else {
      printf ("Check Sum Error
");
      serial.flush(true, true);
      incomingByteLen = 0;
      incomingPacketChecksum = 0;
      for (int i = 0; i <= 80; i++){
       incomingBuffer[i] = 0;
      }
    } // end the error else statement
  } //end if (serial.available() && 0x7E ==...
} // end testApp::CheckForIncoming()
The function in part 4 reads the packet when called via a switch statement to determent the packet type and associated method of reading. This function responds to three different packet types: an AT command response packet, a transmit response, and a data packet and announces that the packet type is unknown in response to all other packet types. The program uses data packets transmitted for the Arduino to determine if the packet was sent properly; if the packet is returned “BAD,” the program resends the packet till an “OK” is returned. This is a simplified method of error correction that is handled by the next function.
Listing 8-1. testApp.cpp, Part 4 of 7
void testApp::ReadPacket(){
  switch (incomingBuffer[3]){  // check packet type and perform any responses
    case 0x90:
      dataLength = incomingByteLen - 15;  // reduce to just the data length to get the data
      for (int i = 0; i <= dataLength; i++){
        incomeData [i] = incomingBuffer[i+15]; // phrase out the data from the packet
      }
      if (dataLength == 2 && incomeData[0] == 'O' && incomeData[1] == 'K'){
        printf ("OKAY
");    // set Okay flag true when a good reply is received
        ReplyOK = true;
     }
      if (dataLength == 3 && incomeData[0] == 'B' && incomeData[1] == 'A' &&
        incomeData[2]  == 'D' && FirstPacketsent){
        ReplyOK = false;  // make sure that the flag is false when a BAD notify is received
        printf ("BAD
");
        serial.writeBytes (packetBuffer, lastPacketLength); // send last known packet
        WaitForReply();  // wait again for an okay
      }
      break;
    case 0x8B:
      printf ("Transmt Responce
");
      break;
    case 0x88:
      printf ("Command response %X%X
", incomingBuffer[8] , incomingBuffer[9]);
      break;
      default: // announce unknown packet type
      printf ("error: packet type not known
" );
  } // end switch
} // end  testApp::ReadPacket()
In part 5, the WaitForReply function is called after sending a packet to the Arduino, and will remain in a loop, constantly polling for new packets. The loop is complete when the reply comes back as a data packet containing an “OK.” The program will stop everything else it is doing while in the loop; this could be mitigated with more complexity, such as implementing a timeout. A recursive situation occurs when waiting for a good reply and a “BAD” packet is received, because the wait for reply is called when the resend occurs. The recursive situation is not detrimental to the running of the example and is completely exited when an “OK” is received. The recursive call can cause problems in more complex situations, though, and needs to be handled differently—with the use of timeouts and more robust packet-correction methods.
Listing 8-1. testApp.cpp, Part 5 of 7
void testApp::WaitForReply(){
  printf ("Wait for reply
");
  ReplyOK = false;
    while (ReplyOK != true){
    CheckForIncoming();
  }
} // end testApp::WaitForReply()
Part 6 is the function to create and send the packets over the XBee network. A pointer of the data and the length of the data that need to be sent are received when the function is called. The packet is created with the destination address set in the setup function and the pointer containing the data to be sent out. The packet that is created is a transmit request that has no frame ID to limit the number of packets that are worked with for this example. The frame ID can be used in situations where the receiving XBee may fail or go out of range, telling the program whether the packet was received or not. The transmit-reply packet that is generated by the XBee network does not inform the program that the packet was properly received by the Arduino; that is why the “OK” and “BAD” packets are used. The CreatePacket function calculates the checksum needed for the packet as the last step before sending. The function saves the packet length for possible resending and sets the FirstPacketsent flag to true to tell other functions that one packet has been sent; otherwise, the program will fail if a “BAD” packet is received before one packet has been sent.
Listing 8-1. testApp.cpp, Part 6 of 7
void testApp::CreatePacket(unsigned char *Outdata, int length){
  printf ("creating packet
");
  packetBuffer[17+ length] = 0;
  packetBuffer[0] = 0x7E;    // start byte
  packetBuffer[1] = 0;       // 1st length byte will be zero with current limitations
  packetBuffer[3] = 0x10;    // frame type
  packetBuffer[4] =  0;         // frame ID
  for (int i = 5; i <= 14; i++){     // add addresses
    packetBuffer[i] = destADR[i-5];
  }
  packetBuffer[15] = 0;  // set both options
  packetBuffer[16] = 0;
  for (int i = 0; i < length; i++){
    packetBuffer[i + 17] =  Outdata [i];  // add data to packet
    printf ("graph: %X
",packetBuffer[i+17]); // print sent data to debug console
  }
  packetBuffer[2] = 14 + length;      // set the lower length byte
  for (int i = 0; i <  packetBuffer[2]; i++){ // calculate the checksum
    packetBuffer[17+ length] =  packetBuffer[17+ length] + packetBuffer[i+3];
  }
  // finish packet by adding checksum to the final position
  packetBuffer[17+ length]= 0xFF - packetBuffer[17+ length];
  serial.writeBytes (packetBuffer, (18 + length)); // send the packet
  lastPacketLength = 18 + length;  // save last packet length
  FirstPacketsent = true;  // flag that at least the first packet is sent
} // end testApp::CreatePacket
The finishing touch for the openFrameworks code, in part 7, is to create a visual display for quick verification of the position and data being sent. The graph that is generated will be re-created on the Android device. Figure 8-2 shows the approximate graph that is generated using the data generated in the setup function. The draw function is called by openFrameworks after the update function is run and has to generate the view from scratch every time draw is run. The function generates the grid by outlining a 256-pixel area with a square by counting out a 32-pixel line spacing using a for loop. The data is drawn by a for loop that will step through each array of data and draw a series of lines segments connected together corresponding to the data contained in the array. There is a vertical line that is drawn dynamically to indicate the position from which the code is sending data. The position of the data point is incremented when all three simulated sensors have been sent.

Figure 8-2 . Graph visualization of data being sent
Listing 8-1. testApp.cpp, Part 7 of 7
void testApp::draw(){
  ofBackground (50,50,50);
  ofSetLineWidth (1);
  ofSetColor(0,0,0);
  for (int i = 266; i > 9; i -=32){ // draw the grid
    ofLine(10,i,266,i);
    ofLine(i,10,i,266);
  }
  for (int i = 0; i < 255; i++){ // draw the data
    ofSetLineWidth (2);
    ofSetColor(0,255,0);
    ofLine (i+10,(266 - graph[i]) , i+11 , (266 -graph [i+1]));
    ofSetColor(255,255,0);
    ofLine (i+10,(266 - graph1[i]) , i+11 , (266 -graph1 [i+1]));
    ofSetColor(0,0,255);
    ofLine (i+10,(266 - graph2[i]) , i+11 , (266 -graph2 [i+1]));
  }
  ofSetColor(255,0,0);
  ofLine (10 + point, 10, 10 + point, 266); // draw the position line
  ofSetLineWidth (1);
  } // end testApp::draw()
The last thing before compiling the code is to declare variables and function prototypes in testApp.h. Listing 8-2 describes the class used for the program. For simplicity, a majority of the variables are declared within the class definition. Listing 8-2 needs to replace the one created with the empty application. The code will need a preliminary test before the rest of the project is complete. To test, temporarily comment out the three WaitForReply function calls in the update function associated with the packet creation and sending. Compile and run the program, and the red line should increment to a new position after three packets are sent. With the program running, upload the modified software serial sketch to the Arduino Mega ADK that is set up with the connected, required hardware, and check for data printing to the serial monitor. The data is in readable by humans in this from, but shows that the packets are reaching the Arduino.
Listing 8-2. testApp.h
#pragma once
#include "ofMain.h"
class testApp : public ofBaseApp{
public:
   // variables and objects
   unsigned char graph[256], graph1[256], graph2[256];
   unsigned char point;
   int counts;
   bool SensorsSent [3];
   bool ReplyOK;
   bool FirstPacketsent;
   unsigned char incomingBuffer[80];
   unsigned char incomeData[64];
   int incomingByteLen;
   unsigned char incomingPacketChecksum;
   unsigned char destADR[10];

 unsigned char packetBuffer [80];
 int lastPacketLength;
 unsigned char dataLength;
 ofSerial serial;
 // openFrameworks-specific functions
 void setup();
 void update();
 void draw();
// sensor network functions to handle packets
 void CheckForIncoming();
 void WaitForReply();
 void ReadPacket ();
 void CreatePacket (unsigned char*, int);
}; // end class testApp
The Arduino
The Arduino is the main workhorse of this chapter’s example. The Arduino receives packets from other network nodes and processes the information to be logged to an SD card to be eventually retrieved by an Android device. The Arduino programming responds to good incoming data by generating an “OK” reply packet using the address contained within the good incoming packets of the sending node. If a packet is malformed, a broadcast “BAD” packet is sent to the network; the packet is a broadcast because it might not be possible to determine the address of the sending node. Both reply packets keep the simulated sensor network that is made with openFrameworks moving forward and sending data.
The Arduino program waits till the last sensor is received before writing the data to the SD card as a single buffer line. The simple packet-correction method sometimes drops data instead of trying figure out what packets might be missing. The amount of lost data needs to be determined; as a function of the requirements of some projects, it may be more critical that all the data is received.
Listing 8-3 is divided into eight parts. Part 1 sets up most of the variables and libraries needed. Both SD.h and AndroidAccessory.h are used to create the connection to the corresponding SPI devices. Input and output buffers are set for both the serial XBee connection and the SD card read and write. The reply packet that signifies that a packet was not received properly is set as a static byte array, as this packet will be the standard reply for malformed packets. The “BAD” packet is not required to be generated every time it needs to be sent, unlike the “OK” reply packet, which is generated dynamically every time. The SD card output buffer has a set amount of preformatting.
The data contained in the log file is essentially a four-byte string for each sensor: it contains the sensor name, the location of the data in the array of the openFrameworks program, and the actual sensor data. The sensor data is separated by a colon, and a double-colon separates each sensor. The data lines are ended with a carnage return and linefeed character. Each of the remote sensors are designated as S1 through S3, and a local sensor location called L1 has been left in the array to allow for an optimal local sensor attached to the Mega ADK to be processed. A series of Boolean flags are declared for program flow control: one flag contains a blink state to blink the LED and two flags are for ADK connection status.
The last object created is the AndroidAccessory object and uses the same declaration as we used in Chapter 4. As long as the default program has not been set on the Android device, programs associated with a particular accessory name and ID will be given as an autorun option when connected. Using the same accessory lets you avoid an unnecessary upload when starting to integrate the Android device into the sensor network, by allowing the ADK monitor to easily be used as an option for debugging.
Listing 8-3. Data Logger and ADK Handler, Part 1 of 8
#include <SD.h> // must be included before AndroidAccessory.h
#include <AndroidAccessory.h>
  static byte badPacket[21] = {0x7E ,0x00 ,0x11 ,0x10 ,0x00 ,0x00 ,0x00 ,0x00 ,0x00 ,0x00 ,
  0x00 ,0xFF ,0xFF ,0xFF ,0xFE ,0x00 ,0x00 ,0x42 ,0x41 ,0x44 ,0x2D };
  byte OutPacketBuffer[80];
  byte incomingBuffer[80];
  int incomingByteLen;
  byte incomingPacketChecksum;
  byte sourceADR[10];     // source addresses holding
  byte incomeData [64];  // phrased data holder
  int dataLength;              // length of data received
  byte SDinBuffer[34];      // SD buffer is 34 bytes to capture a whole data line
  byte SDoutBuffer[34] =
// pre-format used to contain the data to log
  {'S','1',':',0xFF,':',0xFF,':',':',
   'S','2',':',0xFF,':',0xFF,':',':',
   'S','3',':',0xFF,':',0xFF,':',':',
   'L','1',':',0xFF,':',0xFF,':',':', 0x0A,0x0D};
  int ERRcount = 0;
  int IcomingTime  = 0;
  boolean Blink  = LOW; // blink state holder
  bool lastReply = false; // false bad, true good
  boolean ADKisConnected = false; // so the rest of the code does not have to pull the USB
  boolean LogFileSyncADK = false;
  File LogFile;
  AndroidAccessory ADK("Manufacturer2",
                       "Model2",
                       "Description",
                       "2.0",
                       "http://yoursite.com",
                       "0000000012345678");
Part 2 of the Arduino program contains the setup function. Two serial connections are needed: one for the XBee module and one for debugging. Arduino pin 2 is used for card detection and pin 10 is used for SD card slave select. Pins 10 and 13 are set as output, along with pin 53, to make sure the SPI remains in master mode. After the pins and serial are set up, the code remains in a loop, waiting for the SD card to become available, during which the LED produces a slow blink. Once the card is detected, the LED will blink rapidly before making sure that the log file is available. Finally, the setup function initializes the Android connection.
Listing 8-3. Data Logger and ADK Handler, Part 2 of 8
void setup(){
  Serial.begin(115200);  // serial to monitor
  Serial3.begin(115200); // serial to XBee
  pinMode(2, INPUT); // pin for SD card detection; can attach interrupt if needed
  digitalWrite (2, HIGH);// pull up for chip detect
  pinMode(13, OUTPUT); // use onboard LED for diagnostics
  pinMode(53, OUTPUT); // make sure the SPI won't enter slave
  pinMode(10, OUTPUT);  // CS pin for SD
  while (!SD.begin(10)) { // wait for SD to be available
    digitalWrite (13, (Blink = !Blink)); // constant blink waiting for card
  }
  delay (100);
  for (int i = 0 ; i <= 10 ; i++) {
    digitalWrite (13, (Blink = !Blink));
    delay (100);
  } // fast blink to show SD card is initialized
  if (SD.exists("sensor.log")) {
    for (int i = 0; i <= 4 ; i++) {
    digitalWrite (13, (Blink = !Blink));
    delay (300);
   }// slow short blink to show file is found
  }
  else{
    LogFile = SD.open("sensor.log", FILE_WRITE);
    LogFile.close();
  } // create log file if none is found
 ADK.begin(); // initialize the Android connection
} // end setup");
In part 3, the loop function controls the major flow of the Arduino program. The loop function starts with a confirmation of the presence of the SD card. If there is no SD card inserted, the program blinks the LED and sets flags for use when the SD card is available. When the SD card is available, the program will count the times the loop is run, and if a packet is not received within the set amount of counts, the function will resend the last reply packet type as either “OK” or “BAD.” The loop function also checks the availability of the ADK connection, along with checking for new data from Serial3.
Listing 8-3. Data Logger and ADK Handler, Part 3 of 8
void loop(){
  if (digitalRead(2) == HIGH){
    digitalWrite (13, HIGH);
    if (IcomingTime >= 25){
      if (lastReply){
        SendOK();
      }
      else{
        Serial3.write (badPacket,21);
      }
      IcomingTime = 0;
    }
    HandleADK();
    CheckForIncoming();
    delay (50);
    IcomingTime++;
  } // end if (digitalRead(2) == HIGH)
  else{
    IcomingTime = 1000;
    bool lastReply = false; // will request a new packet to be set
                            // if node is waiting for reply
    digitalWrite (13, (Blink = !Blink));  // blink when SD card is not available
    delay (100);
  } // end else for if (digitalRead(2) == HIGH)
} // end loop
Part 4 is the function to capture incoming packets from the Arduino. It performs the checksum verification. This function is closely related to the receive function created in the openFrameworks portion and described in Chapter 5. The CheckForIncoming function has a bit more control than previous examples to ensure that the packets are properly received. It does this by flushing all of the input and serial connection buffers connected to the XBee module when too many errors have been encountered. This function also initiates the proper reply packet based on the checksum being correct, along with the reading of the packet when a proper packet is received.
Listing 8-3. Data Logger and ADK Handler, Part 4 of 8
void CheckForIncoming(){
  incomingBuffer[0] =  0; // clear the first byte of the incoming buffer
  if (Serial3.available() && 0x7E == (incomingBuffer[0] = Serial3.read())){
    incomingBuffer[1] = Serial3.read(); // pull packet length
    incomingBuffer[2] = Serial3.read();
    incomingByteLen = incomingBuffer[1] + incomingBuffer[2]; // calculate packet length
    incomingPacketChecksum = 0; // clear checksum
    for (int i  = 3; i <= incomingByteLen + 3; i++){
      incomingBuffer[i]  = Serial3.read();  // capture packet
      incomingPacketChecksum += incomingBuffer[i]; // calculate checksum
    }
    incomingPacketChecksum = (0xFF - incomingPacketChecksum); // finish checksum
    incomingByteLen += 3;
    if (incomingByteLen > 0 && incomingPacketChecksum ==
      incomingBuffer[incomingByteLen+1]){
      Serial3.flush(); // done with serial buffer for now
      ReadPacket(); // read and handled the data
      SendOK(); // reply to original sender
    }
    else { // if checksum is bad, perform clean and bad packet send
      ERRcount++; // increment error count
      for (int i = 0; i <= 80; i++){  // clear packet from incoming buffer
        incomingBuffer[i] = 0;
      }
      Serial3.flush(); // clear serial connection
      delay (100);
      // if too many errors encountered, reset serial connection
      if (ERRcount == 10) {
        Serial3.end();   // stop serial completely
        for (int i = 0; i <= 10; i++) {  // blink for verification
          digitalWrite (13, (Blink = !Blink));
          delay (50);
          ERRcount = 0; // reset error count
        }
        Serial3.begin(115200); // restart serial connection
        delay (30);
      }
      Serial3.write (badPacket,21); // send BAD reply
      lastReply = false; // set last reply ad bad flag
    }  // end else checksum bad
  } // end if (Serial3.available() && 0x7E
} // end void CheckIncoming()
Part 5 reads a proper incoming packet using a switch statement and recognizes three packet types. The three packet are a data packet, an AT command response, and a transmit response. The transmit and AT command response both print to the serial monitor when they are detected and perform no other work on those types. When a data packet is received, the address of the sending node is placed in an array for use in the SendOK function, which will be called after this function returns to CheckForIncoming. Data is also phrased from the data packet and placed in an array to be used for prepping the format and containment in the log file on the SD card.
Listing 8-3. Data Logger and ADK Handler, Part 5 of 8
void ReadPacket(){
  IcomingTime  = 0;  // received a good packet-reset time
  switch (incomingBuffer[3]){  // check packet type and perform any responses
    case 0x90:  // data packet
      dataLength = 0;
      for (int i = 4; i <= 13; i++){  // get both addresses of the source device
        sourceADR[i-4] = incomingBuffer[i];
     }
     dataLength = incomingByteLen - 15;  // reduce to just the data length to get the data
     for (int i = 0; i <= dataLength; i++){
       incomeData [i] = incomingBuffer[i+15]4data from the packet
     }
     if (dataLength == 4){ // send data to the preparation function if length is proper
       PrepareDataForSD();
     }
     break;
   case 0x8B:  // if packet is a transmit response, perform action
     Serial.println ("Transmit Response");
     break;
   case 0x88: // inform of information from command response
      Serial.print("Command response :");
      Serial.print (incomingBuffer[8], HEX);
      Serial.println (incomingBuffer[9],HEX);
      break;
   default: // announce unknown packet type
     Serial.println ("error: packet type not known");
  } // end Switch Case
} // end void ReadPacket
In part 6, the next function preps the data to be contained in the SD card and that’s ready for passing to the Android device. When data is received and parsed from the incoming packets, it is sent to this function and placed in the SD buffer according to the sensor’s number. This function will place all three sensors into the respective locations, and when the last sensor is received, the SD buffer is written to the SD card for storage. The data is sorted with a switch that looks at the second position of the incomeData array, which contains the sensor number associated with the sensor data. Once the third sensor is received, the SD buffer is printed to the serial connection to the computer for debugging, and the SD buffer will be sent to the Android device if connected and the data in the log has been synced.
The method of logging the data after the third sensor has been received sometimes misses some of the other sensors. In more professional setups, the program should make a request for the missing sensor data from the network, but for this demonstration it is not necessary. This function can also be used to pull a local sensor to add extra sensor data to the log. When the SD buffer is ready, the code opens the file for writing and finds the last position by seeking to the end based upon the file size, and closes the file when finished. The positions that are associated with the sensor data are reset to the initialization values returning back to the calling function.
Listing 8-3. Data Logger and ADK Handler, Part 6 of 8
void PrepareDataForSD(){
  switch (incomeData[1]){
    case '1':
      SDoutBuffer[3] =  incomeData[2];
      SDoutBuffer[5] =  incomeData[3];
      break;
    case '2':
      SDoutBuffer[11] =  incomeData[2];
      SDoutBuffer[13] =  incomeData[3];
      break;
    case '3':
      SDoutBuffer[19] =  incomeData[2];
      SDoutBuffer[21] =  incomeData[3];
      // a local sensor can be pulled and added to the SD buffer at the L1 location
      LogFile = SD.open("sensor.log", FILE_WRITE);  // open file for writing
      LogFile.seek(LogFile.size()); // find end of file to append
      if (LogFile) {
        LogFile.write (SDoutBuffer,34);
        Serial.write (SDoutBuffer,34);
        if (ADKisConnected && LogFileSyncADK){
          ADK.write (SDoutBuffer,34);
        }
      } // end if (LogFile)
      LogFile.close();
      SDoutBuffer[3]   =  0xFF;  // reset SD buffer
      SDoutBuffer[5]   =  0xFF;
      SDoutBuffer[11] =  0xFF;
      SDoutBuffer[13] =  0xFF;
      SDoutBuffer[19] =  0xFF;
      SDoutBuffer[21] =  0xFF;
      break;
  } // end switch
}// end void PrepareDataForSD()
Part 7 is the function that creates and sends an OK reply and is called when a good packet is received from the XBee network. The packet is created dynamically to be able to send the reply packet to the originating sensor node. The packet is formed in the same fashion as every XBee API transmit request that has been generated thus far. The packet is formed in a buffer with the proper formatting before being sent. The packet’s data is constant; the only change is that of the address.
Listing 8-3. Data Logger and ADK Handler, Part 7 of 8
void SendOK(){
  delay (50);
  byte length = 2;
  byte Outdata[2] = {'O', 'K'};
  OutPacketBuffer[17 + length] = 0; // clear checksum byte
  OutPacketBuffer[0] = 0x7E;    // start byte
  OutPacketBuffer[1] = 0;       // 1st length byte will be zero with current limitations
  OutPacketBuffer[3] = 0x10;    // transmit request frame type
  OutPacketBuffer[4] =  0;         // frame ID
  for (int i = 5; i <= 14; i++){     // add addresses
    OutPacketBuffer[i] = sourceADR[i-5];
  }
  OutPacketBuffer[15] = 0 ;          // set both options
  OutPacketBuffer[16] = 0 ;
  for (int i = 0; i < length; i++){
    OutPacketBuffer[i + 17] =  Outdata [i];  // add data to packet
  }
  OutPacketBuffer[2] = 14 + length;      // set the lower length byte
  for (int i = 0; i <  OutPacketBuffer[2]; i++){   // start calculating errorsum
    OutPacketBuffer[17+ length] =  OutPacketBuffer[17+ length] + OutPacketBuffer[i+3];
  }
  // finish packet by adding checksum
  OutPacketBuffer[17+ length]= 0xFF - OutPacketBuffer[17+ length];
  Serial3.write(OutPacketBuffer, (18 + length));
  lastReply = true;
}// end void SendOK()
In Part 8, the last function included in the Arduino sketch handles the Open Accessory connection. This function is pulled at a regular interval to check for incoming data from the Android device. When the Android device is connected, a Boolean flag is set to true to avoid running the isConnected function too often by other functions that need to know when the Android device is connected. A predetermined set of bytes are used as commands from the Android device to allow for syncing of the log information, deleting the log, or disconnecting the Android device from the Arduino. The command for syncing the data is an ASCII a; when this command is issued from the Android device, the Arduino will read the log file 34 bytes at a time and send the information to the Android device for further processing. When a command of a b is received, the Arduino will stop sending updated information to the Android. The log file will be deleted when a command of c is received. If the Android device is not connected, the two flags that control the sending of updated data to the Android device are set to false.
Listing 8-3. Data Logger and ADK Handler, Part 8 of 8
void HandleADK(){
  if (ADK.isConnected()) {
    delay (100);
    ADKisConnected = true;
    if (ADK.available() > 0){    // check for incoming data
      switch (ADK.read()){
        case 'a': {
          Serial.println('a'),
          File LogFile = SD.open("sensor.log");
          If (LogFile) {
            while (LogFile.available()) { // read bytes into buffer
              for (int i = 0; i < 34; i ++){
                SDinBuffer[i] = LogFile.read();
              }
             ADK.write (SDinBuffer, 34);
            } // end while (LogFile.available())
            LogFileSyncADK = true;
            LogFile.close();
          }  // end if (LogFile)
          break;
        } // end case 'a':
        case 'b':
          LogFileSyncADK = false;
          break;
        case 'c':
          SD.remove("sensor.log");
          break;
      }// end switch (ADK.read())
    } // end if (ADK.available() > 0)
  }  // end if (acc.isConnected())
  else{
     ADKisConnected = false;
     LogFileSyncADK = false;
  }
}// end HandleADK()
When all the code is complete for the Arduino sketch, compile and upload it to the Arduino Mega ADK with the SD adapter and the XBee module connected. The openFrameworks program needs to be started to ensure that the WaitForReply function calls are uncommented and the program is recompiled. Insert an SD card into the Arduino and power on the setup. When the Arduino is powered on, the openFrameworks program should start to send data and move through the data arrays. The serial monitor can be used to see the data being written to the SD card after three sensors have be sent and received.
Now that the data is being logged to the SD card, the ADK monitor program that was created in Chapter 4 can be used to verify that the data is getting sent to the Android device. While the Arduino and openFrameworks are running, plug the Android device into the host side of the Mega ADK and wait till the Android program detects the event. A command can be sent to the Mega ADK when an a is sent; in this case the log data should be printed to the Android screen. The data should match the printed data on the Arduino serial monitor and should update at about the same time while connected.
![]() Note Before the Android program is complete, you can verify the data on the SD card by using a hex editor to read the sensor.log file when the SD card is read by a computer.
Note Before the Android program is complete, you can verify the data on the SD card by using a hex editor to read the sensor.log file when the SD card is read by a computer.
In this section, we’ll make the Android program display the data in a more human-readable format. The example adds a chart that graphs the data in a fashion similar to the openFrameworks code. The layout of the program is shown in Figure 8-3. The graph is drawn at the top of the screen above the monitor box. Making the graph is a bit difficult to do from scratch, so a library is used to add the functionality. The library that is going to be used is called AChartEngine. The chart library adds the ability to make scatter plots, pie charts, and line or bar graphs that can be created dynamically and can be pinched, zoomed, and scrolled. The binary distribution of the library needs to be downloaded from www.achartengine.org.
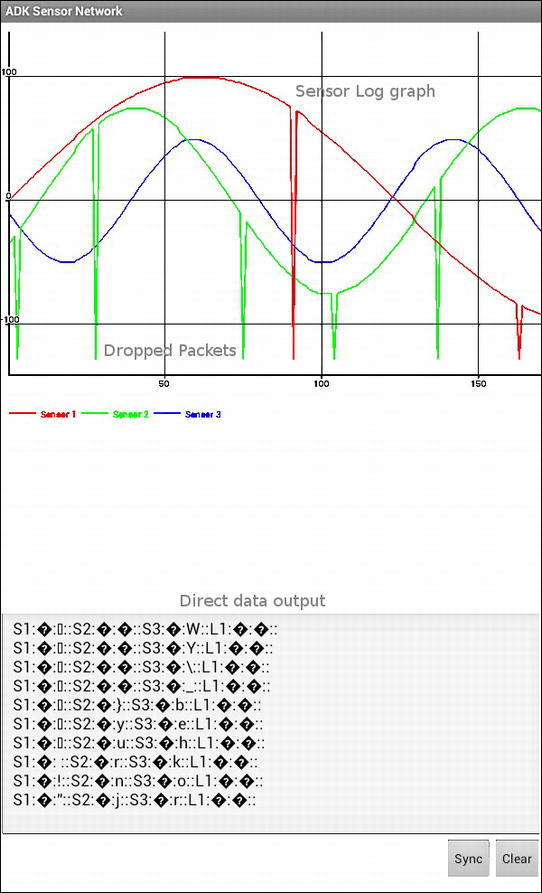
Figure 8-3 . The running Android application
The program that this example creates uses the same framework that was created in Chapter 4. A new project can be created in the Eclipse IDE and the framework section copied over using the same method as the original setup. To use the library, create a folder named libraries in the RES folder in the project’s workspace, and drag and drop the achartengine-1.0.0.jar file into the newly created folder. Right-click the added JAR file in the workspace and select Build Path ![]() Add to Build Path from the pop-up menu to make the library fully ready for use. The JAR file will move from the location copied to the Referenced Libraries workspace folder when it is properly added to the build path.
Add to Build Path from the pop-up menu to make the library fully ready for use. The JAR file will move from the location copied to the Referenced Libraries workspace folder when it is properly added to the build path.
The Javadocs of the AChartEngine library can be a great help on how to use it (see www.achartengine.org). Note that this example only focuses on one possible implementation of the chart engine and only uses the line graph setup.
The Android application needs a different main.xml file and a strings.xml file. Listing 8-4 is the main.xml file that needs to be created. The graph is created in a nested layout inside of the main relative layout within the main.xml file. The LinearLayout tag defines the space that will be used to place the graph created at run time. An Edit text box is used to display the incoming data from the Arduino and has the same functionality as the data-display box for the ADK monitor program. Two buttons are also created in the main.xml file for the layout: one to sync the data stored on the SD card and receive current updates while plugged in, and the other to clear the data from the screen. Both buttons are set up to call a respective function in the activity class.
Listing 8-4. main.xml
<?xml version="1.0" encoding="utf-8"?>
<RelativeLayout xmlns:android="http://schemas.android.com/apk/res/android"
    android:id="@+id/relativeLayout1"
    android:layout_width="fill_parent"
    android:layout_height="fill_parent"
    android:layout_weight="0.72" >
    <LinearLayout
        android:id="@+id/chart"
        android:layout_width="fill_parent"
        android:layout_height="500dp"
        android:layout_alignParentTop="true"
        />
    <EditText
        android:id="@+id/incomingData"
        android:layout_width="wrap_content"
        android:layout_height="250dp"
        android:layout_above="@+id/syncbutton"
        android:layout_alignParentLeft="true"
        android:layout_alignParentRight="true"
        android:scrollbars="vertical"
        android:clickable="false"
        android:cursorVisible="false"
        android:focusable="false"
        android:focusableInTouchMode="false"
        android:gravity="top"
        android:inputType="textMultiLine|textNoSuggestions"
        android:hint="@string/hint" />
    <Button
        android:id="@+id/clear"
        android:layout_width="wrap_content"
        android:layout_height="wrap_content"
        android:layout_alignParentBottom="true"
        android:layout_alignParentRight="true"
        android:onClick="clearScreen"
        android:text="@string/clear" />
    <Button
        android:id="@+id/syncbutton"
        android:layout_width="wrap_content"
        android:layout_height="wrap_content"
        android:layout_alignParentBottom="true"
        android:layout_toLeftOf="@+id/clear"
        android:onClick="SyncData"
        android:text="@string/sync" />
</RelativeLayout>
Listing 8-5 is the strings.xml file and defines the new application name, a hint for the Edit text box, and the name of the two buttons. As stated in Chapter 4, putting the information in the strings.xml file saves you from having to go to every instance that will be used to change a name. When this application is loaded on the Android device, it will have a different name than that of the ADK monitor, but will still respond to the same accessory name declared in the Arduino sketch. Sharing the same information is not a problem if the default program option on the autorun pop-up menu is not selected. The Android device will give a series of options if there are multiple programs that use the same accessory. If the multiple options are undesirable, change the declaration to a new accessory name in the Arduino sketch, and change the accessory_filter.xml file in the Android project to reflect the changes.
Listing 8-5. strings.xml
<?xml version="1.0" encoding="utf-8"?>
<resources>
    <string name="app_name">ADK Sensor Network</string>
    <string name="hint">Data from Arduino board will be displayed here</string>
    <string name="sync">Sync</string>
    <string name="clear">Clear</string>
</resources>
New objects for the chart engine need to be imported for you to use the graphing capabilities in the application. Listing 8-6 shows the new imports needed for the chart that will be used. ChartFactory and GraphicalView make up the main core of the chart engine. There is a data class that contains the data in a series for the graph using Cartesian x- and y- coordinates for the point’s position. XYMultipleSeriesDataset is used for a class that will contain all the series data that will need to be displayed on the screen. XYSeriesRenderer and XYMultipleSeriesRenderer are needed to get the data rendered properly. The import android.graphics.Color is used to get classes that predefine colors such as red, green, and blue to make color use a bit easier. The import android.widget.LinearLayout will allow the blank layout to be accessible for adding the graph to the layout space defined in main.xml. Add the import in Listing 8-6 to the beginning of the ADK framework from Chapter 4.
Listing 8-6. New Imports for Using the AChartEngine Library
import org.achartengine.ChartFactory;
import org.achartengine.GraphicalView;
import org.achartengine.model.XYMultipleSeriesDataset;
import org.achartengine.model.XYSeries;
import org.achartengine.renderer.XYMultipleSeriesRenderer;
import org.achartengine.renderer.XYSeriesRenderer;
import android.graphics.Color;
import android.widget.LinearLayout;
import android.widget.View;
import android.widget.Button;
import android.widget.EditText;
Listing 8-7 defines the new variables that need to be added to the framework to define the chart and the data that will be drawn to the screen. The first two new variables declare the multiple-series data set and the renderer. The data-set variable contains the three series that will make up the data from the sensors. The renderer uses the data set to display the data and is used by the SensorChartView class’s repaint function. Options for the renderer are set in the SetupGraph function, described later. Each piece of the sensor’s data is contained in a simple XYSeries variable declared with the name on creation and will have data added to it as it is received from the Arduino board. The linear layout has to be declared so that the registerUIobjects function can add the graph to the view for the user. The buttons and the Edit text box are added in the same way as the ADK monitor. The last six variables are used to store information for the placement within the graph and the beginning limits to display, along with a Boolean to inform functions of the status of the synchronization with the Arduino board. Add the variables in Listing 8-7 to the program after the beginning of the activity class and before the first function.
Listing 8-7. New Variables for the Android Sensor Network Application
// chart variables
private XYMultipleSeriesDataset SensorData = new XYMultipleSeriesDataset();
// the XYMultipleSeriesRenderer spans two lines in the book
private XYMultipleSeriesRenderer SensorRenderer = new XYMultipleSeriesRenderer();
private XYSeries Sensor1CurrentSeries = new XYSeries("Sensor 1");
private XYSeries Sensor2CurrentSeries = new XYSeries("Sensor 2");
private XYSeries Sensor3CurrentSeries = new XYSeries("Sensor 3");
private GraphicalView SensorChartView;
// chart container and other UI objects
private LinearLayout layout;
private Button buttonSync;
private Button ScreenClear;
private EditText DataFromArduino;
// chart control variables
double[] limits = new double[] {0, 500000,-127,127}; // for chart limits
double x = 0;
double y = 0;
double xCount = 0;
double lastMinX = 0;
boolean Sync = false;
Listing 8-8 is the function that registers the user interface objects to the code. Both of the buttons and the text box are set to the defined objects in main.xml, as was done in prior Android applications. The chart is a bit unusual because the chart view must be added to the linear layout; this is done by adding the output of ChartFactory’s getLineChartView function to the SensorChartView variable. Some information has to be included with the getLineChartView function call—the instance of the program along with the data set and renderer that will be used with the chart need to be passed to the function. Then the SensorChartView variable id added to the linear view before this function is finished.
Listing 8-8. New registerUIobjects Function
private void registerUIobjects(){
  buttonSync = (Button) findViewById(R.id.syncbutton);
  ScreenClear = (Button) findViewById(R.id.clear);
  DataFromArduino = (EditText)findViewById(R.id.incomingData);
  layout = (LinearLayout) findViewById(R.id.chart);
  // the next line spans two in the book
  SensorChartView = ChartFactory.getLineChartView(this, SensorData,
  SensorRenderer);
  layout.addView(SensorChartView);
}// end registerUIobjects
The SetupGraph function defined in Listing 8-9 sets the options for how the graph will be rendered to the screen, and also links the individual data series to the graph. The overall options that are set include the color of the axes, the text size, the axes’ minimums and maximums, and the pan limitations. The color of the data series is controlled by individual renderers that are added to the multi-series renderer variable. There are a lot of options that can be set for the graph; be sure to check out the Java reference documentation at www.achartengine.org/content/javadoc/index.html for more in-depth information. The SetupGraph function needs to be called from the onResume function of the framework. Add the code line SetupGraph(); after the super.onResume(); line in the function. The SetupGraph function is called from this function to ensure that the graph will be set up correctly every time the program resumes.
Listing 8-9. Function That Defines How the Graph Is Drawn
public void SetupGraph(){
   // set chart-drawing options
   SensorRenderer.setAxisTitleTextSize(10);
   SensorRenderer.setChartTitleTextSize(10);
   SensorRenderer.setLabelsTextSize(10);
   SensorRenderer.setLegendTextSize(10);
   SensorRenderer.setMargins(new int[] {10, 10, 10, 0});
   SensorRenderer.setAxesColor(Color.WHITE);
   SensorRenderer.setShowGrid(true);
   SensorRenderer.setYAxisMin(−127);
   SensorRenderer.setYAxisMax(127);
   SensorRenderer.setXAxisMin(0);
   SensorRenderer.setXAxisMax(100);
   SensorRenderer.setPanLimits(limits);
   // add the three series to the multi-series data set
   SensorData.addSeries(Sensor1CurrentSeries);
   SensorData.addSeries(Sensor2CurrentSeries);
   SensorData.addSeries(Sensor3CurrentSeries);
   // set color options for the data lines to match graph openFrameworks
   XYSeriesRenderer Sensor1renderer = new XYSeriesRenderer();
   Sensor1renderer.setColor(Color.GREEN);
   XYSeriesRenderer Sensor2renderer = new XYSeriesRenderer();
   Sensor2renderer.setColor(Color.YELLOW);
   XYSeriesRenderer Sensor3renderer = new XYSeriesRenderer();
   Sensor3renderer.setColor(Color.BLUE);
   // add the sensor graph with set options to the graph
   SensorRenderer.addSeriesRenderer(Sensor1renderer);
   SensorRenderer.addSeriesRenderer(Sensor2renderer);
   SensorRenderer.addSeriesRenderer(Sensor3renderer);
} // end SetupGraph
The message handler function that is linked to the thread that is created to check for incoming data from the Arduino is where the program dynamically updates the graph. Because the data is well formatted at the point it is sent from the Arduino, and the data is consistently sized, the parsing is pretty straightforward—we have only to look at specific places in the data buffer. This is only possible if the data transition is reliable; in a more refined setup, a verification step should be used to check that the transition is what is expected. The connection between the Android device and the Arduino is decently reliable, so this example does not add the verification complexity.
Once the data is received from the Arduino, the three sensors’ data is pulled from the 34-byte array and added as the y value to the appropriate series of data. Because the data that was sent to the Arduino from openFrameworks was normalized to a unsigned byte, you have to normalize the data back to a zero value of the sine wave function by subtracting 127 from the sensor value to make the byte signed. The x value is controlled by a count that is incremented every time a data transition is received; the same count value is added to all three series. A special function is called after the data is added to the graph to check if the data is outside of the view; if so, it will scroll to the last position, keeping the current incoming data always in the view area. The old data is not lost as the graph scrolls, and can be viewed by scrolling back to the left.
After the graph is printed to the screen, the entire data buffer is appended to the text box to add an extra view for possible debugging. The information in the text box could be accessed for further processing, such as saving the data to a file on the Android device. A decent tutorial on reading and writing to the storage of an Android device can be found at www.java-samples.com/showtutorial.php?tutorialid=1523. This tutorial can be modified to work with this example because the data is printed to a text box. Listing 8-10 replaces the existing incoming data handler within the framework.
![]() Note Some online examples for AChartEngine call for a separate thread to be created to be able update the chart dynamically for new data. This is not necessary for ADK applications, because of the existing thread used to respond to incoming information from the Mega ADK. This thread provides an event to update the graph when new data is received.
Note Some online examples for AChartEngine call for a separate thread to be created to be able update the chart dynamically for new data. This is not necessary for ADK applications, because of the existing thread used to respond to incoming information from the Mega ADK. This thread provides an event to update the graph when new data is received.
Listing 8-10. Incoming Data Handler Function
Handler IncomingDataHandler = new Handler() {
  @Override
  public void handleMessage(Message msg) {
    BufferData IncomingBuffer = (BufferData) msg.obj;
    byte[] buffer = IncomingBuffer.getBuffer();
    // pull and add sensor data to the graph
    byte sen1 = (byte) (buffer[5] - 127);
    byte sen2 = (byte) (buffer[13] - 127);
    byte sen3 = (byte) (buffer[21] - 127);
    Sensor1CurrentSeries.add(xCount,  sen1 );
    Sensor2CurrentSeries.add(xCount,  sen2 );
    Sensor3CurrentSeries.add(xCount,  sen3 );
    // check if a scroll is needed
    refreshChart();
    xCount++;
    if (SensorChartView != null) {
      SensorChartView.repaint();
    }
    // add data buffer to text box
    String str = new String(buffer);
    DataFromArduino.append(str);
  }// end handleMessage(Message msg)
};// end Handler IncomingDataHandler = new Handler()
The refreshChart function described in Listing 8-11 provides the mechanism to scroll the graph when the current incoming data exceeds the view area on the screen. The scroll is accomplished by checking if the current x value count is greater than the highest value of the graph being drawn. When the count is greater, the function increments the minimum x value and sets the values of the minimum and the new maximum to the graph, creating the scrolling effect.
Listing 8-11. Function to Keep the Graph Focused on the Most Current Data
private void refreshChart() {
  // check if a shift of the graph view is needed
  if (xCount > SensorRenderer.getXAxisMax()) {
    SensorRenderer.setXAxisMax(xCount);
    SensorRenderer.setXAxisMin(++lastMinX);
  }
  SensorChartView.repaint();
}
![]() Caution The graph will fail to redraw when the Android device rotates to a new orientation. This happens because the application has not been programmed to handle the screen-rotation event.
Caution The graph will fail to redraw when the Android device rotates to a new orientation. This happens because the application has not been programmed to handle the screen-rotation event.
Listing 8-12 shows the last two functions needed to complete the Android application. The first function is the clearScreen function, associated with the Clear button. The clearScreen function sends a command of an ASCII b to the Arduino to inform it that the Android device is no longer synchronized. The clearScreen function then performs an operation to reset the graph and the text box back to their initial settings.
The SyncData function is associated with the Sync button on the user interface; it first checks whether the data is currently synchronized to avoid resending the data when the button is clicked multiple times. The SyncData function send an ASCII command of a to the Arduino, initiating the transfer of the sensor.log file located on the SD card attached to the Arduino. The transfer is captured by the running thread that is checking for incoming data. The Arduino transfers 34 bytes at a time to the Android device, and the information of the three sensors is added to the graph. While the Arduino is connected and the data has been synchronized, new data will be transferred to the Android device and recorded to the log file on the SD card.
Listing 8-12. Clear-Screen and Sync-Data Button Events
public void clearScreen(View v) {
  byte[] BytestoSend = new byte[1];
  BytestoSend[0] = 'b';
  write(BytestoSend);
  Sensor1CurrentSeries.clear();
  Sensor2CurrentSeries.clear();
  Sensor3CurrentSeries.clear();
  xCount = 0 ;
  lastMinX = 0 ;
  SensorRenderer.setYAxisMin(−127);
  SensorRenderer.setYAxisMax(127);
  SensorRenderer.setXAxisMin(0);
  SensorRenderer.setXAxisMax(100);
  Sync = false ;
  SensorChartView.repaint();
  DataFromArduino.setText(null);
}// end clearScreen

public void SyncData(View v) {
  if (!Sync){
    byte[] BytestoSend = new byte[1];
    BytestoSend[0] = 'a';
    write(BytestoSend); // sends buffer to the ADK
    Sync = true;
  }
} // end void SyncData(View v)
After the updates described in this example are added to the ADK framework and a final check for errors is done, the application can be uploaded to a target Android device. Start and run the openFrameworks program and the Arduino without the Android connected, and let them run for a while to build some data in the log file. When a sufficient amount of data is sent, connect the Android device without restarting the Arduino. A pop-up menu should appear, asking for permission to run a program. Select the ADK Sensor Network program. Synchronize the data when the program is ready, and observe the graph and compare to the one drawn by the openFrameworks program. The red line in the openFrameworks program should match the last position of the Android graph.
![]() Note The Android application may have to be forcefully stopped each time it is run because the thread sometimes does not stop properly. More robust thread handling is required for final products.
Note The Android application may have to be forcefully stopped each time it is run because the thread sometimes does not stop properly. More robust thread handling is required for final products.
Summary
The example series in this chapter showed one method of integrating Android into a sensor network and provided a review of other concepts introduced in other chapters of this book. The possible combinations of what the sensor network observes and measures and the different technologies that can be used to achieve a final product are limitless. The example series is not intended to be a final product, but a starting point for further exploration into sensor networks and integration. An extra challenge that can be tackled with this chapter’s concepts is using a third XBee module and another USB adapter connected to a different computer to add three more simulated sensors. The most important thing about sensor networks, Arduino, and Android is that you should explore the technology to get more familiar with more advanced techniques so you can use them in future projects.