
Contents
The Five-Factor Reactor Example
The following example, adapted from Meyer et al. (1996) and Box, Hunter, and Hunter (1978), shows a five-factor reactor example.
Previously, the screening designer was used to investigate the effects of five factors on the percent reaction of a chemical process (see Screening Designs). The factors (Feed Rate, Catalyst, Stir Rate, Temperature, and Concentration) are all two-level continuous factors. The next example studies the same system using a full factorial design.
1. Select DOE > Full Factorial Design.
2. Click the red triangle icon on the Full Factorial Design title bar and select Load Responses.
3. In the Sample Data folder (installed with JMP), open Reactor Response.jmp found in the Design Experiment folder.
4. Click the red triangle icon on the Full Factorial Design title bar and select Load Factors.
5. In the Sample Data folder (installed with JMP), open Reactor Factors.jmp found in the Design Experiment folder.
The completed dialog should look like the one shown in Figure 7.2.
Figure 7.2 Full Factorial Example Response and Factors Panels

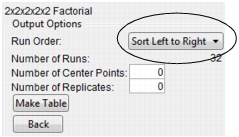
6. Click Continue to see the Output Options panel. In the Output Options panel, select Sort Left to Right from the Run Order menu, as shown to the right. This command defines the order of runs as they will be in the final JMP design table.
7. Click Make Table.
The design data table (Figure 7.3) contains a run for every combination of high and low values for the five variables, which covers all combinations of five factors with two levels each. Since there are five variables, there are 25=32 runs. Initially, the table has an empty Y column named Percent Reacted for entering response values when the experiment is complete.
To see the completed experiment and continue this example, open Reactor 32 Runs.jmp found in the Design Experiment Sample Data folder.
Figure 7.3 Partial Listing of Reactor 32 Runs.jmp from the Sample Data Folder

Analyze the Reactor Data
Begin the analysis with a quick look at the response data before fitting the factorial model.
1. Select Analyze > Distribution.
2. Highlight Percent Reacted and click Y, Columns. Then click OK.
3. Click the red triangle icon on the Percent Reacted title bar and select Normal Quantile Plot. The results are shown in Figure 7.4.
Figure 7.4 Distribution of Response Variable for Reactor Data

This initial analysis shows some experimental runs with a very high percent reacted response.
Start the formal analysis with a stepwise regression. The data table has a script stored with it that automatically defines an analysis of the model with main effects and all two-factor interactions.
4. Click the red triangle icon next to the Fit Model script and select Run Script. The stepwise analysis begins with the Stepwise Regression Control panel shown in Figure 7.5.
5. Select P-value Threshold from the Stopping Rule list.
6. The probability to enter a factor (Prob to Enter) in the model should be 0.05.
7. The probability to remove a factor (Prob to Leave) should be 0.1.
8. A useful way to use the Stepwise platform is to check all the main effects in the Current Estimates table. However, make sure that the menu beside Direction in the Stepwise Regression Control panel specifies Mixed (see Figure 7.5).
Figure 7.5 Stepwise Control Panel

9. Check the boxes for the main effects of the factors as shown in Figure 7.6.
Figure 7.6 Starting Model For Stepwise Process

10. Click Go.
The mixed stepwise procedure removes insignificant main effects and adds important interactions. The end result is shown in Figure 7.7. Note that the Feed Rate and Stir Rate factors are no longer in the model.
Figure 7.7 Model After Mixed Stepwise Regression
11. Click the Make Model button in the Stepwise Regression Control panel. The Model Specification window that appears is automatically set up with the appropriate effects (Figure 7.8).
Figure 7.8 Fitting a Prediction Model

12. Click Run to see the analysis for a candidate prediction model (Figure 7.9).
The figure on the left in Figure 7.9 shows the actual by predicted plot for the model. The predicted model covers a range of predictions from 40% to 95% reacted. The size of the random noise as measured by the RMSE is only 3.3311%, which is more than an order of magnitude smaller than the range of predictions. This is strong evidence that the model has good predictive capability.
The figure on the right in Figure 7.9 shows a table of model coefficients and their standard errors (labeled Parameter Estimates). All effects selected by the stepwise process are highly significant.
Figure 7.9 Actual by Predicted Plot and Prediction Parameter Estimates Table

The factor Prediction Profiler also gives you a way to compare the factors and find optimal settings.
1. To open the Prediction Profiler, click the red triangle on the Response Percent Reacted title bar and select Factor Profiling > Profiler.
Figure 7.10 shows the profiler’s initial display. The Prediction Profiler is discussed in more detail in the chapter Response Surface Designs, and in Modeling and Multivariate Methods.
Figure 7.10 Viewing the Profiler

2. Click the red triangle on the Prediction Profiler title bar and select Maximize Desirability to see the profiler in Figure 7.11.
Figure 7.11 Viewing the Prediction Profiles at the Optimum Settings

The goal is to maximize Percent Reacted. The reaction is unfeasible economically unless the Percent Reacted is above 90%. Percent Reacted increases from 65.5 at the center of the factor ranges to a predicted maximum of 95.875 ± 2.96 at the most desirable settings. The best settings of all three factors are at the ends of their ranges. Future experiments could investigate what happens as you continue moving further in this direction.
Creating a Factorial Design
To start a full factorial design, select DOE > Full Factorial Design, or click the Full Factorial Design button on the JMP Starter DOE page. Then, follow the steps below:
Enter Responses and Factors
The steps for entering responses are outlined in Enter Responses and Factors into the Custom Designer
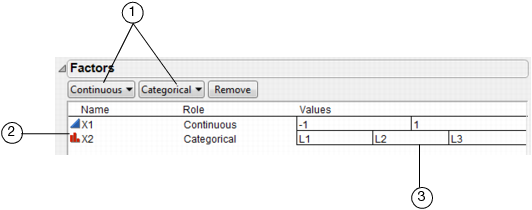
The steps for entering factors in a full factorial design are unique to this design. To add factors, see Figure 7.12.
1. To enter factors, click either the Continuous button or the Categorical button and select a factor type, level 2 - 9.
2. Double-click to edit the factor name.
3. Click to enter values or change the level names.
Figure 7.12 Entering Factors in a Full Factorial Design
When you finish adding factors, click Continue.
Select Output Options
Use the Output Options panel to specify how you want the output data table to appear, as illustrated in Figure 7.13:
Figure 7.13 Output Options Panel

Run Order gives options to designate the order you want the runs to appear in the data table when it is created. Choices are:
Keep the Same
the rows (runs) in the output table will appear in the standard order.
Sort Left to Right
the rows (runs) in the output table will appear sorted from left to right.
Randomize
the rows (runs) in the output table will appear in a random order.
Sort Right to Left
the rows (runs) in the output table will appear sorted from right to left.
Add additional points to the data table with these options:
Number of Center Points
Specifies additional runs placed at the center of each continuous factor’s range.
Number of Replicates
Specify the number of times to replicate the entire design, including center points. Type the number of times you want to replicate the design in the associated text box. One replicate doubles the number of runs.
Make the Table
When you click Make Table, the table shown in Figure 7.14 appears.
Figure 7.14 Factorial Design Table

The name of the table is the design type that generated it.
Run the Model script to fit a model using values in the design table.
Values in the Pattern column describe the run each row represents.
• For continuous factors, a plus sign represents high levels.
• For continuous factors, a minus sign represents low levels.
• Level numbers represent values of categorical factors.
..................Content has been hidden....................
You can't read the all page of ebook, please click here login for view all page.