
Data Management
Introduction
The objective of this
case is to become familiar with the VA medical center appointment
backlog data and the characteristics of the various medical centers.
Since there are multiple variables to explore, we will focus on multivariate
data visualizations. Examining the data table we see that the hospitals
are identified by either Provider ID or Hospital Name. In some cases,
Hospital Name is quite long, and when plotted the axis labels will
take up a disproportionate amount of space on the graph. Provider
ID, while shorter, is a unique identifier that is not informative.
Since the data file is relatively small, a new variable could be
created manually with shortened hospital names. Another option is
to create a hospital identifier that contains the city and state where
the medical center is located.
Concatenating Two Columns
Figure 9.1 Concatenating City and State Columns

Creating a New Column
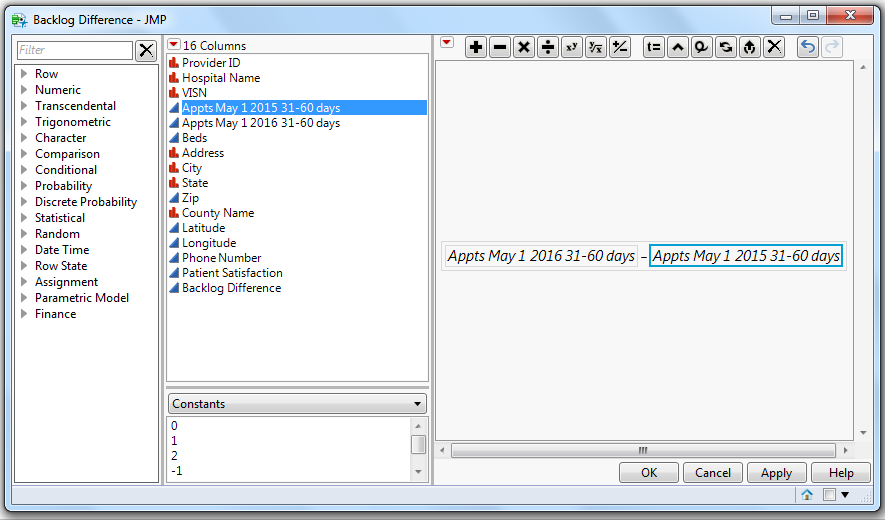
It is of interest to know if the VA
medical centers are making progress towards reducing the backlog of
appointments. To create the difference in the number of veterans
waiting 31-60 days for an appointment, a new column should be created
that subtracts the May 2015 backlog from the May 2016 backlog. Figure 9.2 Formula to Create the Backlog Difference shows the formula
to create the new column, Backlog Difference.
Figure 9.2 Formula to Create the Backlog Difference
It would be helpful
to move the Backlog Difference column adjacent to the two columns
that show the 2015 and 2016 backlogs. Select Cols > Reorder Columns
> Move Selected Column as shown in Figure 9.3 Reordering a JMP Column and from the
resulting Columns list move Backlog Difference after Appts May 1 2016
31-60 days.
Figure 9.3 Reordering a JMP Column

The data file is now
ready for analysis.
Last updated: October 12, 2017
..................Content has been hidden....................
You can't read the all page of ebook, please click here login for view all page.