
Water vapour and liquid permeability measurements in concrete
Abstract
This chapter shows how water permeability may be calculated from measurements of drying under a vacuum. The results obtained are for water vapour transport at low pressures, and gas slippage theory is then used to compare them with liquid water permeability measurements on samples of the same mixes. The experimental work includes the drying procedure and also the ISAT and the high pressure test for direct permeability measurements. The results from all of these tests are compared and additional gas and liquid permeability data from Chapter 5 are included for comparison. It is concluded that, with appropriate analysis, all of the procedures give comparable values for intrinsic permeability.
Key words
mortar drying; permeability; absorption test; ISAT; vapour permeability
7.1 Introduction
The processes which take place when concrete is dried are substantially controlled by the transport properties and thus observations of drying may be used to calculate values for the transport parameters. It is possible to consider the movement of water vapour from the drying front in terms of either vapour diffusion or pressure-driven flow. Following from the discussion in Section 1.2.2, it is apparent that the two approaches lead to the same equations so either approach may be used. In this chapter, the permeability is used and thus a number of other tests for permeability have been used to compare with results for the drying test on the same mixes.
7.2 Experimental methods
7.2.1 Sample preparation
Four mortar mixes were used and the mixture proportions and strengths are shown in Table 7.1. The test specimens (dimensions are detailed in each test procedure) were cast and kept under wet hessian for one day before demoulding. All samples were then cured in water at 20 °C until testing at 28 days. All testing was carried out at 20 ±2 °C.

7.2.2 The drying test
Samples were cast in cylindrical moulds 30 mm diameter by 50 mm long. The moulds were laid on their sides for setting in order to keep their ends under identical conditions. After curing, PVC adhesive tape was wound round the curved surfaces of the cylinders to prevent moisture evaporation except from the top and bottom ends. The cylinders were then placed in a glass desiccator connected to a vacuum pump with a 0–25 mbar (0–2.5 kPa) pressure gauge on it. The vacuum pump was run until the air in the desiccator became dry, as indicated by the colour change of silica gel in the desiccator (this took up to 30 h). The colour changes at water content of 8 % by mass which occurs at a humidity of 15 % at atmospheric pressure, i.e. a partial vapour pressure of 0.3 kPa.
The vacuum pressure was monitored during the drying process. At different times, samples were taken out of the desiccator and weighed and then split down the axis and the depth of drying at each end was measured visually. No precautions were taken to prevent carbonation of the samples but, since the experiments only lasted for a few days, the weight gain from this process was not considered to be significant.
7.2.3 Oven drying
Specimens were dried in an oven for 3 days at 105 °C to calculate porosity.
7.2.4 Water permeability
The water permeability was measured in a modified Hoek cell as described in Section 4.2.2. Due to the high pressures used, the flow through the samples became constant only approximately 1 h after the start of the test for most of the samples. The flow rate was determined by measuring the rate of water flowing from the upper surface using a graduated measuring cylinder.
7.2.5 The ISAT test
The initial surface absorption test (ISAT) was carried out as described in Section 3.2.
7.2.6 Water absorption (sorptivity) test
Cubes from mix C (100 mm) were oven dried at 105 °C and then immersed in water to a depth of 20 mm and the mass gain was recorded at intervals up to 2 h. The test is described in Section 4.2.1.
7.2.7 Test programme
The programme of testing is shown in Table 7.2.
Table 7.2
| Test | Mixes tested | Number of replicates | Properties measured |
| Drying | A, B, C, D | 3 (6 of mix C) | Dry depth, mass loss and pressure |
| High pressure permeability | A, B, C, D | 2 | Flow rates in steady state |
| ISAT | C | 2 | Flow rates at 10, 20, 30, 60 and 120 min |
| Adsorption | C | 2 | Mass at 0, 5, 15, 30, 60 and 120 min |

7.3 Methods of analysis of results
7.3.1 Transport processes
For the analysis of the results, it is necessary to determine which processes are transporting the water during the tests. The main process that is considered in this chapter is pressure-driven flow measured by permeability as described in equations (1.4) and (1.7)
It should also be noted that equation (1.4) can only be applied to a steady state in which the pressure is constant. For all of the work in this chapter, equation (1.7) was integrated with respect to time and the condition of constant pressure through the time step is therefore met as the time step approaches zero.
7.3.2 The drying test
The rate of loss of moisture from the specimens will be governed by the movement of vapour from the drying front to the surface. There are two possible transport processes to consider for this test: pressure-driven flow and moisture diffusion. It is noted in Section 1.2.2 that for a gas or vapour where the concentration is proportional to the pressure the equations for the two mechanisms give the same result as shown in equation (1.19).
The pressure at any point in the system will be made up of contributions from several different gases and vapour. The effect of them will be additive and any pressure measurement will record the total. A change in one partial pressure will not affect the others. At the drying front, the pressure of water vapour will depend on the equilibrium with the adjacent liquid and will be determined by the temperature and surface tension. The pressure outside the sample will be determined by the vacuum pumping and will be substantially lower. Thus there is a pressure drop and the flow caused by it will be controlled by the permeability.
Diffusion is driven by a chemical concentration gradient and would typically be relevant to a liquid with a higher concentration of salt at one position than another. It is also used to measure the movement of one gas through another and could be the main mechanism to transport vapour through air from a drying surface. In this experiment, however, there is virtually no air present with the pressure in the desiccator reduced to 0.1 kPa (0.001 atm) and the diffusion coefficient for vapour through air cannot therefore be relevant. The transport is therefore controlled by permeability and is described by the Darcy equation (1.4) which may be expressed as:
[7.1]
where:
VF is the Darcy velocity for the water vapour (m/s)
Kv is the intrinsic permeability for the vapour (m2)
P is the vapour pressure difference (Pa) and
x is the distance from the drying front to the surface of the sample (m).
The Darcy velocity may be related to the movement of the drying front by equating the water volumes as follows:
[7.2]
where:
ε is the porosity
t is time (s) and
WF is the ratio of the water vapour volume to the volume of the same mass of water as a liquid.
Combining equations (7.1) and (7.2) and integrating gives:
[7.3]
The drying depth is related to the mass loss by the relationship:
[7.4]
where:
M is the cumulative mass loss (kg)
ρ is the density of liquid water (kg/m3) and
A is the cross-sectional area through which the transport is taking place (m2).
Equation (7.3) may be seen to have a similar form to the equation presented by Vuorinen and Valenta (cited by Neville (2011)) for water intruding into concrete under pressure:
[7.5]
where k is, in this case, the coefficient of permeability or hydraulic conductivity (m/s) and h is the head of water.
The partial pressure of water vapour above a liquid surface at 20 °C is 2 kPa. This pressure is correct for pure water but will have been affected by the presence of the dissolved ions in the water. This would be expected to lower the vapour pressure and lead to a slight reduction in the flow.
The measured pressure in the desiccator was initially 0.6 kPa but fell to 0.1 kPa during the test. Of the pressure in the desiccator, the partial pressure due to vapour will initially have been approximately 1 % of the total (which would be the case in a room at a humidity of 50 %). Thus the vapour pressure in the desiccator was below 1 % of 0.6 kPa and the drop in pressure from the drying front to the concrete surface was close to 2 kPa.
Not all of the pores will dry at exactly the same pressure. It has been shown (Vuorinen, 1970 and Section 6.7.5) by measuring gas permeabilities at different humidities that the Kelvin equation (3.1) gives a good indication of the pore sizes in concrete that will sustain a meniscus. This shows, however, that the smallest capillary pores (0.01 μm) will not sustain a meniscus below 90 % relative humidity (RH). Thus all the pores will empty of liquid within 10 % of the distance over which the pressure drops.
Using standard gas constants for a molecular mass of 18, the constant WF was calculated to be 1.25 × 10³ by assuming the vapour was an ideal gas. The viscosity of water vapour e = 2 × 10⁻⁵ Pa s.
7.3.3 Calculation of porosity from weight loss during oven drying
The porosity of the PC samples was calculated from the weight loss using the Powers model (Powers, 1960). For this calculation, the water and cement which combine to form hydrated cement are assumed to do so in a fixed ratio. Neville (2011) uses a w/c ratio of 0.23:1, but in this work a ratio of 0.25:1 has been used because it gave a better agreement with other measurements of porosity as discussed in Chapter 8.
The weight of the samples when cast Mwet was obtained by subtracting the weight of the container from the initial weight. The weight of water Mw in the wet sample was then calculated from the mix proportions. The dry weight Mdry was measured. Thus the mass of absorbed water is given by:
[7.6]
and from the assumption of the ratio of combination of 4:1, cement:water (i.e. w/c = 0.25), the mass of hydrated cement is given by:
[7.7]
The mass of each component of the hydrated sample was therefore known and the specific gravity of the sample was calculated from equation (7.8):
[7.8]
where the specific gravity (SG) is the mass divided by the net (skeletal) volume, and Mi and SGi are, respectively, the mass and specific gravity of component i.
The sum is across all of the components of the dry mix, i.e. cement, hydrated cement, aggregate (if present) and the solids in the admixtures. The specific gravity of each component was measured experimentally except for the hydrated cement for which a value of 2.15 g/cc was used (Neville, 2011). The dry density (DD) was obtained by dividing the dry mass by the volume obtained by weighing wet and dry and the porosity was then obtained from equation (7.9):
[7.9]
This is the standard equation for calculating the porosity of hydrated samples by measuring the dry and saturated densities.
7.3.4 The absorption and ISAT
For the ISAT, the transport process will be pressure-driven flow but, in this case, the pressure driving it will arise from the capillary suction at the wetting front. The flux is given in equation (4.12).
The terms for pore size and surface tension arise from the inclusion of capillary suction in the analysis. For the analysis of the ISAT results, it is only necessary to equate the Darcy velocity to the flux divided by the surface area and equation (4.12) may be used directly. The experiment gives a flow rate of water in a capillary tube and, if this is reduced in proportion to the ratio of the area of the capillary to the wetted concrete surface, the Darcy velocity is obtained.
For the analysis of the absorption results the flux is related to mass gain:
[7.10]
and equations (4.12) and (7.10) are integrated to give:
[7.11]
where M is the cumulative mass gain
7.3.5 The high pressure test
The high pressure test clearly measures the permeability and this was calculated from the observed flow rate by direct application of Darcy’s law (equation 4.2).
7.4 Results and discussion
Oven drying of the samples causes micro-cracking and will have contributed to the spread of data. The results are shown in Figs 7.1–7.6.

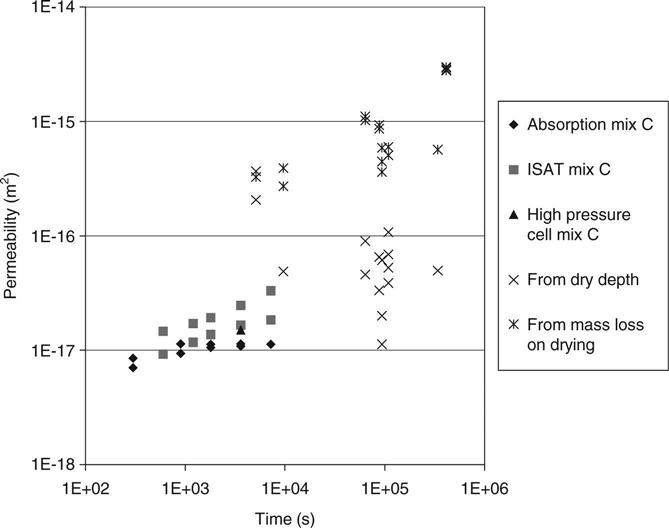
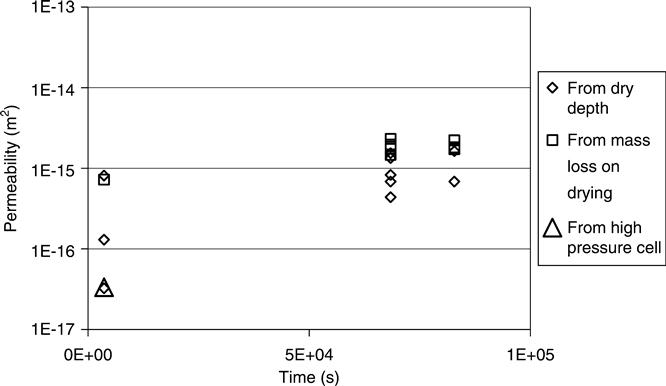

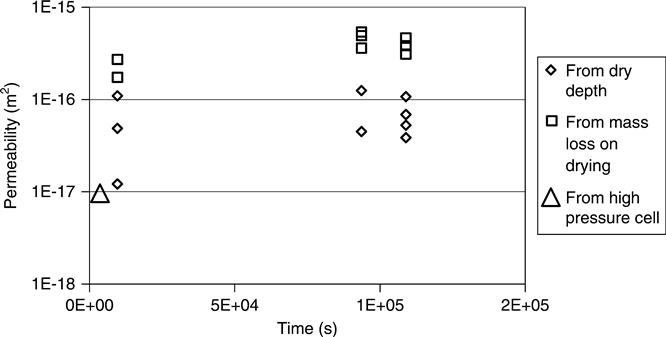
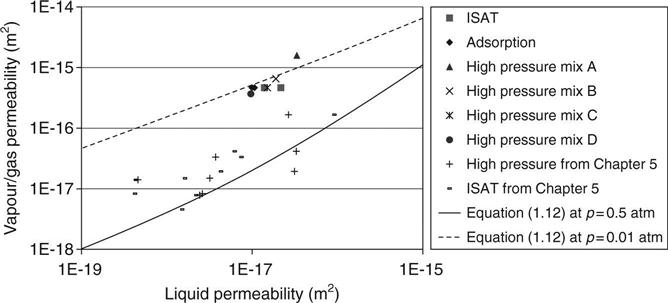
Figure 7.1 shows the average values for water permeability. It may be seen that the methods of analysis give consistent results from the different experiments and also the expected increase of permeability with w/c ratio.
7.4.1 Comparison of permeabilities from mass loss with those from drying depth
Figure 7.2 shows all of the permeability results for mix C. The first three series (adsorption, ISAT and high pressure) are very close. The vapour permeability would be expected to be substantially higher, but the results from the measured drying depths may be seen to fall over a very wide range. The results from mass loss are, however, grouped in an expected range and are therefore indicated to be far more reliable than the results from drying depth. The results from the drying depth measurements are generally lower than those for mass loss, indicating that significant drying may have occurred from regions which still appeared to be wet when the samples were inspected. Since the larger pores would dry first, this implies that the visible moisture was in the smaller ones (possibly below 0.1 μm).
The reduction in permeability which is normally observed during testing with water may be caused by sedimentation causing blocking of pores and would thus not be expected to occur during vapour transport.
Figures 7.3, 7.4 and 7.5 show the permeability vs time for mixes A, B and D for the high pressure cell and drying experiment data. These support the observation that the mass loss data was far more consistent than the observations of drying depth. They all also show the drying depth data giving lower results. The drying front was readily visible on the tested samples, but a further disadvantage of this method would be that on some samples (e.g. white cement) it could be very difficult to see. The mass loss was observed to be the more reliable test in these laboratory trials, but this conclusion might not be valid in other circumstances such as site testing.
The high pressure cell data which is for liquid rather than vapour is consistently lowest and the reasons for this are discussed below.
7.4.2 Relationship between liquid and vapour permeabilities
The Klinkenberg equation is discussed in Section 1.2.1. Values of b were calculated by Bamforth (1987) for concrete from the average values of water and gas permeability as follows:
[7.12]
in which β1 and β2 are constants and Bamforth proposed the values:
and
Substituting the value of b in equation (1.12), a relationship between water permeability and gas permeability is derived. Bamforth reported that the gas permeability values may be one or two orders of magnitude higher and the largest difference would occur when testing using a partial vacuum. It is therefore important to consider the effect of slippage when interpreting results obtained from gas measurement as a means of assessing concrete quality.
It was found in Chapter 5 that Bamforth’s constants gave a lower bound for the water permeability. The results from this work are included in Fig. 7.6 and the line through the data has been derived from equations (7.10) and (7.11) and using
and
which may be seen to fit the data. For the results from Chapter 5 which are shown on the graph, the average gas pressure was 0.5 atm.
Figure 7.6 also shows a second line from the same equations using the same constants but with the average pressure at 0.01 atm (1 kPa) which is applicable to the work reported here. The graph shows the results for the different tests on liquid water plotted against the vapour permeabilities derived from mass loss and these may be seen to lie close to the line.
7.5 Conclusions
• A simple laboratory procedure in which mass loss is measured may be used to yield results for the permeability of concrete to water vapour which are consistent with the results from other tests.
• This work indicates that, when measurements are made on samples dried under vacuum, the depth of drying observed by breaking the samples open does not give the best results. The mass loss is far more reliable.
• Gas slippage theory must be used when calculating the intrinsic permeability from the transport of water vapour in concrete.
• These results therefore indicate that this method of analysis gives agreement between the permeability values calculated from observations from the different experiments and that they may be used to confirm the results from individual tests and identify testing methods that are giving inconsistent results.