
CHAPTER 3
Financial Ratios
For business leaders and decision makers, financial ratios are indicators of financial performance as well as part of a broader financial and economic framework. Utilizing financial ratios within that framework provides business leaders with a context for making well-informed decisions about their firm and the economy in general.
Financial ratios serve several purposes. They can be targets that can trigger an action, such as an investment decision, or act as measures of financial performance for a firm, industry, or country.
It is important to note that a financial ratio describes what happened but not why it happened. When looking at companies, an analyst compares financial ratios of one company to its competitors to understand the underlying causes of divergence between firms and the industry. The same can be true when a decision maker evaluates a country's financial position.
When using a financial ratio, an analyst should decipher the numerator and the denominator to assess what the ratio is attempting to measure and how to interpret the results. Financial ratios enable a decision maker to determine past performance, assess current performance, and gain insights regarding future success.
Generally speaking, calculating ratios can be the easy part of the task. The real challenge is extracting the underlying meaning of the ratios. An analyst must establish a methodology to assess the direction, stability, and outlook for the trend in the data that makes up the ratio. Typically, analysts follow a process that identifies (1) the trend in the ratio (Is the value of the ratio increasing or decreasing over time?), (2) the drivers of the ratio's trend (What is causing the numerator and the denominator of the ratio to behave as they do?), and (3) an outlook for the ratio's trend (What is the most probable direction for the ratio based on the underlying drivers?).
In this chapter, we examine several important ratios designed to help ascertain financial performance. But two concerns regarding financial ratios and their interaction with the broader economy must be kept in mind: the interaction of cyclical and long-term secular patterns and how changes in the broader economy impact a financial ratio.1
Financial ratios have a cyclical component that is tied to the business cycle as well as a secular component that reflects longer-term trends. When analyzing financial ratios, cyclical and secular trends need to be distinguished. A decision maker assesseses the ratio over a period of time to determine whether changes in it imply cyclical movement around a series that has no trend or cyclical movement around a changing trend.
Trends in financial ratios may also reflect changes in the broader economy. Every financial ratio is not an independent indicator of the economic or financial performance of a firm, industry, or country. Strong correlations can exist between financial ratios and basic economic indicators, such as gross domestic product (GDP) growth, inflation, and interest rates.2
Business leaders utilize financial ratios, including leverage, liquidity, market value, and profitability/operating efficiency, to monitor the operating performance of their firms. A change in the magnitude or direction of a financial ratio can signal a significant change in the firm's operating landscape.
As decision makers determine which tools to use and before they make a final assessment, they should understand how the current behavior of an economic series or financial ratio stands relative to its underlying behavior. The technique we utilize to review important financial ratios is the Hodrick-Prescott (HP) filter. This filter removes the cyclical movements from the long-term trend of a financial ratio. Once the HP filter is applied to an economic series or financial ratio, a decision maker can observe if that series is moving below or above trend at any point in time compared to its historical values. The HP filter thus removes the so-called recency bias.
With more clarity about how to approach and utilize financial ratios, we now turn to several routinely utilized ratios.
PROFITABILITY RATIOS
Profitability ratios are important tools for business risk analysis. They indicate the effectiveness of a firm's operating management and describe its ability to consistently generate cash to meet its financial obligations. In this section, we review several essential profitability ratios.
Return on Equity
When investors and economists analyze a company, they often ask: How efficiently is this firm using its assets? A firm's return on equity (ROE) is a key ratio to help determine this answer. ROE measures the return earned by a firm on its common and preferred equity capital. The company's return is measured as net income, or the difference between revenue and expenses. The ratio gauges how efficiently and profitably a business invests the shareholders' capital. The higher the ROE, the more efficient management is in utilizing shareholders' capital and the better the return to its investors.
As it is with many other types of ratios, it is important to evaluate any profitability ratio individually and as an industry group in order to gain a better understanding of what is driving a firm's success. In some cases, success can be found in its operating activities; in other cases, it can be discovered in its nonoperating activities. ROEs can vary significantly among different types of businesses. A firm's ROE should be evaluated and compared with companies in a similar line of business. For example, the semiconductor industry has exhibited a relatively high ROE; utilities, due in part to their capital-intensive nature, tend to have a relatively lower ROE.
In addition, a small equity capital base can mislead an analyst. A firm with a disproportionately large amount of debt in its capital structure could still produce a high ROE but with a modest equity base. ROE thus should not be viewed in isolation.
As seen in Figure 3.1, the ROE ratio has a cyclical pattern over time. During the dot-com boom of the 1990s and the housing-driven boom of the early to mid-2000s, the ROE of the Standard & Poor's 500 ran above its long-run trend growth rate. But as the ratio peaked just below the 3.00 level, the Great Recession of 2007 to 2009 unfolded, causing the ratio to drop dramatically as profitability fell. As of the second quarter of 2012, ROE has peaked at around 2.70 and has begun to moderate. This recent trend is in line with the softening in corporate profits over the past year as firms have found it more challenging to maintain high levels of profitability in a weak demand environment.

FIGURE 3.1 Return on Equity Ratio: HP Filter
Source: Factset
Return on Assets
A second measure of efficiency of corporate assets is the return on assets (ROA), which measures the return earned by a firm on its assets. The ROA ratio calculation is net income divided by a firm's average total assets, with net income measured as the return to stockholders, and assets can be financed by both debt and equity. The higher a firm's ROA, the more income that firm generates on a given level of assets.
Because interest expense, or the return to creditors, has already been deducted from net income, some analysts prefer to add it back into the calculation and use earnings before interest and taxes (EBIT). In this particular measure of ROA, returns are measured prior to deducting interest on debt capital and therefore reflect the return on all assets invested in the company, including both debt and equity. An analyst needs to be consistent with the specific form of ROA he or she is using when comparing companies, otherwise ratio results could be misleading.
As expected, the ROA ratio shows a similar result to the ROE ratio. Going back to 1994, ROA ran above its long-term trend during the boom times of the 1990s and 2000s (see Figure 3.2). The most recent peak in ROA occurs at around 1.15, before the Great Recession hit the U.S. economy. During the recession period of December 2007 through June 2009, the ROA ratio fell significantly below its long-run HP filtered trend.

FIGURE 3.2 Return on Assets Ratio: HP Filter
Source: Factset
Corporate Profits as a Percentage of GDP
Decision makers also need to analyze the profitability of the U.S. economy as a whole so they can assess how their company or industry is performing against this backdrop of the larger economy. One way to do this is to take the profits of all businesses and compare it to U.S. gross domestic product (GDP)—for example, calculate corporate profits as a percent of GDP. Figure 3.3 shows the cyclical trend of corporate profits throughout the various stages of the business cycle. During the recovery and early expansion phase of the business cycle, corporate profits as a percentage of GDP largely remained above trend. As the expansion phase of the business cycle lengthens, firms on average find it difficult to maintain their pace of profitability as productivity slows and cost structures rise.
Liquidity Ratios
Liquidity ratios, which focus on the firm's cash flow, measure a company's ability to meet its short-term financial obligations. A firm's liquidity measures how quickly its assets can be converted to cash. In day-to-day operations, liquidity management typically is achieved through efficient use of the firm's assets. Over a longer period of time, liquidity is addressed by managing the composite structure of liabilities.
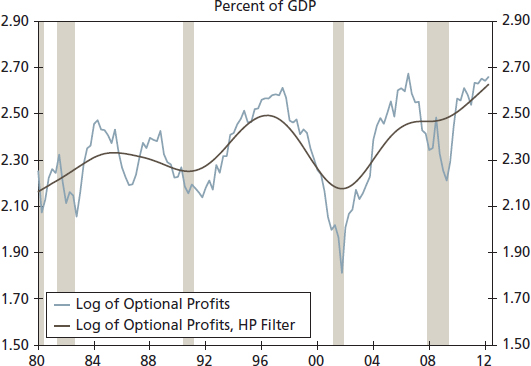
FIGURE 3.3 Corporate Profits: HP Filter
Source: U.S. Department of Commerce
A firm's level of liquidity can differ from one industry to the next as well as between firms within the same industry. Assessing whether a company has adequate liquidity requires analysis of its past funding requirements, current liquidity position, expected future funding needs, and all available options for attracting additional funds or reducing funding needs.
Typically, larger companies are in a better position to control the level and composition of their liabilities than smaller firms are. Larger firms thus usually have more available funding sources, including money markets and capital markets. This allows a firm to reduce the size of its liquidity buffer relative to businesses denied access to easily generated funds.
The data used to generate liquidity ratios is derived from a firm's balance sheet rather than from monthly or quarterly averages. There are three primary liquidity ratios: current, quick, and cash ratios. Each ratio reflects a firm's ability to pay current liabilities, and each progressively uses a stricter definition of what qualifies as a liquid asset. The higher the ratio, the larger the safety margin to repay short-term financial obligations. A company's liquidity also affects its capacity to take on additional debt.
The current ratio is a measure of a firm's current assets in relation to current liabilities. Current assets include cash, inventories, receivables, and short-term securities; current liabilities involve the ongoing interest expense of previous debt obligations as well as day-to-day operating expenses, such as electricity and water bills. Fundamental to the analysis, the current ratio implicitly assumes that a firm's account receivables and inventories are liquid. Depending on the stage of the business cycle, that assumption may not necessarily be true. A current ratio of 1.0 indicates that the book value of a business's current assets exactly matches the book value of its current liabilities. A higher ratio indicates a greater ability to meet short-term obligations; a lower ratio indicates less liquidity and therefore an increased reliance on a firm's operating cash flow and outside funding resources.
The quick ratio is a more conservative measure of liquidity than the current ratio. It includes a more strict definition of current assets, often referred to as quick assets. Like the current ratio, a higher quick ratio reflects greater liquidity within the firm. This stricter definition of assets reflects that, at certain points in time, inventory may not be converted as easily and quickly into cash as at other points in time. Moreover, it assumes a firm probably would not maximize the full carrying value of its inventory in periods of economic stress. When those periods occur, the quick ratio could be a better indicator of liquidity than the current ratio.
In extreme periods of economic stress, the cash ratio is the most reliable measure of a firm's liquidity. In this ratio, current assets include only highly marketable short-term investments, such as U.S. Treasuries and cash. Even in crisis times, however, the fair market value of marketable securities could decline significantly as a result of financial market forces and still not give decision makers a true picture of a firm's financial position.
As seen in Figure 3.4, over time, the current ratio has not strayed far above or below its HP filter trend unless the economy is in periods of great excess or great restraint. From 2001 through 2005, the current ratio grew in line with its long-run trend. The mid-2000s were a period of great excess because low interest rates helped fuel a boom led by residential housing, investment, and consumption. As the housing bubble burst in 2007–2008, the value of current assets fell at a faster rate than the value of current liabilities, leading to a significant pullback in the current ratio. When the economy bounced back in 2009 and firms rebuilt assets on their balance sheets, the current ratio rebounded sharply. After backsliding in 2011, the most recent data (as of mid-2012) suggests that firms have grown cautious primarily because of the so-called U.S. fiscal cliff. This situation involved President Barack Obama and Congress facing decisions regarding taxes, deficits, the national debt ceiling, and the sequester (impending across-the-board cuts to federal programs) without the ability to resolve these issues easily because of partisan gridlock. With uncertainty over how the fiscal cliff would be resolved, businesses, on balance, prepared for the worst. Not knowing whether they would be able to tap money or capital markets, firms topped off company coffers to sustain a period of financial market stress where financial options may be costly if not limited.
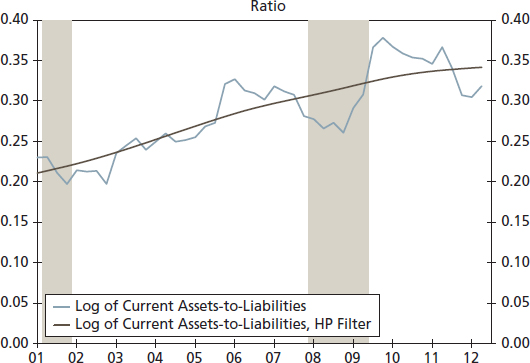
FIGURE 3.4 Current Assets to Liabilities: HP Filter
Source: Factset
Leverage Ratios
The third category of ratios useful to decision makers is leverage ratios, or solvency ratios. Solvency refers to a firm's ability to fulfill its debt obligations—its principal and interest payments—over the long term. Analysts want to understand a company's use of debt for several reasons. The amount of debt in a firm's capital structure is key to assessing the firm's risk and return characteristics, specifically its financial leverage. An analyst thus must perform an in-depth study on the components of the firm's capital structure. Leverage ratios provide an analyst with information regarding the relative amount of debt a firm has in its capital structure and the adequacy of its cash flow and earnings to cover interest and principal payments.
Leverage is the amplifying effect from the use of fixed costs. The first form of leverage is operating leverage, which is the use of fixed costs in conducting the firm's day-to-day business. The primary intent of operating leverage is to amplify the effect of changes in sales on operating income. When revenues increase, using operating leverage results in operating income increasing at a faster rate. Although variable costs will rise proportionately with revenue, fixed costs do not.
The second form of leverage is financial leverage. When a company finances itself using debt, that debt establishes financial leverage because the interest payments on the debt are basically fixed financing costs to the firm. Because a given percentage change in EBIT results in a larger percentage change in earnings before taxes, financial leverage tends to amplify the effect of changes in EBIT on stockholder returns. With the assumption that a firm can earn more on those funds than it can pay in interest, some level of debt in a firm's capital structure could lower its overall cost of capital and, in turn, increase the return to stockholders. On the flip side, a higher level of debt in the firm's capital structure increases the probability of default and results in higher borrowing costs for the company to compensate debt holders for assuming more credit risk.
In analyzing the data, the decision maker's goal is to better understand the levels and trends in a firm's use of financial leverage in relation to its past and its competitors, while recognizing the difference between operating and financial leverage. The greater a firm's operating leverage, the more a firm is at risk of having an insufficient income stream to cover debt payments. Therefore, operating leverage can limit a business's ability to use financial leverage.
There are two main types of leverage ratios: debt ratio and coverage ratio. Debt ratios focus on the balance sheet and measure the amount of debt capital relative to the amount of equity capital. Coverage ratios concentrate on the income statement, measuring a company's ability to cover its debt payments.
The debt-to-equity ratio measures the total amount of debt capital relative to the total amount of equity capital. Unlike profitability ratios, higher leverage ratios indicate weaker solvency and a greater propensity for firms to fall into financial trouble. Because corporate earnings fluctuate over the business cycle, higher levels of debt are associated with higher interest payments and therefore increased pressure on a given level of corporate earnings. As a decision maker analyzes the debt-to-equity ratio, he or she gains insight into the decisions made by company leadership on their capital structure.
As seen in Figure 3.5, a cyclical pattern in the debt-to-equity ratio has persisted over several business cycles. During the boom period of the 1990s, as stock valuations increased at a faster pace than the value of firms' debt, the debt-to-equity ratios fell precipitously. These low ratios gave business leaders the confidence to take on larger levels of debt. Business leaders often display a bias that recent success will continue without correction. Companies can get into trouble when changes in business fortunes occur, and earnings cannot accommodate higher interest payments.
As previously mentioned, analysts need to evaluate leverage ratios not only in comparison to a firm's history or to its competitors but also in a broad economic context. Generally speaking, companies with lower business risk and with operations that generate consistent cash flow streams can take on additional debt with a corresponding increase in credit risk. That appears to be what happened, on balance, as 2012 ended. Although firms have modestly increased debt burdens in recent quarters, they have taken advantage of the very low cost of borrowing. By retiring higher-interest-rate debt or bringing on additional capacity to finance acquisitions and future projects, companies have positioned their capital structures well in this uncertain economic environment.
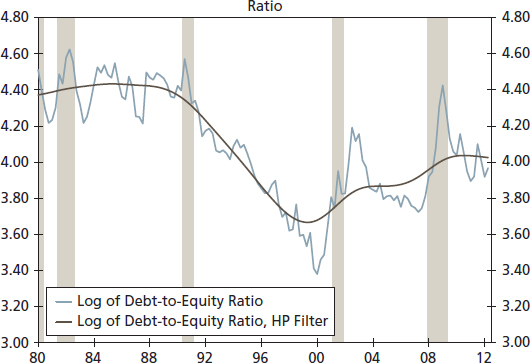
FIGURE 3.5 Debt-to-Equity Ratio: HP Filter
Source: Factset
Investment Valuation Ratio
Valuation ratios have long been used in the investment decision-making process. The most well-known and widely cited stock valuation indicator is the price-to-earnings (P/E) ratio. The P/E ratio is the ratio of the price per share of common stock to the earnings per share of common stock. Analysts frequently use this ratio as a quick proxy for investors' assessment of a particular company's ability to generate future cash flows. Explained differently, a P/E ratio tells how much in common stock an investor will pay for a dollar of future earnings. Firms that have a high P/E ratio tend to have strong earnings growth forecasts. On the flip side, businesses with a low P/E ratio are expected to have low future earnings growth potential.
The theory behind the P/E ratio is that the value of an asset is determined by the present value of the expected net earnings stream generated by the asset. The decision maker's expectations and the economic factors that shape those expectations are vital in making the assessment. When looking at the present value of the earnings stream, the outlook for inflation and interest rates are key and can have a substantial impact. In addition, the performance of the U.S. dollar exchange rate can play a pivotal role because so many companies, large and small, participate in international markets.
Market valuations are not set in an environment of certainty. The current P/E ratio indicates the prevailing sentiment of investors toward a firm's equity value. A decision maker must first decide if he or she agrees with the prevailing P/E ratio in comparision to the P/E ratio of the aggregate stock market, the firm's particular industry, and its specific competitors. Because each investor formulates his or her own expectations, a market is formed that allows buyers and sellers to trade, with each believing they have gotten a deal.

FIGURE 3.6 Price-to-Earnings Ratio: HP Filter
Source: Factset
Figure 3.6 shows the P/E ratio over the past decade; it has steadily shrunk. Why? In our opinion, increased economic uncertainty increasingly plagues today's operating landscape. From political dysfunction to extraordinary monetary policy to general business outlook concerns, the sustainability of earnings has been cast into serious doubt. As economic and profit forecasts become less reliable, analysts and investors tend to focus on broader economic themes instead of firm-specific valuation considerations.
The bottom line (or rule): The more uncertainty there is in the market, the lower the P/E ratio.
SUMMARY
Ratio analysis can be a key tool in determining the financial performance of a firm, industry, or country. With thoughtful selection, evaluation, and interpretation of financial and economic data, a decision maker can use financial analysis tools, such as financial ratios, to assist in investment and financial evaluation. A decision maker must be aware that financial ratios should not be taken at face value and should be analyzed in the context of the broader economic framework as well as firm-specific situations. With that in mind, financial ratio analysis will give the decision maker a more informed answer on financial performance—past, present, and future.