
CHAPTER THREE
Banks’ Financial Statements
CHAPTER STRUCTURE
Section II Financial Statements of Banks Operating in India
Section III Analyzing Banks’ Financial Statements
Annexures I, II, III, IV (Case Study), V
KEY TAKEAWAYS FROM THE CHAPTER
- Learn how banks’ financial statements are different.
- Understand the components of banks’ financial statements.
- Learn to analyse banks’ financial statements.
- Understand how inter-bank comparisons are carried out.
- Understand the KPIs for banks.
SECTION I
BASIC CONCEPTS
A bank’s financial statements are quite different from those of a firm in any other industry. A cursory analysis of the balance sheet and income statement of any bank would confirm this statement. In their roles as financial intermediaries, banks have to take considerable financial risks, and their financial statements merely reflect these risks.
Examine the latest financial statements of a commercial bank and compare the components with a manufacturing or a trading company. You will notice several interesting points of differences. For example, to understand and analyze a bank’s financial statements, you will have to first understand, why:
- The sources of funds are primarily short-term in nature, payable on demand or with short-term maturities. (Depositors can renegotiate the term deposit rates as market interest rates change.)
- The financial leverage is very high, in other words, the equity base is very low. (This is risky and can lead to earnings volatility.)
- The proportion of fixed assets is very low and, so is the operating leverage. (Operating leverage is the ratio of fixed costs to total costs. It can also be defined as the % change in operating income for a given % change in revenue.)
- A high proportion of bank funds are invested in loans and advances or investments, all of which are subject to interest rate volatility.
Furthermore, when deposit rates change, the cost of funds also changes, which in turn would impact the pricing of bank assets.
Thus, there seem to be considerable risks embedded in banking operations—high financial risk due to the high leverage, high interest rate risk, which would affect profitability, and high liquidity risk, which might endanger the solvency of the bank. In order to understand these risks, it is necessary to learn to read and analyze the financial statements of a bank. Let us, therefore, explore the nature of each item on the financial statement in some detail.1
Bank Liabilities
Sources of bank funds are classified according to the type of debt and equity components. The various debt instruments are differentiated on the basis of the maturity (interest rate), cheque writing and other facilities, the insurance they carry and their tradability in the markets. Till about a few decades back, the banking industry in many countries was highly regulated and did not exhibit much discretion in fixing interest rates. The industry has been deregulated progressively and banks can now compete globally by quoting viable interest rates on almost all their liabilities. It is now common for large banks to tap global markets for long-term debt and debentures.
The following constitute the major part of a bank’s liability accounts, which represent sources of funds for the bank. In addition, in most major economies, various forms of regulation and legislation protect these accounts.
Net Worth The net worth of a bank is measured by the aggregate of its share capital, reserves and surplus. In any enterprise, capital is required to absorb unexpected losses. A bank typically sustains losses when the value of its assets is eroded—leading to fall in profitability due to loss of income. The loss in liquidity when the value of assets is eroded may even threaten the very existence of the bank.
Deposits The primary source of borrowed funds for a typical bank is ‘deposits’—predominantly raised from the public. We will see in subsequent chapters the rationale and implications of banks garnering household, corporate and government savings in order to channelize them to deficit sectors in the economy, thus, leading to capital formation.
Deposits are grouped for transaction as well as balance sheet purposes based on purpose and maturity. They are broadly classified as deposits payable on demand and deposits payable after a specified period. Deposits payable on demand are generally called, ‘transaction deposits’ and in India, they take on the nomenclature of ‘savings’ and ‘current’ deposits. In some countries, such as the United States, such demand deposits are also called ‘checking accounts’ since these accounts can be transacted through cheques. Deposits payable after a specified time period are called ‘term deposits’.
Borrowings Banks can borrow from the markets, both domestic and overseas, other institutions and banks, and from the central bank. Such borrowings, typically contribute a lower proportion to the banks’ total sources of funds. Generally, borrowings are used to shore up the liquidity position or create specific assets.
TEASE THE CONCEPT
How are the debt instruments for a bank are different from the debt instruments available to a manufacturing or trading firm?
Bank Assets
As financial intermediaries, banks typically trade in credit, thus, leading to economic growth. The funds mobilized from various sectors in the economy are deployed into productive sectors of the economy. The credit, thus, deployed forms the most important asset on banks’ balance sheets. Banks also aid economic growth by investing in securities issued through the financial markets and government. ‘Investments’, therefore, form another major asset on banks’ balance sheets.
Cash holding by banks would comprise cash in the banks’ vault and deposits with the country’s central banks used to meet regulatory requirements, clearing house requirements and other uses. In spite of the importance of mitigating liquidity risk, banks prefer not to hold significant amounts of cash due to the possible loss of profitability.
Therefore, though cash does not form a significant proportion of banks’ balance sheets, the importance of liquidity for banks cannot be underestimated.
TEASE THE CONCEPT
Is the cash holding of a bank really a liquid asset?
Investments Investment securities help banks in several ways. They help to meet liquidity needs, earn interest, take advantage of interest rate movements and are a part of the banks’ treasury functions. At the time of investment, banks must be able to decide on the objective of buying the designated securities—whether the securities are to be held to maturity or are meant for short-term investments under the ‘held for trading’ or ‘available for sale’ categories.
Investment securities’ attractiveness stems from the risk-return trade-off—good securities with low default risks are available at relatively low transaction and administrative costs, yielding good returns. Liquidity risks can be offset by investing in short-term securities, ranging from overnight to 1 year, which can be sold at a price very close to the acquisition cost. For the additional liquidity, banks are willing to sacrifice higher returns that are possible in long-term investment securities.
Treasury income could be one of the major sources of income for banks if they adopt prudent investment policies.
Loans and Advances This category of assets is the most important for banks because it defines their roles as financial intermediaries and impacts their profitability to a large extent. These assets also carry a high level of default risk and each asset or class of assets exhibits unique characteristics that render generalizations and monitoring difficult. For example, banks negotiate loans with borrowers whose businesses are widely different, and the loan terms for whom vary on all respects—amount, price, source of repayment, use of loan amount or type of collateral. Maturities could range from a few days (loans repayable on demand) to long-term loans (loans for real estate or infrastructure) ranging from 10–15 years. The price of the loans, or interest rates, may be fixed for the loan tenure, or may be floating—varying as market rates change. Repayment terms could be different for different loans—paid in equal installments, or principal and interest paid separately, or paid at the end of the loan period in one lump sum.
TEASE THE CONCEPT
Are loans and advances liquid assets?
Fixed Assets In sharp contrast to other industrial and service sectors, banks own relatively few fixed assets. Compared to non-financial firms, banks operate with lower fixed costs and exhibit lower operating leverage.
Contingent Liabilities
A contingent liability is an off-balance sheet item. How is it different from a liability on the balance sheet?
A liability arises out of a present obligation as a result of past events. Further, settlement of a liability is expected to result in an outflow of resources, by way of payments to creditors.
A contingent liability, on the other hand, is a possible obligation, which could arise depending on whether some uncertain future event occurs. It could also arise where there is a present obligation, but payment is not probable or the amount cannot be measured reliably.
In the case of banks, contingent liabilities can generate substantial income in good times. A major contributor to contingent liabilities is the non-funded business that banks take on, such as issue of letters of credit, opening letters of guarantee and derivatives dealing.
The major risk in contingent liabilities is the counter party default risk. In the event of the counter party failing to honour his commitment, the liability will crystallize into a fund-based liability for the bank. Relatively higher fees for these services offset the higher risk.
Though not forming part of the balance sheet, the contingent liabilities of banks will have to be examined thoroughly to identify potential risks to the bank’s profitability and sustainability.
The Income Statement
The income statements of banks clearly reflect the financial nature of the banking business. The bulk of revenue is generated from interest on advances and investments. However, an analysis of the trend in income generation by banks shows a gradual upward shift in the proportion of non-interest income, reflecting the gravitation of modern banking business towards fee-based services.
The income statement starts with interest income from advances and investments (comparable to the ‘revenues’ figure in a non-financial firm). Interest payments on deposits and borrowings (comparable to ‘direct costs’ of a non-financial firm) are deducted from interest income to arrive at net interest income (NII). The NII is an important measure of profitability for banks and is used for calculating the ‘spread’. The NII can be likened to ‘gross profit’ or ‘contribution’ in a non-financial firm.
It is desirable that the NII be substantial enough to generate a surplus after overhead expenses and taxes. The other major source of income—non-interest or fee-based income—is set off against non-interest expenses, which represent overhead costs. Typically, the non-interest income would be less than the overhead costs, leading to a net negative figure that is known as the ‘burden’. From the burden, provisions for loan and other losses are deducted. These provisions are estimates made by the bank management about the likelihood of default in loan repayments or investment losses. The resultant figure would be the operating income of the bank. Where applicable, profit or loss from sale of long-term securities or assets is set off against the operating income to arrive at the net operating income before taxes. Net income or profit after taxes is arrived after deducting taxes and other adjustments, if any. Therefore, conceptually, a bank’s net income is dependent on the following variables:
- NII
- Burden (non-interest income, LESS overhead expenses)2
- Provisions for loan losses and market risk
- Profit or loss from sale of securities and/or assets
- Taxes
Presented differently, the sources of a bank’s income are interest earned from advances and investments, fee-based or non-interest income and profit from sale of long-term securities and other assets. The expenses of a bank comprise interest paid on deposits and borrowings, overhead expenses, provisions for loan losses and market risk and loss on sale of long-term securities and other assets.
A bank’s efficiency ratio is defined as the ratio of overhead expenses to the total of NII and non-interest income. The burden and efficiency ratio indicate how well the bank controls its overhead expenses.
TEASE THE CONCEPT
Should the efficiency ratio be low or high to increase bank’s profitability?
Other Income As pointed out earlier, banks are increasing their earnings through fee-based services, such as fund transfers and remittances, custodial services, collections, government business, agency business, opening letters of credit, issuing letters of guarantee and dealing in derivative markets.
Interest Expended This represents variable cost for the bank. However, due to the variety of borrowed sources of funds in terms of tenure, price and covenants, keeping this cost in check is a challenge for banks. Banks typically operate on narrow spreads, and any increase in interest expended is bound to erode profits, unless matched by commensurate growth in income generated by assets.
SECTION II
FINANCIAL STATEMENTS OF BANKS OPERATING IN INDIA
Comparing financial statements of banks operating in India will reveal that all of them are almost identically structured. This is because the banks in India have to prepare their financial statements in accordance with the third schedule of Section 29 of the Banking Regulation Act. A typical bank’s balance sheet has 12 schedules, with Schedules 13–16 being allocated to the income statement (Tables 3.1 and 3.2). Accordingly, a uniform pattern of financial statement presentation and disclosures is followed.
TABLE 3.1 A TYPICAL BANK’S BALANCE SHEET—INDIA
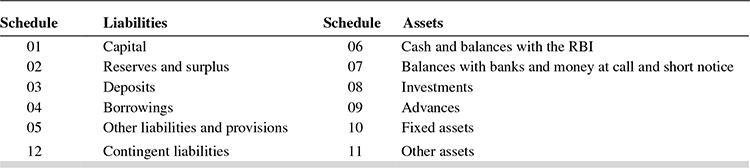
TABLE 3.2 INCOME STATEMENT

Schedules 17 and 18 typically relate to Notes to Accounts or provisions and contingencies and Significant Accounting Policies. The RBI requires other mandatory disclosures as well.
Bank Liabilities
Capital Banks have to show the authorized, subscribed and paid-up capital under this head.
The current guidelines permits business/industrial houses to promote banks, conversion of NBFCs into banks and setting up of new banks in the private sector by entities in the public sector, through a Non-Operative Financial Holding Company (NOHFC) structure. The minimum capital requirement for setting up a bank is Rs 500 crore. Thereafter, the bank should maintain minimum capital of Rs 500 crore at all times. Detailed guidelines and instructions can be accessed at the RBI website.
RBI data show that Government of India continued to maintain more than the statutory minimum shareholding of 51 per cent in all Public Sector Banks (PSBs). The maximum non-resident shareholding during the year among PSBs was 11.9 per cent as against 72.7 per cent in the case of Private Banks. The regulatory maximum of non resident shareholding in PSBs and private banks are 20% and 74% respectively. The government has allowed PSBs to raise capital from markets through the Follow-on Public Offer (FPO) or Qualified Institutional Placement (QIP) by diluting the government’s holding up to 52 per cent in a phased manner.
Reserves and Surplus Typically, Indian banks have to include the following components under this head.
Statutory reserves: Under Section 17(1) of the Banking Regulation Act, 1949, every banking company incorporated in India shall create a reserve fund out of the balance of profit each year as disclosed in the profit and loss account. Such transfer to the reserve fund will be before any dividend is declared, the amount being equivalent to not less than 20 per cent of the profit.3
Capital reserves: Excess depreciation on investments, or profit on sale of permanent investments or assets, are some of the surpluses that will be carried to the capital reserve account. This reserve will not include any amount that can be freely distributed through the profit and loss account.
Share premium: This will include any premium on the issue of share capital by the bank.
Revenue and other reserves: This will comprise all other reserves not included above. Excess provision on depreciation on investments will have to be appropriated to the ‘Investment Reserve’ account.4
Balance in profit and loss account: This contains the balance of profit after appropriations.
Deposits The balance sheet of a bank operating in India will show the following classifications.
Demand deposits: These would include balances in ‘current’ accounts and term deposits, which have fallen due for payment but not paid to the depositor. The bank will pay no interest on these balances. Current deposits are typically used as operating accounts for business transactions.
Savings deposits: These deposits are meant primarily to tap household savings. Hence, most of the depositors operating such accounts, in which balances are payable on demand, would be individuals. Trusts are also permitted to open and operate savings accounts. However, the RBI prohibits certain incorporated bodies from operating savings accounts.
Term deposits: Banks accept deposits with maturity periods ranging from 15 days to 10 years. The upper limit of 10 years can be relaxed in special cases such as disputed deposits or where minors are involved. Term deposits typically take the form of Fixed Deposits (FD), Recurring Deposits (RD), Reinvestment Deposits (RDP), Cash Certificates, Certificates of Deposits (CD), deposits under various schemes conceived and marketed by individual banks or deposits mobilized from Non-Resident Indians, under the nomenclatures such as NRE, NRO and FCNR deposits.
The types of deposits described above (except savings deposits) will be bifurcated into those from banks and from others. Deposits from banks are retained for various purposes and include deposits from the entire Indian banking system as well as co-operative banks and foreign banks, which may or may not operate in the country.
Internationally active banks in India will also present the deposit balances segregated into deposits collected by domestic branches and those raised by overseas branches.
Borrowings In its balance sheet, a bank operating in India would show ‘borrowings’ under two categories—borrowings in India and ‘borrowings outside India’.
Borrowings in India would include ‘refinance’ from the RBI or other apex institutions, such as NABARD, SIDBI and other such refinancing agencies, against advances already disbursed. Borrowings from the money market–including the call money market–and other long-term markets would be reflected under borrowings from other banks or institutions, depending on the source of such borrowings.
Other Liabilities and Provisions These categories of liabilities are typically grouped as follows.
Bills payable: These constitute the floating liabilities of banks arising out of fee-based services rendered by banks for funds transfer, such as demand drafts, bankers’ cheques and travellers’ cheques.
Inter-office adjustments: The net credit balance will be included under ‘liabilities’.
Interest accrued: Interest accrued on deposits and borrowings, which are due for payment, would be included in the balances outstanding under deposits or borrowings. Interest accrued but not due for payment will get reflected under this head.
Others: Importantly, this head would reflect the provisions made for income tax, bad debts and depreciation in securities. Other liabilities that cannot be grouped under any other head, such as unclaimed dividends, provisions or funds earmarked for specific purposes, and unexpired discount are also classified under this head.
Some banks include ‘proposed dividend’ as a separate category under ‘other liabilities’.
Bank Assets
The following broad categories of assets are typically detailed in Indian banks’ balance sheets:
- Cash and balances with the RBI
- Balances with banks and money at call and short notice
- Investments
- Advances
- Fixed assets
- Other assets
Cash and Balances with the RBI All cash assets of the bank are listed under this head, and this would be the most liquid part of the balance sheet.
Cash is held to meet deposit withdrawals, day-to-day expenses and credit drawal demands.
- ‘Cash’ includes cash in hand and cash in the vault, including foreign currency notes and cash balances at overseas branches of the bank.
- ‘Balances with the RBI’ are held to meet the statutory ‘cash reserve requirements’ (CRR) forming part of the fractional reserve-banking concept. The RBI has also permitted the operation of ‘currency chests’ at select banks. The currency chest is maintained at the premises of the approved banks, but the cash balances in the currency chest are reckoned as tantamount to balances kept with the RBI, as also meeting the statutory requirements.
Balances with Banks and Money at Call and Short Notice Under this head, banks separately disclose the balances they hold with other banks in various deposit accounts, in and outside India. These balances are held for various purposes, including settlements under clearing house operations, and include all balances with banks, including co-operative banks. However, domestic branches holding balances with the foreign branches of the same bank will be regarded as ‘inter-branch balances’ and not reckoned for inclusion under this head.
All lending to the inter-bank call money market is shown under the head ‘money at call and short notice’. Loans made outside India, classified as ‘call loans’ in those markets are also included under this head. These short-term assets serve as ‘near-cash’ and form an additional line of defence against liquidity risks along with the CRR and statutory liquidity reserves (SLR).
Investments In times of soft interest rates, investments yield substantial incomes to banks.
To minimize the risks of indiscriminate investments by Indian banks, the RBI has drawn up a set of guidelines under which banks’ investments in India will be slotted into six baskets depending on the nature of the security. These are as follows:
- Government securities
- Approved securities
- Shares
- Debentures and bonds
- Subsidiaries and/or joint ventures
- Other investments
Banks can also invest in overseas markets, where the categories would include foreign government securities, subsidiaries and/or joint ventures and other investments.
The SLR requirements would form part of the investment portfolio of the bank, which is intended to be, along with the CRR, part of the reserves serving as a hedge against liquidity risk.
Further, as a hedge against interest rate risks in the market, the RBI guidelines specify that all approved investments should be categorized into ‘permanent’ and ‘current’ investments, in a flexible proportion.
Under the current category, securities will be periodically marked to market. While appreciation in value is ignored, any depreciation is provided for.
Loans and Advances Indian banks classify their loan assets in three ways—by nature of credit facility granted, by security arrangements and by sector. The numerical total of ‘advances’ under all three categories is the same, since the same data has been presented in three different ways.
Presentation format I: By nature of credit facility
- Bills purchased and discounted: This head depicts the outstanding under this type of advance irrespective of the type of bills—clean/documentary/supply/foreign/domestic.
- Cash credits, overdrafts and loans repayable on demand: As the nomenclature suggests, these are loans to be repaid on demand irrespective of whether a due date is mentioned or not. Both financing and cash credit bills are essentially short-term advances.
- Term loans: All outstanding balances of loans granted for a specific period usually for more than 12 months are shown under this head. These loans are repayable only on due dates, not on demand.
Presentation format II: By security arrangements
- Secured by tangible assets, both prime and collateral.
- Covered by bank/government guarantee: Balances under advances within India and granted abroad, covered by guarantees of Indian or foreign governments or by agencies such as Export Credit Guarantee Corporation of India, are included under this head.
- Unsecured advances: These are not covered by tangible securities or government/institutional guarantees, or do not fall under the above-mentioned categories.
Presentation format III: By sector
- Priority sectors: These represent advances to sectors classified as such by the RBI. Most of these sectors, under the prevailing guidelines, have specific norms for directed lending.
- Public sector advances: These are loans/advances made to central and state government, and other government undertakings. However, any advance made to a public sector unit, eligible to be classified as priority sector, would be included under priority sector advances.
- Banks: These include all advances made to the banking sector and to the co-operative banks.
- Others: These constitute the advances made to the corporate sector and all other residual advances.
The total outstanding advances presented in the balance sheet represent ‘Net bank credit’. ‘Gross bank credit’ is arrived at by adding the figure of bills rediscounted by bank with SIDBI or IDBI.5
Fixed Assets Indian banks classify ‘fixed assets’ on their balance sheets into the following categories:
- Premises (including land)
- Other fixed assets (including furniture and fixtures)
- Assets on lease
Costs of the assets are adjusted for additions, deletions or write offs during the year, and the net block after depreciation is presented in the balance sheet.
Other Assets These are residual assets of relatively small magnitude.
In Indian banks’ balance sheets, they take the following forms (only major heads listed):
- Interest accrued: This consists of interest accrued, but not due on investments and advances, and interest accrued, but not collected on investments. Even under advances, only interest accrued on bills purchased or discounted will be included under this head. This is because interest on loans, cash credits or overdrafts gets debited to the respective accounts and is shown as outstanding advances in the balance sheet. Hence, the major component under this head would be interest accrued on investments.
- Inter-office adjustments: The debit balance, if any, in the inter-office accounts, will appear here. As a measure of prudence, the RBI has advised banks to make 100 per cent provision for the net debit position in interbranch accounts, arising out of unreconciled entries.
- Advance tax paid/tax deducted at source
- Stationery and stamps
- Non-banking assets acquired in satisfaction of claims: Immovable property or tangible assets acquired by the bank in satisfaction of its claim on others are listed under this head.
- Others: These may contain the accumulated losses. Hence, while analyzing banks’ financial statements, it would be prudent to scan this head to detect any erosion of net worth.
Contingent Liabilities Generally, contingent liabilities are shown under the following broad heads.
- Claims against the bank not acknowledged as debts.
- Liability for partly paid investments.
- Liability on account of outstanding forward exchange contracts.
- Guarantees given on behalf of outside constituents—in India and outside India (data to be furnished separately).
- Acceptances, endorsements and other obligations.
- Currency swaps.
- Interest rate swaps, currency options and interest rate futures.
- Other items for which the bank is contingently liable.
As stated already, contingent liabilities are non-fund-based and can become fund-based if the liability crystallizes and, therefore, carry inherent risks. (These risks are discussed in the appropriate context in subsequent chapters and briefly described in Annexure IV to this chapter.)
Income Statement of Indian Banks
Income
Interest earned Interest earned is categorized as follows:
- Interest/discount on advances/bills: Banks charge interest on almost all types of advances. However, they discount certain types of bills, implying that the bank charges are taken upfront. Both categories of income are included under this head.
- Income from investments: The dividend and interest income earned from the bank’s investment portfolio are included under this head.
- Interest on balances with the RBI and other inter-bank funds: Interest earned from sources, such as balances kept with the RBI deposits with other banks, and call loans, are included under this head.
- Others: All other types of interest/discount income that do not fall in any of the above categories will find a place under this head.
Other income The head ‘other income’ contains the following classifications:
- Commission, exchange and brokerage: All the types of fee-based income described above fall under this category.
- Profit/loss on sale of investments: The net position of gains or losses from sale of securities (held to maturity) is shown under this head.
- Profit/loss on revaluation of investments: The net position on revaluation of investments is shown here. Any loss will be shown as a deduction.
- Profit/loss on sale of building and other assets: The net position of gains or losses from sale of fixed assets including gold and silver will be shown under this head.
- Profit on exchange transactions: All income earned through foreign exchange dealings, except the interest earned, will be shown under this head. The income recorded here will be after setting off losses on exchange transactions.
- Income earned by way of dividends: These will be applicable to dividends earned from subsidiaries, joint ventures or companies in which the bank has invested.
- Miscellaneous income: All residual income arising out of miscellaneous sources, such as income from bankowned property, security charges and recoveries of godown rents will be shown under this head. However, if any type of income exceeds 1 per cent of the bank’s total income, details of such income have to be disclosed in the form of notes.
Expenses
Interest expended: The income statement lists three categories of interest expenses, based on the source of liabilities.
- Interest on deposits: This head will include interest paid on all types of deposits raised from the public, other banks and institutions.
- Interest on RBI/inter-bank borrowings: This head includes interest/discount on borrowings/refinance from other banks/RBI.
- Other interest: This would include interest on subordinated debt or borrowings/refinance from other financial institutions.
Operating expenses: These expenses are typically the overheads and other expenses necessary for a bank to function. They are categorized as follows:
- Payments to and provisions for employees
- Rent, taxes and lighting
- Printing and stationery
- Advertisement and publicity
- Depreciation on bank’s property
- Directors’ fees, allowances and expenses
- Auditors’ fees and expenses
- Law charges
- Postage, telephone, etc.
- Repairs and maintenance
- Insurance
- Other expenses: If any one category exceeds 1 per cent of total expenses, details of the expenses will have to be provided separately.
Provisions and contingencies: Provisions made for loan losses, taxes and diminution in the value of investments will be included under this head.
Other Disclosures to be Made by Banks in India
In India, of late, there has been a notable shift towards more transparency and disclosures in the financial statements of banks.
Banks are required to disclose additional information as part of annual financial statements as specified in RBI instructions, revised periodically.
At a minimum, the items listed in RBI directives should be disclosed in the ‘Notes to Accounts’. Banks are also encouraged to make more comprehensive disclosures than the minimum required if they become significant and aid in the understanding of the financial position and performance of the bank. The disclosures listed by RBI are intended only to supplement, and not to replace, other disclosure requirements under relevant legislation or accounting and financial reporting standards. Where relevant, banks should also comply with such other disclosure requirements as applicable.
The set of comprehensive disclosure requirements, is intended to allow the market participants to assess key information on capital adequacy, risk exposures, risk assessment processes and key business parameters, to provide a consistent and understandable disclosure framework that enhances comparability.
Under ‘significant accounting policies’, banks are required to provide information on the basis of accounting expenses and incomes, investments, foreign exchange transactions, advances, fixed assets and net profit.
Banks are also required to present cash flow statements, accounts of subsidiaries and consolidated financial statements. In addition, some private sector banks also present their accounts under the US generally accepted accounting principles (US GAAP).
Under Section 31 of the Banking Regulation Act, 1949, banks are required to submit their financial statements along with the auditor’s report to the RBI.
SECTION III
ANALYZING BANKS’ FINANCIAL STATEMENTS
How do we compare banks? Which is the larger bank—the one whose average assets are larger than other banks or the one whose total income (interest plus non-interest income) is the highest?
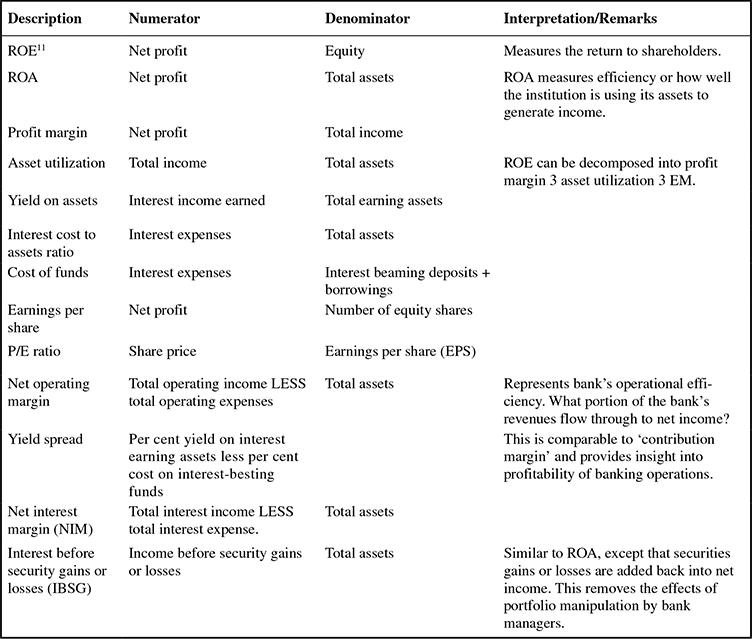
The answer depends on what metrics we use to measure size. Traditional models of bank performance are based on the return on assets (ROA) approach. Some others such as CAMELS rating models (see Annexure I ) follow a rating approach based on various parameters. Annexure II provides an illustrative list of key performance indicators (KPIs) that would enable to evaluate bank performance on various parameters. There are also more sophisticated models based on risk rating criteria (see Annexure III ).
In this section, we will present a basic framework that will help analyse an individual bank’s financial health, as well as compare performance across banks. This framework is based on the DuPont System of Financial Analysis and adaptations made by David Cole in 1972.6
This simple procedure helps evaluate the source and magnitude of bank profits in relation to the selected risks of banking business.
Timothy Koch and S. Macdonald7 have used the Cole model to perform an analysis of the return on equity (ROE). Since a bank’s market performance and sustainability are paramount in the long term, the model starts with ROE as the aggregate profit measure and decomposes it progressively into its component ratios to determine the strengths of an individual bank’s performance, or compare its performance with other banks.
IMPORTANT NOTE
Step 1 ROE 5 Net income/average total equity = NI/E
NI/E can be rewritten as
(Net income/Average total assets) × (Average total assets/Average total equity), i.e., ROA × EM
What is the significance of the equity multiplier (EM)? See Box 3.1.
BOX 3.1 SIGNIFICANCE OF THE EM
Consider two banks, both with ₹100 crore in asset values and identical asset qualities but with different liability compositions. Bank X has a liability composition with ₹90 crore in debt and ₹10 crore in equity. Bank Y has a liability composition of ₹95 crore in debt and ₹5 crore in equity.
The EMs of the two banks are as follows:
Bank X: 100 ÷ 10 = 10
Bank Y: 100 ÷ 5 = 20
CASE 1
Assume that both banks have an ROA of 1
Then the ROE of the two banks would be
Bank X: 1 × 10 = 10
Bank Y: 1 × 20 = 20
This implies that, in spite of identical asset values and quality, Bank Y is able to earn a better ROE, simply because of a higher EM.
CASE 2
Assume both banks have a negative ROA = −1
The ROE of the two banks would now be
Bank X: −1 × 10 = −10
Bank Y: −1 × 20 = −20
We now notice that the decrease in Bank Y’s profits is more than that of Bank X’s profits—despite the asset values and quality still being identical—because of the higher EM of Bank Y.
What, then, is the nature of the EM? It is a measure of the bank’s financial leverage—a higher financial leverage works to the firm’s advantage by boosting the ROE when earnings are positive. However, leverage is a double-edged sword—when the firm records negative earnings, the fall in ROE is greater.
TEASE THE CONCEPT
What does the inverse of the EM represent and measure?
Step 2 Net income (NI) = Total revenue (R) − Total expenses (E) − Taxes (T)
Here, R represents interest plus non-interest income plus profit on sale of investments and E represents interest expenses, overhead expenses and provisions.
The effect of dividing both sides of the above equation by total average assets (TA) is to ‘decompose’ ROA:
In other words,
This implies that maximizing asset utilization and minimizing the expense ratio and taxes can maximize ROA.
Step 3 Revenue (R) can be further decomposed into
R = Interest Income (II) + Non-interest income (OI) ± Net profit/loss on sale of securities (PS).
Dividing throughout by average total assets (TA), as in Step 2
In other words,
Asset utilization = Yield on assets + Non-interest income rate + Profit rate on sale of securities
Step 4 Similarly, Expenses (E) can also be further decomposed.
Again dividing throughout by average total assets
Here, IE/TA represents cost of funds for the bank and OH/TA represents the overhead expense rate. The provision rate signifies, to a large extent, the asset quality for the bank. The lower these ratios, the better will be the profitability of the bank.
Box 3.2 outlines some common strategies to control non-interest (overhead) expenses of banks.
BOX 3.2 SOME COMMON STRATEGIES TO CONTROL BANKS’ NON-INTEREST EXPENSES
- Identify redundant expenses and eliminate them.
- Change product or service pricing to increase volumes or increase revenues at the existing volume.
- Study workflow processes and increase operating efficiency by maintaining current level of products and services at reduced costs or maintain the current costs but increase the level of products and services.
- Increase non-interest income so that they exceed non-interest expenses.
In this manner, every aspect of the bank’s operations can be examined for analysis and decision-making.
To sum up,
ROE = ROA × EM
ROE = (Asset utilization − Expense ratio − Taxes) × EM
Stated differently,
where the profit margin can reflect
- expense control,
- tax management,
- effectiveness of pricing strategies and
- effectiveness of marketing.
And asset utilization is affected by
- mix of loans,
- investments and
- liquidity.
The EM is a measure of capital structure.
Where banks have high proportion of non-interest income, the bank’s operating performance will have to be viewed differently.
For example, the following ratio is used by analysts to assess a banks’ operating performance. The lower this ratio, the better is the perception of the bank’s performance.
(Non-interest expenses or overheads – Non-interest income)/Net interest margin
Annexure IV to this chapter provides a case study of Du Pont analysis of profitability of banks in India, while Annexure V outlines the changes in Accounting Standards for banking operations.
CHAPTER SUMMARY
- A bank’s financial statements are quite different from those of a firm in any other industry. In their roles as financial intermediaries, banks have to take considerable financial risks, and their financial statements merely reflect these risks.
- A few striking characteristics of the financial structure of banks would be revealed from an analysis of any bank’s financial statements.
- The sources of funds are primarily short-term in nature, payable on demand or with short-term maturities. Depositors can renegotiate the term deposit rates as market interest rates change.
- The financial leverage is very high, in other words, the equity base is very low. This is risky and can lead to earnings volatility.
- The proportion of fixed assets is very low.
- A high proportion of bank funds is invested in loans and advances or investments, all of which are subject to interest rate volatility.
- Besides, when deposit rates change, the consequent impact on the cost of funds could create problems with the pricing or portfolio of assets.
- Operating leverage is relatively low due to the comparatively lower fixed costs.
- Each of the above characteristics gives rise to significant risks in bank management. The income statement of banks clearly reflects the financial nature of banking business. The bulk of revenue is generated from interest on advances and investments. However, an analysis of the trend in income generation by banks shows a gradual upward shift in the proportion of the non-interest income, reflecting the gravitation of modern banking business towards fee-based services.
- Conceptually, a bank’s net income is dependent on the following variables:
- NII
- Burden (non-interest income LESS overhead expenses)
- Provisions for loan losses and market risk
- Profit or loss from sale of securities and/or assets
- Taxes
- Banks operating in India exhibit almost identically structured financial statements. This is because banks in India will have to prepare their financial statements in accordance with the third schedule of Section 29 of the Banking Regulation Act. A typical bank’s Balance Sheet has 12 schedules, with Schedules 13–16 being allocated to the Income Statement. Accordingly, a uniform pattern of financial statement presentation and disclosures is followed.
- Traditional models of bank performance are based on the ROA approach. Some others such as CAMELS rating models follow a rating approach based on various parameters. There are also more sophisticated models based on risk rating criteria.
TEST YOUR UNDERSTANDING
- Rapid fire questions
Answer ‘True’ or ‘False”
- Commercial banks typically have low financial leverage and high operating leverage.
- The proportion of fixed assets on a typical bank’s balance sheet is low.
- A bank’s financial leverage is shown by its Equity ratio.
- A contingent liability arises from a present obligation of a bank.
- Fee based services of banks is usually shown under “other income” on the Income statement.
- A bank’s “burden” is the difference between the interest earned and interest paid.
- Banks in India have to present their financial statements in a uniform format.
- Disclosures in financial statements are left to the discretion of banks in India.
- If “money at call and short notice” is shown on the assets side of a bank’s balance sheet, it means the bank has borrowed in the call money market.
- Banks’ commitments to perform a promise would be shown as liabilities on banks’ balance sheets.
Check your score in Rapid fire questions
- Fill in the blanks with appropriate words and expressions
- The sources of funds for banks are primarily —————, ————— and —————.
- The major portion of a bank’s assets consist of ————— and —————.
- Banks typically have high ————— leverage due to a high ————— multiplier.
- Banks’ investments in government securities are classified as ————— on their balance sheet.
- The securities purchased by banks to fulfil their SLR requirements would be shown under the ————— head on banks’ balance sheets.
- Banks’ total revenue comprises of ————— income and ————— income.
- A bank’s yield on assets is calculated as ————— divided by —————.
- The spread percentage is calculated as ————— less—————.
- A bank’s cost of funds is calculated as ————— divided by —————.
- The net interest margin is calculated as ————— divided by —————.
- Expand the following abbreviations in the context of the Indian financial system
- NIM
- NII
- EM
- ROE
- ROA
- Test your concepts and application
- Which of the following is NOT an asset on a bank’s balance sheet?
- Cash in hand and balances with banks
- Reserves
- Loans and advances
- Investments
- Which of these is found in a bank’s income statement?
- Cash in hand and balances with banks
- Provisions for loan losses
- Deposits
- Borrowings
- Net interest income is:
- Interest on loans and advances minus other income
- Interest on loans and advances plus interest on investments minus interest on deposits and borrowings
- Average interest rate earned on loans and investments less average interest paid on deposits and borrowings
- Interest on loans and advances plus interest on investment minus other income minus taxes
- When we use ratios to analyze bank performance, we should:
- Use KPIs pertaining to a single year
- Compare year-end figures of both income statement and balance sheet
- Compare average figures of both income statement and balance sheet
- Compare year-end figures of income statement and average figures from the balance sheet
- A bank’s equity multiplier reflects:
- Financial risk
- Management control of expenses
- Liquidity risk
- Operating leverage
- A bank’s ROE has been falling over the last three years. On decomposition of the ROE, it is found that the ROA is increasing, and the equity multiplier is decreasing. This implies that:
- Investors should not invest in the bank
- The bank is earning less per Re of assets
- The bank is lowering its financial risk
- The bank is increasing its risk
- When a bank increases its outside liabilities, other things remaining constant, the bank’s equity multiplier will:
- Increase
- Decrease
- There will be no change in the equity multiplier
- A bank holds 60% of its assets as liquid securities. This implies that:
- The bank’s cost of funds is high
- The bank’s cost of funds is low
- The bank’s yield on assets is low
- The bank’s yield on assets is high
- The bank will have high profits
- In the case of a typical bank, which balance sheet accounts would be affected by the following transactions? You have to indicate at least two accounts for each transaction.
- A opens a deposit account with ₹1 lakh. The funds are loaned in the call money market for a week.
- Bank B contracts the services of its investment-banking arm for its initial public offer of shares to the market. The bank plans to use these funds to make loans to long-term infrastructure projects.
- Just as C, a residential complex promoter, pays off his loan taken from the bank for construction, D, an engineer with a multinational company, takes a home loan.
- Bank E raises ₹10 lakh in the call money market to grant a 3-month overdraft to its valuable customer, F.
- Arrange the following information on Bank X into its income statement. Label and place each item in the appropriate category, in the appropriate order, and compute the bank’s net income (₹ in lakh).
- For the above bank, average balance sheet figures (average of previous year’s and current year’s balances) are given below (₹ in lakh).
- Decompose the bank’s ROE and analyze the bank’s profitability.
- Compute a few key performance ratios and interpret them, assuming that the ratios you compute are indicative of the past trend.
Capital 57,787 Cash and balances with the RBI 3,88,636 Reserves and surplus 2,23,658 Balances with banks and money at a call and short notice 9,28,488 Deposits 59,06,953 Investments 21,44,546 Borrowings 1,46,625 Advances 27,83,177 Other liabilities and provisions 3,08,882 Fixed assets 64,965 Total liabilities 66,43,905 Other assets 3,34,093 Total liabilities 66,43,905 - Is there a liquidity risk for a bank in the following circumstances? Indicate ‘YES’ or ‘NO’ and substantiate your answer.
- A bank’s ‘core deposits’ form 20 per cent of its total assets.
- About 85 per cent of the bank’s investments are to be held till maturity.
- A bank’s demand deposits form 80 per cent of its total deposits.
- More than 60 per cent of the bank’s advances will be repaid over the next 7 years.
- Sixty per cent of the bank’s advances are short-term advances given for speculation in shares.
- Loans for purchase of cars form 70 per cent of the bank’s advances portfolio. All of them will be repaid within 2 years.
- Which of the following is NOT an asset on a bank’s balance sheet?
TOPICS FOR FURTHER DISCUSSION
- Compare the financial statements of (1) a private sector bank, (2) a nationalized bank and (3) a foreign bank.
- What are the differences, if any, in presentation of the financial statements?
- Analyze the profitability ratios. Do you see any striking differences in the way each of these banks do business? Why do you think such differences exist?
- Analyze the asset—liability composition of these banks. Do you see any striking differences in the composition of assets and liabilities in each bank category? Why do you think such differences exist?
- Compare the financial statements of (a) a large and (b) a small private or public sector bank. Compute the KPIs and interpret them. Do you see any size-related differences in the KPIs?
- What financial ratios best capture each of the aspects of the CAMELS ratings?
- What do you notice about the contingent liabilities in each bank? Do these contingent liabilities pose any risk to these banks?
ANNEXURE I
MOVING TOWARDS RISK BASED ASSESSMENT OF BANKS
Regulators, analysts and investors have to periodically assess the financial condition of each bank. Banks are rated on various parameters, based on financial and non-financial performance. One of the popularly used assessments goes by the acronym CAMELS, where each letter refers to a specific category of performance.
C—Capital adequacy: This indicates the bank’s capacity to maintain capital commensurate with the nature and extent of all types of risks, as also the ability of the bank’s managers to identify, measure, monitor and control these risks.
A—Asset quality: This measure reflects the magnitude of credit risk prevailing in the bank due to its composition and quality of loans, advances, investments and off-balance sheet activities.
M—Management quality: Signalling the ability of the board of directors and senior managers to identify, measure, monitor and control risks associated with banking, this qualitative measure uses risk management policies and processes as indicators of sound management.
E—Earnings: This indicator not only shows the amount of and the trend in earnings but also analyses the robustness of expected earnings growth in future.
L—Liquidity: This measure takes into account the adequacy of the bank’s current and potential sources of liquidity, including the strength of its funds management practices.
S—Sensitivity to market risk: This is a recent addition to the ratings parameters and reflects the degree to which changes in interest rates, exchange rates, commodity prices and equity prices can affect earnings and, hence, the bank’s capital.
The components of the CAMELS rating system comprise of both objective and subjective parameters. Some illustrative components are as follows:
- Capital adequacy
- Size of the bank
- Volume of inferior quality assets
- Bank’s growth experience, plans and prospects
- Quality of capital
- Retained earnings
- Access to capital markets
- Non-ledger assets and sound values not shown on books (real property at nominal values, charge-offs with firm recovery values and tax adjustments)
- Asset quality
- Volume of classifications
- Special mention loans—ratios and trends
- Level, trend and comparison of non-accrual and renegotiated loans
- Volume of concentrations
- Volume and character of insider transactions
- Management factors
- Technical competence, leadership of middle and senior management
- Compliance with banking laws and regulations
- Adequacy and compliance with internal policies
- Tendencies towards self-dealing
- Ability to plan and respond to changing circumstances
- Demonstrated willingness to serve the legitimate credit needs of the community
- Adequacy of directors
- Existence and adequacy of qualified staff and programmes
- Earnings
- ROA compared to peer group averages and bank’s own trends
- Material components and income and expenses—compare to peers and bank’s own trends
- Adequacy of provisions for loan losses
- Quality of earnings
- Dividend payout ratio in relation to the adequacy of bank capital
- Liquidity
- Adequacy of liquidity sources compared to present and future needs
- Availability of assets readily convertible to cash without undue loss
- Access to money markets
- Level of diversification of funding sources (on- and off-balance sheet)
- Degree of reliance on short-term volatile sources of funds
- Trend and stability of deposits
- Ability to securitize and sell certain pools of assets
- Management competence to identify, measure, monitor and control liquidity position
- Sensitivity to market risk
- Sensitivity of the financial institution’s net earnings or the economic value of its capital to changes in interest rates under various scenarios and stress environments
- Volume, composition and volatility of any foreign exchange or other trading positions taken by the financial institution
- Actual or potential volatility of earnings or capital because of any changes in market valuation of trading portfolios or financial instruments
- Ability of management to identify, measure, monitor and control interest rate risk as well as price and foreign exchange risk wherever applicable and material to an institution
Internationally, and in India, these ratings are used by regulators to determine the supervision policies for individual banks. Ratings are assigned for each component in addition to the overall rating of a bank’s financial condition. The ratings are assigned on a scale from 1 to 5. Banks with ratings of 1 or 2 are considered to present few, if any, supervisory concerns, while banks with ratings of 3, 4 or 5 present moderate to extreme degrees of supervisory concern.
The rating analysis and interpretation are typically done along the following lines.
| Rating Analysis | Rating Analysis Interpretation |
|---|---|
| 1.0–1.4 | Strong: Sound in every respect, no supervisory responses required. |
| 1.6–2.4 | Satisfactory: Fundamentally sound with modest correctable weakness. |
| 2.6–3.4 | Fair (watch category): Combination of weaknesses if not redressed will become severe. Watch category—requires more than normal supervision. |
| 3.6–4.4 | Marginal (some risk of failure): Immoderate weakness unless properly addressed could impair future viability of the bank. Needs close supervision. |
| 4.6–5.0 | Unsatisfactory (high degree of failure evident): High risk of failure in the near term. Under constant supervision/cease and desist order. |
CAMELS Ratings Applied to Banks in India
The main instrument of supervision in India is the periodical on-site inspection of banks supplemented by off-site monitoring and surveillance. Since 1995, on-site inspections are based on the CAMELS8 model and aim at achieving the following objectives:
- Evaluation of bank’s safety and soundness
- Appraisal of the quality of board and top management
- Ensuring compliance with prudential regulations
- Identifying the areas where corrective action is required to strengthen the bank
- Appraisal of soundness of bank’s assets
- Analysis of key financial factors, such as capital, earnings, and liquidity and bank’s solvency
- Assessment of the quality of its management team and evaluation of the bank’s policies, systems of management, internal operations and control
- Review of compliance with banking laws and regulations as well as supervisory guidance conveyed on specific policies
Financial performance parameters have typically been developed along the dimensions of this framework. These are typically used for peer comparison and benchmarking, regulatory reporting and shareholder reporting purposes. Some banks have also linked these parameters to the individual performance review process and compensation of its employees. However, these financial measures are primarily lag indicators, a post-mortem view of the business, rather than lead indicators that assess the bank’s ability to create value in the future.
Domestic banks are rated on the CAMELS model while foreign banks are rated on the CACS model (capital adequacy, assets quality, compliance and systems). The frequency of inspections is generally annual, which can be increased/decreased depending on the financial position, methods of operation and compliance record of the bank.
| Weights of Various Parameters Under the CAMELS/CALCS Model | ||
|---|---|---|
| CAMELS | CALCS | |
| Capital Adequacy | 18 | 18 |
| Asset Quality | 18 | 18 |
| Management | 18 | – |
| Earnings | 10 | – |
| Liquidity | 18 | 18 |
| Compliance | – | 26 |
| System and Control | 18 | 20 |
The risk profile of each bank draws upon a wide range of sources of information, besides the CAMELS rating, such as off-site surveillance and monitoring (OSMOS) data, market intelligence reports, ad-hoc data from external and internal auditors, information from other domestic and overseas supervisors, on-site findings and sanctions applied. The data inputs are assessed for their significance and quality before being fed into the risk profile. All outliers, i.e., banks, which fall outside the normal distribution based on characteristics, such as profitability, new business activity and balance sheet growth are identified and investigated on a regular basis. The risk profile is constantly updated.
The key components of the risk profile document are
- CAMELS rating with trends
- Narrative description of key risk features captured under each CAMELS component
- Summary of key business risks including volatility of trends in key business risk factors
- Monitorable action plan and bank’s progress to date
- Strength, weaknesses, opportunities, threats (SWOT) analysis
- Sensitivity analysis
In December 2009, a Working Group on OSMOS, redevelopment, reviewed the OSMOS structure and suggested XBRL (Extensible Business Reporting Language) adoption for the returns.
The CAMELS rating system and other supervision processes, according to the RBI, were not adequately risk focussed or forward-looking to the required extent. In the context of the risks that have emerged after the global financial crisis of 2008, the need for a revamped supervisory rating system was felt. A high level steering committee submitted its report in June 2012 after a review of the supervisory processes in commercial banks.
Accordingly, the RBI proposes to replace CAMELS with INROADS (Indian Risk-Oriented and Dynamic Rating System) from the next round of Annual Financial Inspection (AFI), in 2013. The following table shows the likely changes in banking supervision.
The Changing Landscape of Banking Supervision
- CAMELS rating system to be phased out, as it lacks forward-looking assessment and merely represents banks’ performance.
- New system, INROADS, to capture the risks that may cause a bank to fail.
- The AFI report to be fast-tracked.
- Single-point contact at the RBI to bridge regulatory gap.
- Information-sharing agreements with overseas regulators on cards.
The proposed supervisory process would be as follows:

The RBI report points out that the present rating does not capture the risks that could cause a bank to fail. The committee had identified the risk groups that could determine the risk of unexpected losses in a bank, as:
- Credit risk,
- Market risk,
- Operational risk,
- Liquidity risk, and
- Pillar 2 risk (Supervisory risk).
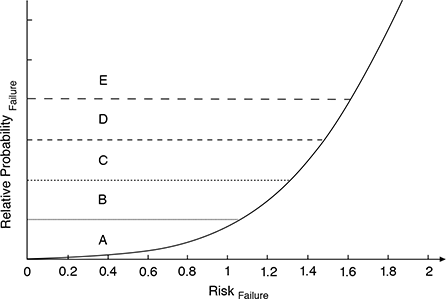
Based on the above, a ‘probability of failure’ for the bank would be arrived at. Based on a relative and approximate probability of failure vis-à-vis the risk of failure, the supervisory ratings would be allotted as follows:
The RBI proposes to enter into mutual regulatory cooperation agreements with regulators of other countries to gather information about Indian banks operating overseas. The RBI has already signed agreements with about 15 countries. The central bank is also planning to create a single-point contact for each bank. RBI Annual report of 2015–16 has recorded successful migration of the off-site monitoring and surveillance system (OSMOS) returns to the extensible business reporting language (XBRL) platform. Banks also started reporting through the automated data flow (ADF) process.
SELECT REFERENCES
- Federal Reserve documents for CAMELS ratings.
- RBI, ‘Seven Years of OSMOS—Looking Back and Way Forward.’ RBI Bulletin, 16 December 2002, Department of Banking Supervision, RBI Central Office, Mumbai.
- Sahajwala, Ranjana and Paul Van den Bergh, ‘Supervisory Risk Assessment and Early Warning Systems.’ Basel Committee on Banking Supervision Working Paper No. 4 (2000), Bank for International Settlements, Basel, Switzerland.
ANNEXURE II
KEY PERFORMANCE INDICATORS (KPI) FOR BANKS
Important Note for Calculating and Interpreting KPIs
KPIs given below are essentially financial ratios. For meaningful interpretation of these ratios, they must be calculated in a consistent manner, and compared with past trends or benchmarked with industry peers. The magnitude of the ratio depends on the value of the numerator and denominator, and if either of them is not correctly represented, the interpretation could be misleading.
While calculating ratios the following aspects should be considered:
- Are we comparing a balance sheet figure with an income statement figure? The balance sheet figure is a ‘stock’ figure and the income statement figure is a ‘flow’ figure and to make them comparable, the balance sheet figure should be taken as an average figure. The average can be computed as the average of year-end figures or quarterly figures if available.
- A single ratio cannot be interpreted meaningfully. Trends in ratios should be traced and interpreted. What has caused the changes in the ratio? Is it the numerator or the denominator? What are the implications of these changes?
- If only a single ratio is available, then benchmarking against industry average, or peer comparison would yield meaningful insights. Choosing the peer group for comparison should be done carefully.
- Accounting figures may camouflage details, and computing ratios mechanically might not lead to proper interpretation. Notes to accounts would provide more detailed information on the financial statement figures and would help in improved understanding of the implications of the ratios.
External factors that affect the performance of financial institutions include:
- Technology changes
- Competition
- Regulation
- Government policies (fiscal and monetary policy)
Bank management cannot control these factors. The best they can do is to try to anticipate future changes and position the institution to best take advantage of these changes.
Managers of banks, can however, control many internal factors. The KPIs will, therefore, focus on these controllable factors, some of which are
- Operating efficiency
- Expense control
- Tax management
- Liquidity
- Risk
It is important to note that while calculating ratios, all balance sheet figures should be averaged.
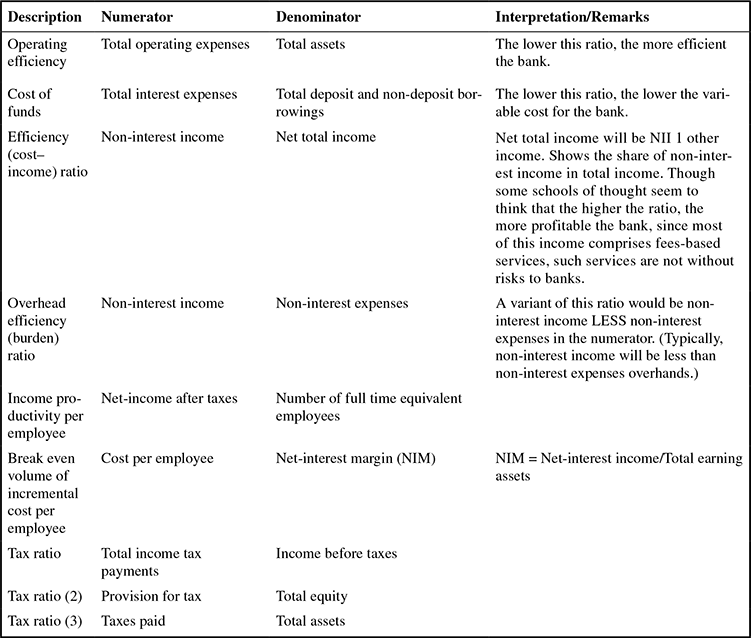
Efficiency and Expense Control Ratios
These ratios describe how well the financial institution controls expenses relative to producing revenues and how productive employees are in terms of generating income, managing assets and handling accounts.
Liquidity
It is mandatory that banks meet investors’ demands for liquidity. However, there is a trade-off since more liquid assets generally yield lower returns.
The following ratios describe the institutions’ liquidity position.

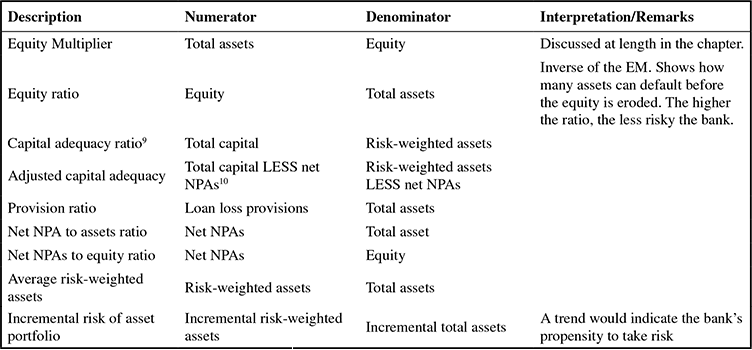
Risk
Financial institutions face many risks including losses on loans and losses on investments. Financial institution managers must limit these risks in order to avoid failure of the institution (bankruptcy).
The following ratios provide some information concerning the risk of the institution.
Profitability
Breaking down ROE as shown in Section III can help us determine problem areas for the bank.
Valuation of a Bank—Some Pointers
- The Price to Book Value (P/BV) multiple is frequently used to value banks. The rationale is that the growth in business value of a bank is closely related to its BV, unlike in other businesses. There are two reasons for this:
- The bank uses leverage to boost its return to equity holders, and the ratio reflects the capital it has for future growth. The ratio also reflects the flexibility offered by its regulatory ratios.
- The net worth of the bank is comprised of relatively liquid assets, since the bank has to hold more liquidity to carry on business. In cases of bank mergers that generate intangible value, analysts use P/TBV multiples, TBV denoting the ‘Tangible Book Value’ of the bank.
- The Dividend Discount model is also used prevalently to value banks. In this model, a bank’s expected dividend flows in future are discounted by its cost of equity. Alternatively, a constant growth model could be assumed. In both cases, the implicit assumption is that the credit quality of the bank’s assets would not fluctuate, even in a downturn.
SELECT REFERENCES
ANNEXURE III
SOME ALTERNATIVE MODELS FOR BANK FINANCIAL STATEMENT ANALYSIS
Measures Based on Total Operating Revenue
In using ‘total assets’ as the denominator for calculating performance measures, as we have done in Section III, we have ignored the fact that off-balance sheet items—contingent liabilities—have the potential of turning into unsolicited ‘assets’ for banks. Further, they also have the potential to generate substantial income for banks (classified as ‘noninterest income’). To circumvent this ‘omission’, it has been suggested12 that performance measures may be calculated using ‘total operating revenue’ as the denominator rather than ‘total assets’. Here, ‘total operating revenue’ represents both interest and non-interest income. However, non-recurring revenues, such as securities gains or losses, are to be excluded in computing total operating revenue.
Stock Market-Based Performance Measures
Investors are less concerned about historical ratios such as ROE or ROA, since these indictors do not convey the extent of cash flows to investors in the form of dividends and stock market prices. Thus, over the period in question, investors can assess how profitable their investment in the bank was through this simple ratio.
Market return to stockholders = {[P(t) − P(t − l)] + D}/P(t − l)
where
P(t) is the stock price at the end of the period,
P(t − l) is the stock price at the beginning of the period, and
D is the cash dividend paid plus reinvestment income during the period.
Other common ratios used by investors and analysis are:
- EPS = Net income after taxes/No. of outstanding shares
- Price to earnings (P/E ratio) = Stock price/EPS
- Price to book value = Stock price/Book value per share
- Market value of equity (MVE) = Market value of assets LESS market value of liabilities, or stock price × number of outstanding shares
Customer-Centric Performance Measures
Looking beyond financial measures, banks use indicators such as market share, customer profitability, customer retention, customer satisfaction, as well as internal productivity indicators, such as business per employee and employee satisfaction. Many banks also measure profitability in terms of business segments (e.g., corporate, retail), customer segments (small and medium enterprise, personal segments, corporate and institutional borrowers) by types of depositors or by delivery system (ATMs, branch, Internet banking).
Profitability by Line of Business
∎ RAROC/RORAC analysis
RAROC refers to risk-adjusted return on capital and is represented as (Risk-Adjusted Income/Capital).
RORAC refers to return on risk-adjusted capital and is calculated as (Income/Risk-Adjusted Capital).
Though the above are the theoretical definitions, these terms are often used interchangeably.
‘Risk-adjusted income’ implies that net revenues have been arrived at after deducting expenses and expected losses. Some banks also deduct a ‘capital charge’ from the return to assess the ‘economic capital’.
‘Risk-adjusted capital’ represents capital necessary to compensate earnings volatility.
∎ Internal funds transfer pricing
Funds transfer pricing (FTP) is a management control technique used to calculate the true NII component of profitability of business units, products, portfolios and customers. FTP helps build the income statement for each of these items by calculating the cost of funding assets and the credit for funds provided in the form of deposits.
Conceptually, funds-generating businesses are seen as originating funds to be sold in an internal capital market to funds-using businesses. The ‘transfer price’ used to value these transferred funds is the rate at which the bank can buy or sell funds in the external capital market. For a bank branch or profit centre, which is using up funds for its business, the balance sheet would consist of the loans generated on the ‘asset’ side, and funds ‘purchased’ from the transfer funds ‘pool’ on the ‘liability’ side. Similarly, a funds-generating unit would show funds ‘sold’ to the transfer pool as its asset, while ‘deposits’ would form the liabilities. In this case, the NII of the unit would be the ‘spread’ between the transfer pool rate received on funds sold to the pool, and the rates paid on deposits. Thus, the transfer price has helped bifurcate the overall NII of the bank into two segments—one from asset origination and the other from liability origination.
Although many banks had been using a ‘pooled funds approach’ to assign interest rates, most banks now use a ‘matched maturity approach’.13
A ‘Risk Index’-Based Approach
We have seen that the ROA is one of the most widely accepted measures of overall bank performance. However, the ROA is not a static measure—it varies with credit risk, interest rate risk, liquidity risk and other risks14 inherent in banking business. The variability (or volatility) in the ROA is typically measured by the standard deviation—either over time for an individual bank or across various banks at any point in time. A combination of the three important factors—ROA, EM (both of which determine the ROE, as described in Section III of this chapter) and the standard deviation of the ROA (the risk measure)—is called the ‘Risk Index’ (RI). This measure was proposed by Hannan and Hanweck 15 in their 1988 paper, and expresses the RI as:
RI = (Expected value of ROA + Capital to assets ratio)/ Standard deviation (σ) of ROA
Note that the capital to asset ratio is the inverse of the EM described in Section III, and is a measure of book value solvency of a bank. RI, therefore, can be interpreted as a measure of the extent to which a bank’s accounting earnings can fall till its book value turns negative.
It follows that higher values of RI indicate lower risk of insolvency—implying a higher level of book value of equity — relative to the potential shocks to the earnings of a bank. Thus, banks with risky asset portfolios can remain solvent as long as they are well capitalized.
In their quoted paper, Hannan and Hanweck also derive a probability of book value insolvency (PI) expressed in terms of the RI as:
However, the above measure is different from the measures of market value solvency.
The RI measure derives its appeal from the use of ROA, the most widely accepted and understood accounting measure of banks’ overall performance, the standard deviation of ROA, which is an accepted measure of risk, and book ‘capital adequacy’ that approximates a banks’ solvency.
Banking Stability Map (RBI)
The Banking Stability Map and Indicator (BSI) present an overall assessment of changes in underlying conditions and risk factors that have a bearing on stability of the banking sector during a period. The following ratios are used for construction of each composite index:
| Indicators Used for Construction of Banking Stability Map and Banking Stability Indicator | ||||
|---|---|---|---|---|
| Dimension | Ratios | |||
| Soundness | CRAR | Tier-I Capital to Tier-II Capital | Leverage ratio as Total Assets to Capital and Reserves | |
| Asset-Quality | Net NPAs to Total Advances | Gross NPAs to Total Advances | Sub-Standard Advances to gross NPAs | Restructured Standard-Advances to Standard Advances |
| Profitability | Return on Assets | Net Interest Margin | Growth in Profit | |
| Liquidity | Liquid Assets to Total Assets | Customer Deposits to Total Assets | Non-Bank-Advances to Customer Deposits | Deposits maturing within 1-year to Total Deposits |
| Efficiency | Cost to Income | Business (Credit+Deposits) to staff expenses | Staff Expenses to Total Expenses | |
In March 2017, Bank for International Settlements has added more disclosures and performance indicators for banks. These disclosures and KPIs can be accessed at http://www.bis.org/bcbs/publ/d400.pdf, under the paper titled “Pillar 3 disclosure requirements: consolidated and enhanced framework”.
SELECT REFERENCES
- Koch, Timothy and Scott S. MacDonald, Bank Management, Chapter 4 (4th edn. The Dryden Press, 2000), USA.
- Rao, Jammi and Kalpana Prabhu, ‘RAROC—A Performance Measurement Tool. ’ (2001), available at http://www.iciciresearchcentre.org.
ANNEXURE IV
CASE STUDY: ANALYSIS OF PROFITABILITY— A DU PONT ANALYSIS OF BANK GROUPS IN INDIA16
With the advent of complex financial products, banks’ business has expanded in recent years beyond the traditional financial intermediation process. Also, off-balance sheet exposure of banks has witnessed a significant increase in recent years.
In recent years, significant variation in profitability has been observed among bank groups. It was observed that, generally profitability of foreign banks was higher than that of other bank groups. Some past studies on profitability of Indian banks concluded that higher profitability of foreign banks could be attributed to their access to low cost CASA deposits, diversification of income as well as higher ’other income‘. During 2011–12, foreign banks accounted for close to 12 per cent of the total net profit of SCBs. As against this, their share in total assets of Indian banking sector stood at 7 per cent (see Figures 3.1 and 3.2).
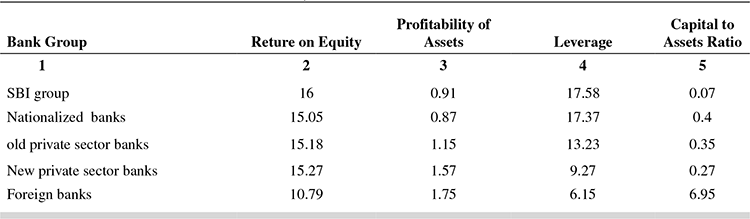
In order to understand the sources of profitability across bank groups, RoE analysis and Du Pont analysis have been carried out taking the bank group-wise data for 2011–12. The RoE analysis decomposes the profitability of banks into two components, i.e., profitability of bank assets, as captured by RoA and leverage, captured by the ratio of total average assets to total average equity.
Table 3.3 shows that the higher RoE for SBI group and the nationalized banks was associated with higher leverage, while for new private sector banks, the higher ROE was attributable to higher return on assets and relatively lower lever-age. Among the bank groups, foreign banks had the highest return on assets combined with the lowest leverage ratio.
FIGURE 3.1 NET PROFIT AS PERCENTAGE OF AVERAGE TOTAL ASSETS
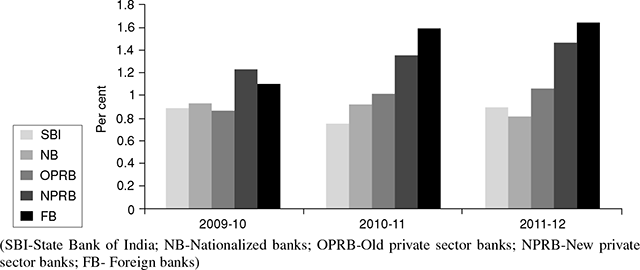
FIGURE 3.2 PROFITABILITY OF BANK GROUPS AND THEIR SHARE IN TOTAL ASSETS, 2011–12
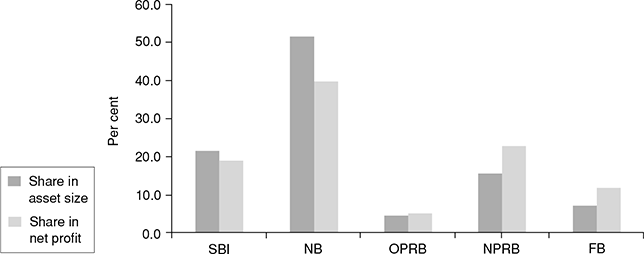
TABLE 3.3 ROE ANALYSIS—BANK GROUPS, 2011–12
However, on the whole, return on assets of the Indian Banking system is lower compared to the banking system in select countries among the emerging economies, but is well ahead of the advanced economies. Table 3.4 shows the comparison.
The Figure 3.3 shows the leverage ratios in advanced economies and emerging economies. The Indian banks have relatively lower leverage compared to the banking systems of both advanced and emerging economies.
The capital to assets ratio further corroborates the findings of RoE analysis. At end of March 2012, this ratio was highest for foreign banks in India, indicating their better capital position vis-à-vis other bank groups.
Du Pont analysis further decomposes profitability of banks into two components, viz., asset utilization and cost management. Better profit of banks can be attributed to better asset utilization or better cost management or both simultaneously. According to the Du Pont analysis results summarized in Table 3.5, foreign banks showed the highest RoA in 2011–12 among bank groups, mainly on account of better asset utilization, though their operating expenses to assets ratio (indicator of cost management) was also higher when compared to other bank groups. This result corroborates the findings of past studies according to which foreign banks’ higher profitability could be attributed to better fund management practices.
The operating efficiency of Indian banks improved during 2011–12, as measured by the Cost to Income ratio (operating expenses/total income). However, Net Interest Margin (NIM) also an efficiency indicator, dipped during the year. Figure 3.4 shows the results.
The Net Interest Margin (NIM)—An Important Indicator of Banking Efficiency and Profitability The NIM, operating expenses and ‘other income’ are crucial in determining profitability of banks. The NIM indicates the margin taken by the banking sector while carrying on banking business. In India, during the last one decade, the NIM was in the range 2.5–3.1 per cent. The NIM, which witnessed a declining trend during the period 2004–10, improved during 2010–11. The NIM of the Indian banking sector continues to be higher than some of the emerging market economies of the world. The NIM can be decomposed into
- The NIM from core banking business, (i.e., calculated as the difference between interest income from loans and advances minus interest expenses on deposits as a per cent of average total assets), and
TABLE 3.4 RETURN ON ASSETS OF BANKS IN SELECT COUNTRIES (%)

FIGURE 3.3 LEVERAGE IN THE BANKING SYSTEM—SELECT ECONOMIES
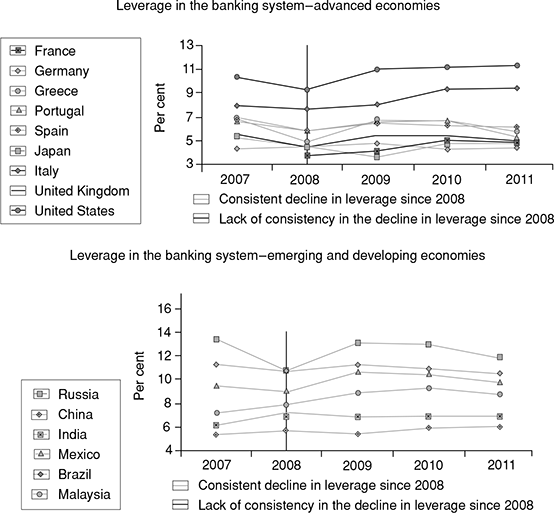
TABLE 3.5 ROA ANALYSIS—ASSET UTILIZATION AND COST MANAGEMENT BANK GROUPS IN INDIA, 2011–12
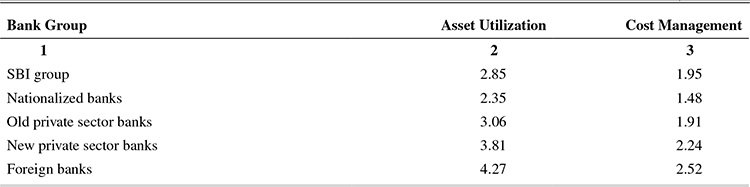
- b. The NIM from others (i.e., mainly the difference between all other interest income and interest expenses divided by average total assets).
The NIM from core banking business in India witnessed substantial increase during the last decade. In contrast, the NIM from others witnessed a decline, leaving the total NIM more or less stable during the same period. The increase in the NIM from core banking business, though a profitability indicator for banks, can also be interpreted to imply that the cost of financial intermediation increased in the economy during the last decade (see Chart A in Figure 3.5).
Therefore, it is important to increase ‘other income’ and reduce operating expenses as ratio of assets in the interest of profitability. The operating expenses to total average assets witnessed a declining trend during the last one decade mainly owing to the cost effective technological advancements. However, ‘other income’ to total average assets also witnessed a declining trend during the last one decade. Thus, it may be important for the Indian banking sector to improve ‘other income’. (see Chart B in Figure 3.5)
FIGURE 3.4 TREND IN EFFICIENCY INDICATORS—BANKS IN INDIA
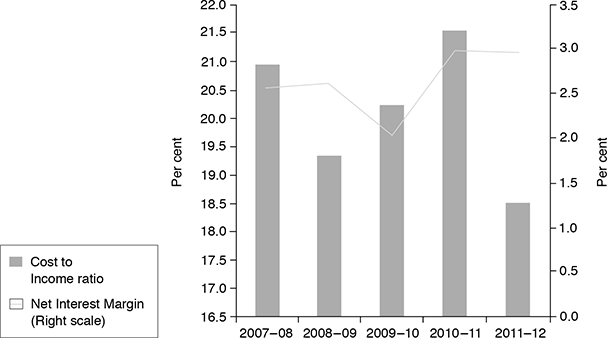
FIGURE 3.5 TRENDS IN THE NIM, OPERATING EXPENSES AND OTHER INCOME—BANKS IN INDIA, 2002–2011
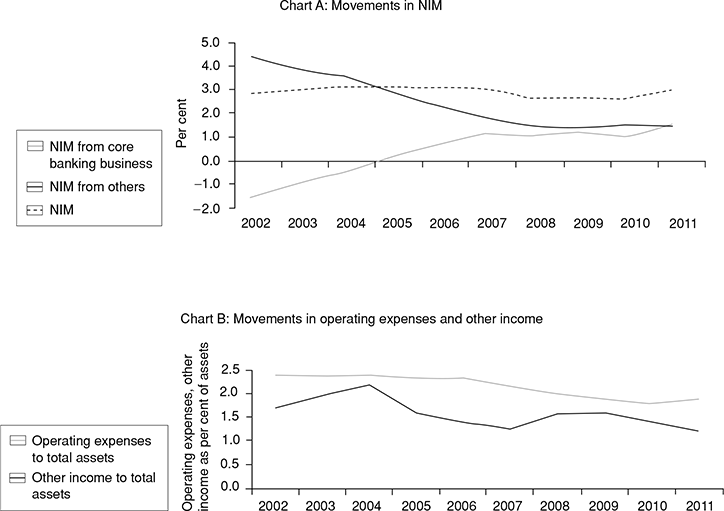
However, spreads (difference between yields on advances and investments and cost of funds) narrowed during 2011–12 due to higher increase in cost of funds as compared with the increase in yields on advances and investments. Among bank groups in India, foreign banks showed lower cost of funds due to the high proportion of Current Account Savings Account (CASA) deposits held by them. Figure 3.6 shows the trends in growth of cost of funds and yields.
FIGURE 3.6 TRENDS IN COST OF FUNDS AND YIELDS—BANK GROUPS IN INDIA, 2011–12

Off Balance Sheet (OBS) Exposures—Contingent Liabilities of Banks in India: Earlier, we have seen the important role ‘other income’ plays in bank profitability. One of the main sources of other income is OBS.
The financial crisis of 2007–08 has brought into focus the role of contingent liabilities of banks in both banks’ profitability as well as risks. Figure 3.7 shows the growth in contingent liabilities of banks in India and their relative size to banks’ total balance sheet size.
Contingent liabilities are usually viewed with concern as their exact impact on the soundness of the banking system can not be accurately determined. In the event of default, an OBS exposure can extensively damage financial stability. This was demonstrated by the global financial crisis in the recent past.
During the last ten years, the OBS of the banking sector witnessed substantial growth, especially that of new private sector banks and foreign banks. With the onset of the global financial turmoil, the policy on the OBS was tightened in August 2008. Resultantly, there was a decline in the OBS of the banking sector in 2008–09 and 2009–10. However, with the onset of recovery, the OBS of the banking sector again witnessed positive growth in 2010–11 and 2011–12.
Major Components of OBS (Contingent Liabilities)
Letter of Credit A letter of credit (LC) is defined as ‘an arrangement by means of which bank acting at the request of the customer, undertakes to pay a third party a predetermined amount by a given date, according to agreed stipulations and against presentation of stipulated documents’. The bank earns a specific amount of commission when it deals with an LC on behalf of its customer. (More on LCs in the Chapter on ‘International Banking’)
Bank Guarantee A contract of guarantee is a contract to perform the promise, or discharge the liability of a third person in the case of his default. The person who gives the guarantee is called the surety, the person in respect of whose default the guarantee is given is called the principal debtor and the person to whom the guarantee is given is called the creditor. Here, the bank acts as the surety and earns a commission. (More on letters of Guarantee in Chapter 6).
FIGURE 3.7 CONTINGENT LIABILITIES AS PROPORTION OF TOTAL LIABILITIES/ASSETS OF BANK GROUPS IN INDIA

Payment and Clearing Operations This is one of the most important fee-based services of the banking system. A cheque is the most common form of payment system used by banks. Apart from cheque, which is a paper-based payment mechanism, transfer of funds can also be made through electronic payments and funds transfer mechanisms, such as telegraphic transfers, ‘electronic credit transfers, electronic debit transfers, electronic fund transfer and, more recently, the Real Time Gross Settlement System (RTGS).17 (More on payment and clearing operations disaussed in the chapter titled ‘High-tech Banking’).
Forward Exchange Contracts and Other Derivatives A forward exchange contract is a contract between two parties (the bank and the customer). One party contracts to sell and the other party contracts to buy, one currency for another, at an agreed future date, at a rate of exchange, which is fixed at the time the contract is entered into.
This is basically a tool that enables customers to hedge their foreign exchange (forex) exposure. Banks offer two types of foreign exchange contracts. In a special option Forward Exchange Contract (FEC), a rate is quoted to the customer for an agreed validity period where the customer can take up the booked rate during the specified period. Customers who are unsure of the expected payment or receipt dates usually request this type of contract. The second is a fixed date FEC in which a rate is normally quoted for a fixed maturity date where the customer is required to take up the FEC on the maturity date of the contact. Customers who are certain of their expected payment or receipt dates usually request this type of contract.
Many banks also deal in derivatives. These are discussed in the chapter on ‘Risk Management’.
Fluctuations in the exchange rate and also the higher interest rate environment increase the demand for forward contracts from the customers of banks, which is the biggest component of the OBS exposure of the banking sector. As the economy grows, the demand for such risk management services from the banking sector also increases. On the other side, from the point of view of banks, OBS exposures, which are basically fee-based services, increase the gross income although at a higher level of risk. Thus, if the risk appetite of a particular bank is high, it has an incentive to accumulate OBS exposures to reap more fee income.
The role of the OBS in generating ‘other income’ was examined by the RBI using regression analysis. Results indicated that 1 per cent increase in OBS exposures increases ‘other income’ of the banking sector by 0.08 per cent. Thus, banks have an incentive to accumulate OBS exposures to earn more income and therefore, profit.
Other Sources of Non-Interest Income Most of the banks have expanded their fee-based services to selling of insurance policies, mutual fund products and cash management services. Popular forms of fee-based businesses are:
- Fees from insurance business.
- Credit/debit cards—apart from fees, credit cards loans also earn higher spreads than other assets. Debit cards are even more lucrative, as they generate fees at virtually no risk.
- Mutual fund distribution.
Banks financial statements
The following charts and table depict Banks’ performance indicators in 2014–15.18

(Chart 2.7, page 7 of Report)
Growth in select items of Income and Expenditure of banks
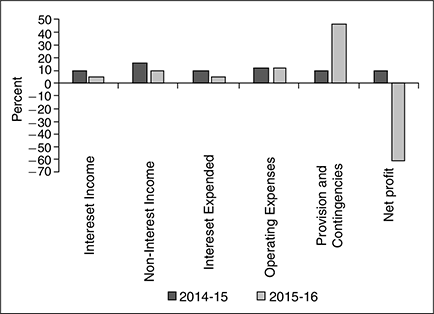
(Chart 2.8, page 8 of Report)
Chart: More indicators of banks’ financial performance

(Chart 2.9, page 8 of Report)
Table: Banks’ ROA and ROE (percent)
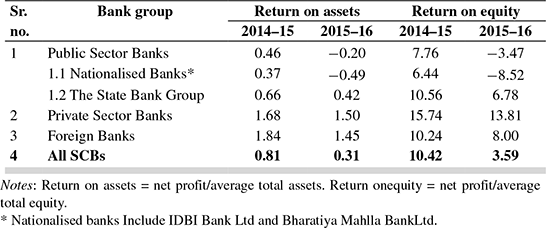
(Table 2.1, page 8 of Report)
QUESTIONS ON CASE STUDY
- What are the key trends in banks’ performance from 2011–12 to 2014–15?
- List the indicators that show that banks have become stronger over this period.
- List the indicators that show banks have become more risky over this period.
- What is your overall conclusion about the performance of banks in India over this period?
ANNEXURE V
Indian Accounting Standards (IndAS) for banks and other financial institutions
The Ministry of Corporate Affairs (MCA), Government of India notified the Companies (Indian Accounting Standards) Rules, 2015, and in January 2016, outlined the roadmap for implementation of International Financial Reporting Standards (IFRS) converged Indian Accounting Standards for banks, non-banking financial companies, select All India Term Lending and Refinancing Institutions and insurance entities.
According to RBI’s directives in February 2016, Banks will comply with the Indian Accounting Standards (Ind AS) for financial statements for accounting periods beginning from April 1, 2015 onwards, with comparatives for the periods ending March 31, 2018 or thereafter. Ind AS shall be applicable to both standalone financial statements and consolidated financial statements. “Comparatives” shall mean comparative figures for the preceding accounting period.
Though the convergence was mooted in 2007, the delayed migration to IFRS converged standards by the banking industry, was on account of the anticipated changes in the global standards for financial instruments by June 2011 as the International Accounting Standards Board (IASB) had embarked on a joint project with the Financial Accounting Standards Board (FASB) of the US to replace International Accounting Standard (IAS) 39: ‘Financial Instruments- Recognition and Measurement’ with IFRS 9 -Financial Instruments.
Ind AS implementation is likely to significantly impact the financial reporting systems and processes and, as such, these changes need to be planned, managed, tested and executed in advance of the implementation date.
The new requirements would be substantially different from the previous regulatory guidelines, which were more rule based and prescriptive. Apart from volatile movements within profitability and equity, Ind AS could also impact the way capital requirements and resources are calculated, and thereby affect the capital ratios.
ENDNOTES
- The basic nature of banking business is similar in all countries. Only nomenclatures and disclosures may differ.
- The burden will be a negative figure in most banks. Hence, the burden is measured as a ratio with the denominator as total assets—the lower the absolute difference in the numerator, the more profitable the bank.
- Section 17 of the Banking Regulation Act reads as follows: Reserve Fund—(1) Every banking company incorporated in India shall create a reserve fund and [* * *] shall, out of the balance of profit of each year as disclosed in the profit and loss account prepared under Section 29 and before any dividend is declared, transfer to the reserve fund, a sum equivalent to not less than twenty per cent of such profit. (1A) Notwithstanding anything contained in sub-section (1), the central government may, on the recommendation of the Reserve Bank and having regard to the adequacy of the paid-up capital and reserves of a banking company in relation to its deposit liabilities, declare by order in writing that the provisions of sub-section (1) shall not apply to the banking company for such period as may be specified in the order:
Provided that no such order shall be made unless, at the time it is made, the amount in the reserve fund under sub-section (1), together with the amount in the share premium account is not less than the paid-up capital of the banking company.
- For a discussion on the ‘Investment Reserve’, please refer to Chapter on ‘Investments’.
- Bills rediscounted with SIDBI/IDBI are reflected in the balance sheet as a contra entry. It therefore forms part of the ‘contingent assets’. The amount presents credit extended to a borrower, in which the bank has subsequently rediscounted the bills financed against with these apex institutions under a special scheme meant for the purpose. Hence, such rediscounted amounts do not get reflected in the balance sheet under ‘advances.’
- This approach is followed in ‘Bank Management’, Chapter 4, by Timothy Koch and Scott Macdonald, 4th edition, The Dryden Press, USA.
- Ibid.
- Also called ‘CRAMELs’ (capital adequacy, risk, asset quality, management, earnings, liquidity, and systems).
- Refer chapter on ‘Capital Risk Regulation and Adequacy’.
- Represents ‘non-performing assets’, where payment of interest or repayment of principal is in arrears. For more details, refer to chapter on ‘Credit Risk’. Net NPAs = Gross NPAs LESS Provisions.
- For an analysis of the ROE in its decomposed form, refer to Section III of this chapter.
- David Cates [1996], quoted in Koch, Timothy and Scott Macdonald Bank Management, Chapter 4, 4th ed. (2000). The Dryden Press.
- We will discuss more on these approaches in the section on ‘Loan Pricing’.
- The terms ‘credit risk’, ‘liquidity risk’ and ‘interest rate risk’ are explained comprehensively in later chapters.
- Hannan, Timothy H & Hanweck, Gerald A, 1988. ‘Bank Insolvency Risk and the Market for Large Certificates of Deposit,’ Journal of Money, Credit and Banking, Blackwell Publishing, vol. 20(2), pages 203–11, May.
- Major portions of this annexure are extracted from RBI, Trends and Progress of Banking in India, 2011–12, Box IV.1, page 63.
- For more detail on these modes of funds transfer, visit www.rbi.org.in.
- Source: RBI, Report on Trend and Progress of Banking in India, 2015–16, accessed at www.rbi.org.in)