
CHAPTER TWENTY ONE
Mergers and Acquisitions in the Banking Sector
CHAPTER STRUCTURE
Section I Mergers and Acquisitions
Section II Case of Bank of Madura Merger with ICICI Bank
KEY TAKEAWAYS FROM THE CHAPTER
- Understand the mergers and acquisition scenario in the banking sector.
- Get informed about the strategies of a bank, while thinking about a merger or acquisition.
- Analyze the classic case of the Bank of Madura Merger with lClCl Bank.
- Discuss the case of major bank merger in Japanese banking sector.
SECTION I
MERGERS AND ACQUISITIONS
Business combinations which may take the form of mergers, amalgamations and takeovers are important features of corporate restructuring and governance. They have played an important role in the growth of a number of leading companies in the world over. Subsequent to the structural adjustment programmes in the Indian economy, restructuring of companies in the form of collaborations, mergers and acquisitions have taken place in most of the industries including banking, information technology, fast-moving consumer goods and pharmaceuticals.
The principal factors behind the corporate restructuring activity in India have been the policy changes that were announced in the form of economic reforms. These include removal of restrictions on corporate investments and growth contained in the Monopolies and Restrictive Trade Practices Act (MRTP Act), extensive trade reforms involving lowering of tariff and physical barriers on imports, financial sector reforms permitting public sector banks and financial institutions to tap capital markets, a policy to encourage the inward flow of foreign direct investment and foreign portfolio investment.
Mergers and acquisitions are results of business strategy. While mergers are a result of the decision of two organizations, acquisitions are a takeover of one organization by another. A ‘forced’ merger or a merger due to a survival problem is normally known as an amalgamation.
Although amalgamation, merger and acquisition are principal tools of corporate restructuring, they bring with them a sense of uncertainty. Despite the restructuring frenzy, such strategic transactions in the banking sector could fail or perform far below potential because of mistakes in post-merger integration. On the other hand, it could also be arousing success.1
Mergers and acquisitions have been the principal tools of corporate restructuring in India after the implementation of economic reforms since 1991. The Indian corporate sector has experienced a major restructuring through mergers and acquisitions with the changes brought about in the MRTP Act as well as in the Industrial Policy Resolution of June 1991, which relaxed the norms for licensing and growth. There are some factors that motivate executives to think about a merger or acquisition. Many executives think it is good to be big in a globalizing economy. Companies seem to be combining at a rate almost unprecedented in history on a global scale. In the automobile industry, Daimler-Benz and Chrysler have joined hands, and Ford has taken over the automobile operations of Volvo and so on. In the banking industry, Grindlays merged with Standard Chartered Bank. Similar merger examples can be found in industries as diverse as entertainment, telecommunication and the oil sector. In India, recent mergers in the banking sector have been the merger of Times Bank with HDFC Bank and merger of Bank of Madura (BoM) with ICICI Bank.
The possible outcomes of mergers and acquisitions in banking sector are downsizing, relocations, technological changes and an insecure feeling among employees. The most common attitude that prevails in ‘bank mergers’ is the attitude of ‘us versus them’ due to issues like seniority. This attitude gets further aggravated if there are cultural differences and lack of acceptance of each other’s processes if one bank is superior in terms of tasks and methodologies than the other.
Merger seems to lead to financial and strategic growth. The strategic management aspect of merger has been analyzed in this chapter on the basis of factors such as shareholder value, competition, geographical base and market share of companies in the mergers deal. Ghemawat and Ghadar (2000)2 have found that the rush towards huge mergers is based on a faulty understanding of economics. They have pointed out better ways to address globalization than relentless expansion through merger. Venkitesware (1997)3 has analyzed the emerging scenario in the context of restructuring corporate India. Pawaskar (200l)4 studied the impact of mergers on corporate performance by comparing the post-merger performance of the acquirer with its pre-merger performance, taking a sample of 36 cases of merger between 1992 and 1995. The regression results in the study showed that there are no significant differences in the financial characteristics of the two firms involved in merger. It is worth noting that the concept of `too big to fail` has been criticised by experts in the context of global financial crisis 2008–2010, with the collapse of big firms in the banking and financial services industry.
In his research study, Pandey (2001)5 has analyzed the stock price performance of target firms in the context of change in management control in the case of takeover announcements and shown that the target firm valuations increase in the run up to announcement. There is a dearth of literature on mergers and acquisitions in the Indian context, which could potentially look at the factors influencing merger decision, and the impact of the swap ratio announcement on the share price. This chapter is a modest attempt to contribute to the literature on mergers and acquisitions in the Indian context.
‘Survival of the fittest’ has become a reality in the case of commercial banks. In this era of globalization, banks will have to be competitive in order to face challenges and leverage opportunities. With the decision taken by the RBI to implement the Basel Committee recommendations on banking supervision (Basel II), commercial banks are required to follow prudential norms and maintain sound financial ratios like higher capital adequacy ratio (CAR) and low non-performing assets (NPA). This implies that ‘small is no longer beautiful’ in Indian banking industry.
Although the merger of a bank can be considered as a barrier to perfect competition, it makes the acquiring bank stronger organization that can face competition from aggressive multinational banks.6 A bank merger could happen due to different reasons. One reason could be lack of resources, both capital and labour, that are required for competing with the big players, forcing the ‘small’ ones to merge with the ‘big wigs’. This could happen if a bank finds it difficult to make a profit due to an increase in NPA or other such reasons. This phenomenon is known as amalgamation, e.g., the GTB amalgamation with Oriental Bank and Nedungadi Bank’s amalgamation with Punjab National Bank. A merger could also happen because a bank’s board of directors agrees for a single new company if their shareholders get a better price in the form of the swap ratio, e.g., Bank of Madura’s merger with ICICI Bank.
SECTION II
CASE Of BANK Of MADURA MERGER wITH ICICI BANK7
On Friday, 8 December 2000, BoM and ICICI Bank decided to work out a merger of the former with the latter. The news was published in the daily newspapers on 9 December and the merger decision with swap ratio was officially announced on 11 December 2000. The shareholders approved the decision on 19 January 2001 and the banks got an approval from the RBI on 1 March 2001.
In this chapter, an analysis of the synergies of the merger of BoM with ICICI Bank in the Indian banking industry and the strategic factors to be considered while taking a merger or an acquisition decision have been discussed. The objective is to look at the valuation of the swap ratio (ratio at which shareholders of the old company receive shares of the new company in exchange for shares in the old company), the announcement of the swap ratio, share price fluctuations of the banks before the merger decision announcement and the impact of the merger decision on the share prices. An attempt has also been made to look at the suitability of BoM to merge with ICICI Bank.
Profiles of Banks
Profile of Bank of Madura The profile of BoM is listed as follows:
- A South India-based well-established bank with a track record of 57 years with strong brand equity, established in the year 1943.
- Asset base: Over ₹4,400 crore with a CAR of 14.25.
- Distribution reach (financial year 2000) and automation: A total of 263 banking branches, 182 branches in Tamil Nadu with 1.2 million customer accounts, 132 computerised branches that account for 90 per cent of the business, 47 branches networked through VSATs.
- Employees: Total strength of 2,577, of which 2,000 employees are computer literate.
Profile of IcIcI Bank The profile of ICICI Bank is listed as follows:
- The first Indian bank to list on the New York Stock Exchange with US GAAP accounting. It was established in the year 1994 by Industrial Credit and Investment Corporation of India (ICICI) as a new generation private sector bank.
- Asset base: It is one of the largest private sector banks based in India with an asset base of over Asset base: It is one of ₹12,000 crore with strong CAR of 19.6 per cent.
- Distribution reach and automation: Technology-driven business growth with 104 branches, 366 ATMs (as on 7 December 2000) and the largest ATM network in India. Total number of ATMs has been increased to more than 1,000 by ICICI Bank in the year 2001 along with ten call centres. All branches have been computerised, and Internet banking facility has been provided to the customers.
- Employees: Total strength of around 1,500, all of whom are computer literate.
TABLE 21.1 COMPARISON OF BALANCE SHEETS
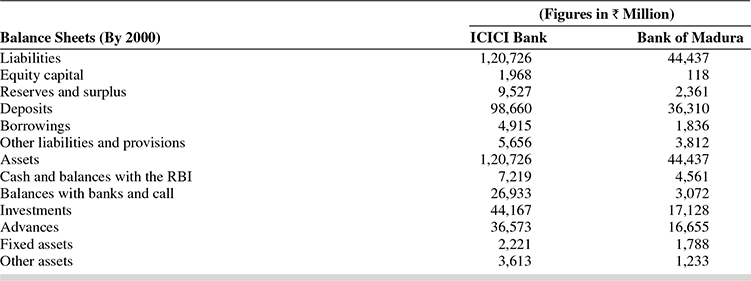
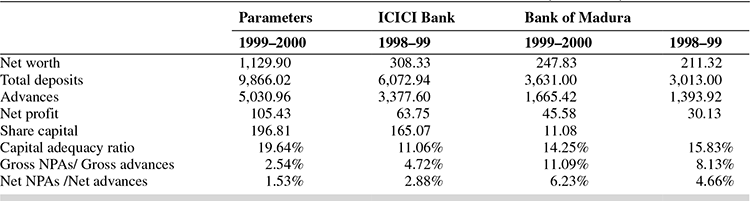
A comparison of balance sheets of ICICI Bank and BoM (financial year 2000) shows that ICICI Bank has got more assets (both fixed and other) than BoM (see Table 21.1). They have given more advances (₹36,573 million) than BoM (₹16,655 million), and they have mobilised amount of deposits a higher (₹98,660 million) than BoM (₹36,310 million).
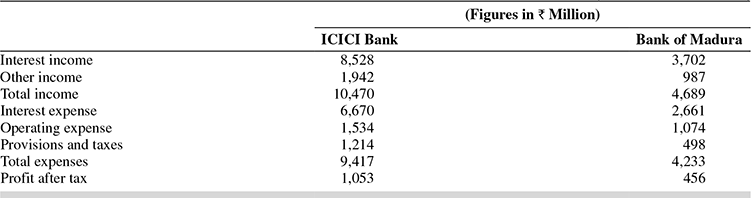
The income statements of ICICI Bank and BoM for the financial year 2000 are given in Table 21.2. ICICI Bank’s interest income was ₹8,528 million whereas BoM’s interest income was much lower at ₹3,702 million. Total income of ICICI Bank (₹10,470 million) was more than twice of that of BoM (₹4,689 million).
Profit after tax of ICICI Bank was also more than twice of that of BoM.
TABLE 21.2 COMPARING INCOME STATEMENTS OF ICICI BANK AND BANK OF MADURA (FINANCIAL YEAR 2000)
Swap Ratio and Stock Price fluctuations
The competition for more business volume and the motivation to increase the shareholder value with the desire to become a big player have motivated banking executives in India to think about the mergers and consolidations. Though the Indian banking industry witnessed the emergence of new private banks like Times Bank, IndusInd Bank, ICICI Bank, HDFC Bank, UTI Bank and Global Trust Bank in the early 1990s, many executives felt the need for consolidation of operations in the late 1990s in order to compete with other strong players. There were talks between banks (even with the old private sector banks) to arrive at an acceptable swap ratio for a possible merger.
On 8 December 2000, Friday, ICICI Bank and BoM came together to work out a merger of the two banks. swap ratio announcement was postponed to 11 December, Monday, by the board of directors of the banks. However, on hearing the news (before it appeared in newspapers on 9 December 2001, Saturday) about the merger decision between these banks, ICICI bank’s stock shot up 12 per cent to ₹170 and BoM’s by 8 per cent to ₹131.6 on 8 December at the Bombay Stock Exchange (Saturday and Sunday are holidays in the stock market). The expectation that the acquiring bank would become a strong player, motivated people abroad too, on the same day, to purchase shares of ICICI bank at the New York Stock Exchange in bulk, and the price of the American Depository Share of ICICI bank shot up 17 per cent on the same day, from the previous day’s closing value of USD 8.12.
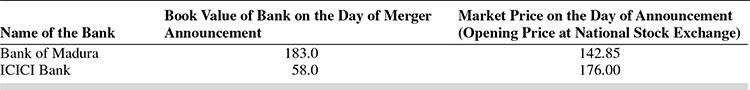
It is interesting to look at the factors influencing swap ratio in a merger deal. The swap ratio announced in the case of the BoM–ICICI Bank merger was 1:2, i.e., the shareholders of BoM got two shares of ICICI Bank for each BoM share (Table 21.3). The market price of ICICI bank share on 7 December 2000 was ₹152.95 and BoM’s price was ₹122.45 (National Stock Exchange [NSE] closing price. See Annexure I). They could have derived a swap ratio in favour of ICICI bank on the basis of the market price of the shares of both the banks, had they not considered other factors (both financial and strategic). It could have been 10 shares of ICICI bank for 13 shares of BoM, if the valuation was done on the basis of balance sheets of both the banks. Again, the swap ratio could have been in favour of ICICI Bank, if they had done valuation on the basis of NPA of both banks. The net NPA to net advances was 1.3 per cent for ICICI Bank, while it was 4 per cent in the case of BoM. To quote from The Economic Times (as published on 9 December 2000), ‘swap ratio could be 10 shares of ICICI Bank for 13 shares of BoM (Table 21.4). The ratio could be influenced by NPA level of the two banks.’ The swap ratio was derived on the basis of strategic and financial ratios. Financial ratios, such as book value of the share of both the banks as on 30 September 2000, earning per share (net profit/shares outstanding), last dividend paid by both of them and the per cent of NPAs were taken into consideration for deriving the swap ratio.
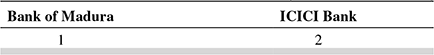
TABLE 21.4 IMPORTANT DATES
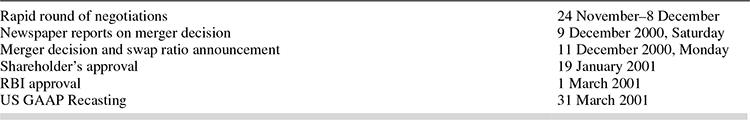
TABLE 21.5 IMPORTANT FINANCIAL RATIOS TO BE ANALYZED FOR SWAP RATIO DERIVATION

Bank of Madura had an edge while analysing the earning per share, book value and percentage of last dividend paid (see Table 21.5) whereas ICICI bank had more assets earned, higher market price of share (pre-merger announcement phase), low NPA and high-tech image. The swap ratio for BoM–ICICI Bank merger could have been in the range of 1:1–1:1.5 as most of the advantages of the BoM get neutralised by the disadvantages (e.g., high NPA level, low market price). In our case, the swap ratio was announced in favour of the BoM, mainly because of the desire of ICICI Bank to acquire a good bank from south India where they did not have strong presence and geographical advantage.
The ICICI Bank could have got a better swap ratio, if the valuation was done only on the basis of market price of the shares of both the banks and with the ‘ceteris paribus’ (other things being same) assumption. ICICI Bank should have got the swap ratio 1: 1.35 (1 share ICICI Bank equal to 1.35 share of BoM on the basis of market price of the shares traded at NSE (₹165: ₹122) on 7 December 2000. But this is not the way the swap ratio is to be calculated in any merger decision. The companies need to analyze other factors like book value, earning per share, dividend paid, profit after tax as well as the need for merger and the motivation for acquisition. The range of possible swap ratios (theoretical and practical) based on various parameters have been given in the Table 21.6.
TABLE 21.6 RANGE OF POSSIBLE SWAP RATIOS

There was speculation in the stock market that the BoM would get a favourable swap ratio for about 2 weeks, when the discussions were going on between the banks. The shares of BoM had gained sharply by around 70 per cent in the past fortnight (last week of November and first week of December 2000), expecting a better swap ratio and merger. The swap ratio for the BoM/ICICI Bank merger was announced as 1:2 (1 share of BoM = 2 shares of ICICI Bank) on 11 December, Monday. This proved that a higher swap ratio is the only way an acquisition can be accomplished in the Indian banking sector. The BoM shareholders got a better deal as they could exchange 1 share worth approximately ₹120 and get approximately ₹304 (average of ICICI Bank share price during 4–8 December 2000, i.e., ₹152 multiplied by 2).
The impact of the announcement of the swap ratio on share prices of the acquiring bank (ICICI Bank) and the acquired bank (BoM) shows that the investors in stock market reacted immediately with acumen (on hearing the news of swap ratio, before it appeared in the next day’s newspaper). The share price of BoM at Bombay Stock Exchange and National Stock Exchange shot up on 11 December 2000 on the same day after the announcement of the swap ratio, and ICICI Bank’s share price slipped down (see Tables 21.7 and 21.8). An extract from The Economic Times dated 12 December 2000 stated ‘The Bombay Stock Exchange share price of ICICI Bank fell into ₹165.30 on 11 December Monday, against the Friday’s close of ₹169.85, however, closed at ₹165.30 (down ₹4.55 from Friday’s close). Bank of Madura scrip, on the other hand, gained from ₹131.6 (8 December 2000 Friday’s close) to touch at ₹142.1 (11 December, Monday’s close)’. The same trend was seen at the NSE as well.
TABLE 21.7 CLOSING SHARE PRICE OF THE BANK OF MADURA (BEFORE AND AFTER THE ANNOUNCEMENT OF SWAP RATIO)

TABLE 21.8 CLOSING SHARE PRICE OF ICICI BANK (BEFORE AND AFTER THE ANNOUNCEMENT OF SWAP RATIO)

TABLE 21.9 CRUCIAL PARAMETERS AS ON THE DATE OF ANNOUNCEMENT OF THE MERGER AND SWAP RATIO
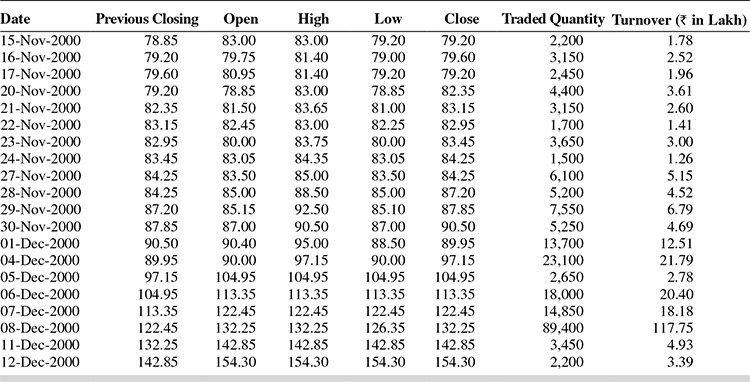
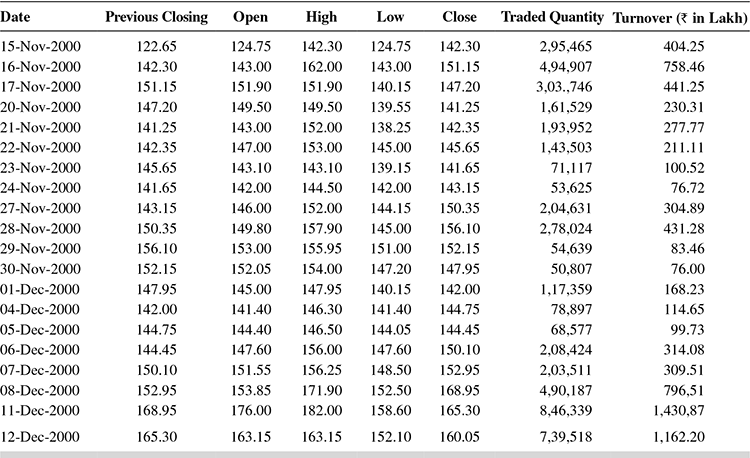
The share price and volume data for the BoM and ICICI Bank traded at the NSE of India from 15 November 2000 to 29 December 2000 are given in Annexure I. The data show that BoM scrip was traded at 79.20 on 15 November 2000 and increased sharply over the period from 15 November 2000. The closing value of BoM scrip on 30 November 2000 was ₹90.50 (up from 79.20) and touched ₹122.45 on 7 December 2000 (around a 70 per cent increase over a fortnight). This could be linked to the rounds of negotiations held between BoM and ICICI Bank during this period for a possible merger. (ICICI Bank had held negotiations with other banks too, for a possible acquisition). The closing price of ICICI Bank scrip at NSE on 15 November 2000 was ₹142.30 and increased to ₹142.95 (closing price of 30 November 2000) and ₹168.95 on 8 December 2000 before the announcement of merger. This shows that the share price of both the banks increased in the pre-merger announcement period, but the percentage price increase of BoM scrip was much more than the increase in the ICICI bank share price. A quotation from The Hindu Business Line (Stock Focus column, 10 December 2000, 1 day before the announcement of the swap ratio) is reproduced here to substantiate the point mentioned above. ‘It is quite likely that the swap ratio may be fixed in a manner that holds out a good deal for shareholders of BoM. The scrip has gained sharply by around 70 per cent in the past fortnight, expecting a favourable swap ratio and merger’.
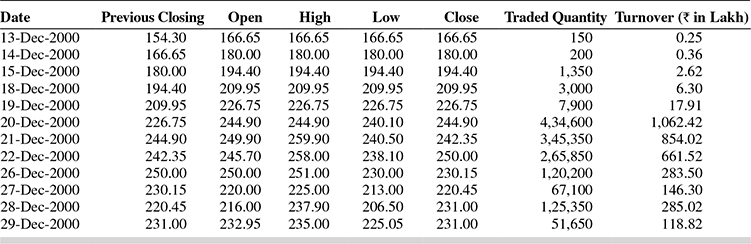
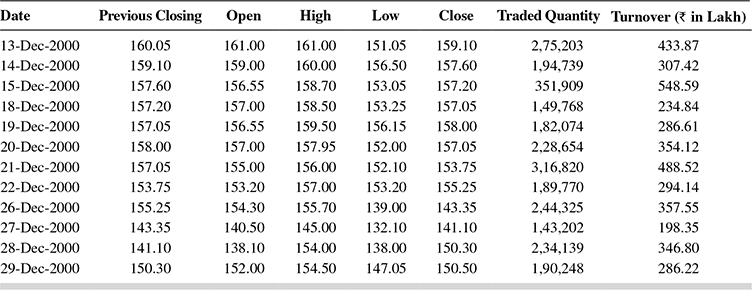
Though the merger swap ratio was announced on 11 December 2000, by the board of directors of the banks, the scripts were available for trading till the date the decision was approved by the shareholders of both the banks. Hence, it is important to look at the impact of the swap ratio announcement on the share prices of both the banks. The NSE data given in Annexure I shows that BoM scrip shot up from ₹132.25 (closing price on 8 December 2000) to ₹142.85 and ₹154.30, ₹166.65, ₹180, ₹194.40, ₹209.95, ₹226.75 and ₹244.90 on 11, 12, 13, 14, 15, 18, 19 and 20 December, respectively. On the other hand, ICICI Bank scrip dropped from ₹168.95 (closing price on 8 December 2000) to ₹165.30, ₹160.05, ₹159.10, ₹157.60, ₹157.20 and ₹157.05 on 11, 12, 13, 14, 15 and 18 December, respectively. Though the ICICI Bank share price increased to ₹158.00 on 19 December, it slipped down further to ₹143.35 and ₹141.10 on 26 and 27 December 2000. The increased demand for BoM scrip resulted in the increase in the price of BoM scrip, because of the expectation of the investors to make money by exchanging the share in future against the ICICI bank share at the 1:2 swap ratio, after the shareholders and the RBI approved the merger decision. (The shareholders can swap the scrip only if the decision of boards gets approval in the meeting of the shareholders and from the central bank of the country, if it is a bank). The stock price fluctuations have been shown in the graph in Figure 21.1 (before the announcement of the merger and swap ratio from 15 November 2000 to 11 December 2000) and Figure 21.2 (after the announcement of merger decision and swap ratio—from 12 December to 29 December 2000) using daily data on share prices of BoM and ICICI Bank scrip traded at NSE.
Strategic factors like immediate strength of customer base, geographical base and enhancement of future shareholder value were also taken into account for derivation of the swap ratio. To quote P. H. Ravi Kumar, Senior Vice President, ICICI Bank (as appeared in The Economic Times dated 12 December 2000), ‘Three issues were considered for the merger, customer base, geographical base and enhancing shareholder value. We had been looking for such an activity. South is high economic activity area where BoM had strong presence.’ In fact, ICICI Bank had negotiated with other South India-based banks including Karnataka-based Vysya Bank, Kerala-Based Federal Bank and South India Bank for a possible merger with the latter with the intention of expanding its operations to south India. But the negotiations were not successful. The statement of Mr. Sinor, Chairman and Managing Director of ICICI Bank is as follows. ‘Bank was looking at a branch network of 350–400, which would have taken at least 5 years to achieve. Moreover, to get an additional 1.2 million customers (BoM’s client base) would have required a minimum 2 years. On the other hand, Mr K. M. Thiagarajan, the then Chairman and Managing Director of BoM released a statement which is reproduced here: ‘The financial consolidation was becoming necessary for the growth of the bank. Shareholder value is more important than anything else. The decision is based on value creation.’
Suitability Analysis
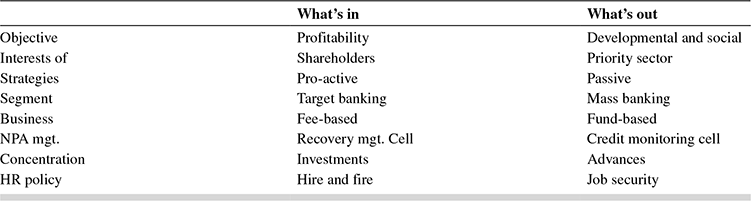
Suitability analysis was undertaken to ascertain the suitability of BoM merger with ICICI Bank. The Bank of Madura represented the culture of a 57-year-old organization whereas ICICI Bank represented a 6-year-old ‘new age’ organization. Hence, an attempt was made to position both banks in context of the new trends in the banking sector. The emerging trends in the banking sector are summarised in the form of what’s in and what’s out format given in Table 21.10. Being an old private sector bank, BoM laid emphasis on the parameters listed under the title ‘what’s out’ in the banking sector. They had, traditionally focused on mass banking strategies based on the social objectives, whereas ICICI Bank, had been emphasizing on parameters like profitability in the interests of shareholders. Being a newborn private bank, ICICI Bank had a credit recovery management cell, whereas BoM had a cell working like a credit monitoring department.
FIGURE 21.1 SHARE PRICE FLUCTUATIONS OF ICICI BANK AND BOM (PRE-SWAP RATIO ANNOUNCEMENT)
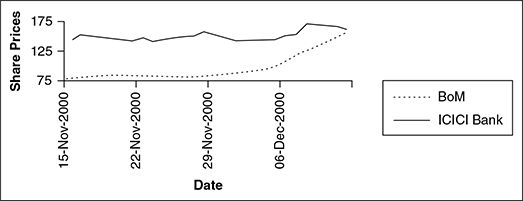
FIGURE 21.2 SHARE PRICE FLUCTUATIONS OF ICICI BANK AND BOM (PRE-SWAP RATIO ANNOUNCEMENT)

ICICI Bank has been a leading private player emphasizing more on ‘What’s In’ rather than ‘What’s Out’ in the banking sector. Thus, this merger is beneficial for the parties concerned since BoM was also trying to focus on new strategies in the banking sector, after the implementation of banking sector reforms in India. It was not a mammoth task for them to position them with the functional styles of ICICI Bank. However, integrating the human resources of BoM with ICICI Bank’s employees was a difficult process for ICICI bank.
TABLE 21.10 NEW STRATEGIES (IN) AND OLD PRIORITIES (OUT) IN THE BANKING SECTOR
Synergies of the Merger
The synergies of the merger of BoM with ICICI Bank can be summarised as follows:
- Network of over 360 branches.
- Reduced time for setting up new branches.
- Combined customer base of 2.7 million.
- Combined asset base of ₹16,000 crore, which makes the ICICI bank amongst the largest private sector banks in India.
In detail, the synergies can be discussed on the basis of the following parameters:
- Financial capability: The merger has enabled them to have a stronger financial and operational structure, which is supposed to be capable of greater resource/deposit mobilization. ICICI Bank will emerge as one of the largest private sector banks in the country.
- Branch network: ICICI Bank’s branch network not only increased by 264, but also increased the geographic coverage as well as convenience to its customers.
- Customer base: The largest customer base (combined) enabled ICICI bank to offer banking, and financial services and products and also facilitate cross-selling of products and services of the ICICI group.
- Tech edge: The merger will enable ICICI Bank to provide ATMs, phone and Internet banking, and financial services and products to a large customer base, with expected savings in costs and operating expenses.
- Priority sector advances: Commercial banks are required to lend money to people in the priority sector which include farmers, people in rural areas and small-scale industry. ICICI Bank did not have many branches in rural areas whereas BoM had lot of branches in rural and semi-urban areas. The enhanced branch network enabled ICICI Bank to lend for micro-finance activities through self-help groups, and for the agricultural sector in its priority sector initiatives through its acquired 87 rural and 88 semi-urban branches.
- Equity capital and EPS: The swap ratio approved was in the ratio of 1:2—two shares of ICICI Bank for every one share of BoM. The deal with BoM diluted the current equity capital by around 12 per cent, and the merger brought about 20 per cent gains in the EPS of ICICI Bank. Also the bank’s comfortable CAR of 19.64 per cent declined to 17.6 per cent (Table 21.11).
TABLE 21.11 FINANCIAL STANDINGS OF ICICI BANK AND BANK OF MADURA (₹ in Crores)
- Managing human resources: One of the greatest challenges before ICICI Bank was managing human resources. When the head count of ICICI Bank was taken, it was less than 1,500 employees; on the other hand, BoM had over 2,500. The merged entity had about 4,000 employees which made it one of the largest banks among the new generation private sector banks. The staff of ICICI Bank is drawn from various banks and business schools, mostly young qualified professionals with a computer background who prefer to work in metros or big cities with good remuneration packages. While under the influence of trade unions, most of the BoM employees have low career aspirations. Many of them have already availed of the voluntary retirement scheme and left. On the other hand, pay of most of the BoM employees were revised upwards. It was a herculean task to integrate two work cultures.
- Managing a client base: The client base of ICICI Bank after merger, was as big as 2.7 million from its past 0.5 million, an accumulation of 2.2 million from BoM. The nature and quality of clients was not uniform. The BoM had built up its client base for a long time, in a hard way, on the basis of personalised services. In order to deal with BoM’s client base, ICICI Bank needed to redefine its strategy to suit to the new culture. If the sentiments or a relationship of small and medium borrowers was hurt, it would have been difficult for them to re-establish the relationship, which could also hamper the image of the bank.
- Managing rural branches: ICICI’s major branches were in major metros and cities, whereas BoM had spread its wings mostly in semi-urban and rural segments of south India. There was a task ahead lying for the merged entity to increase dramatically the business mix of rural branches of the BoM. On the other hand, due to geographic location of its branches and level of competition, ICICI Bank would have a tough time to cope with. For example, an account holder needed to maintain a minimum of ₹5,000 in the savings bank account with ICICI Bank, whereas BoM’s requirement to open a savings bank account was just ₹500. The branches in the rural area had a number of customers from low-income and middle-income groups who could not have maintained ₹5,000 in their savings bank account. Also, most of the BoM employees who were working in the rural branches were likely to retire soon, as the average age of the BoM employees was almost twice that of ICICI Bank. The ICICI Bank employees, mostly youngsters, would not prefer to get transferred to the rural branches because of their preference for city life and culture.
CHAPTER SUMMARY
In this era of globalization, organizations will have to be competitive in order to face challenges. Survival of the fittest has become a reality in most sectors, including banking with the entry of foreign players. On the other hand, mergers can be considered as barriers to perfect competition. But the inclination to create a monopoly and the desire to become a champion in their respective industrial sectors motivate the big players to take over the small ones. Small companies tend to look at the short-term (immediate) gain through mergers and let the ‘big wigs’ acquire them. Lack of resources, both capital and labour that are required to compete with the big players sometimes force the ‘small’ to merge with the ‘big.’ In the case of BoM–lClCl Bank merger; the BoM got a better deal in the form of a higher swap ratio. Therefore, one finds that the BoM has not compromised in the negotiation with ICICI bank. At the same time, the desire of lClCl bank to achieve more strength within a less span of time and their urge for relentless expansion have led them to agree upon a higher swap ratio with the BoM shareholders. Therefore, the BoM shareholders benefited from the merger in the short run and 100 banks could increase the number of customers, branches and business, which would be helpful to them in the long run to raise new challenges to other competitors in the Indian banking industry.
After viewing the merger syndrome, there could be a possibility that permutations and combinations of mergers in the Indian banking industry may take place in future. Public sector banks, which will shortly be losing their public sector nature (as the Government of India is planning to reduce its stake from 100 per cent to 33 per cent) are strong contenders to take over old generation private sector banks. Foreign banks will not stay behind in the takeover bids.
TOPICS FOR FURTHER DISCUSSION
- What are the implications of mergers in banking sector?
- Why did BoM agree for merger with ICICI Bank?
- Do you think that the ‘business strategy’ of ICICI Bank played a more important role than financial ratios, while deciding the swap ratio?
- What are the synergies of the BoM merger with ICICI Bank? Analyse the effect of the swap ratio on share prices?
- Had you been the CEO of ICICI Bank, what decision you would have taken?
ANNEXURE I
SHARE PRICE VOlUME DATA
Share Price Volume Data (National Stock Exchange)
DATA FOR BANK OF MADURA—FROM 15 NOVEMBER 2000 TO 12 DECEMBER 2000
Share Price Volume Data
DATA FOR THE BANK OF MADURA—FROM 13 DECEMBER 2000 TO 30 DECEMBER 2000
Share Price Volume Data
DATA FOR ICICI BANK—FROM 15 DECEMBER 2000 TO 12 DECEMBER 2000
ANNEXURE II
THE MERGER Of BANK Of TOKyO MITSUBISHI AND UfJ BANK8
On 9 September 2005, Mitsubishi Tokyo Financial Group (MTFG) and United Financial of Japan (UFJ Holdings) announced that they had received the approval for the merger and began joint operations as merged entity with the new name Mitsubishi Tokyo UFJ Financial Group, Inc. (MUFG) from 1 October 2005. The commercial banks within the two financial groups, Bank of Tokyo Mitsubishi Ltd (BTM) and UFJ Bank Limited were merged on 1 January 2006 and the new bank was named as Bank of Tokyo Mitsubhishi–UFJ Bank. The new bank, in short, is also known as MUFJ Bank. After the merger, MUFJ Bank became one among the world’s largest financial groups in terms of assets amounting to 1,97,001.6 billion Japanese yen. This merger captured the attention of the business world because it helped both the organizations to create monopolistic power in the Japanese banking industry. Nobuo Kuroyanagi (President/CEO MTFG), a 63-year-old lifetime committed employee who had worked for MTFG from the age of 23 in a range of positions, was the main focal person to press the button to open the curtains for the merger drama.
MTFG had set an aspiration of being one of the top five financial groups in the world. They had aimed to achieve this by creating a premier, comprehensive, financial group that can succeed against competitors globally. They wanted a bank with an extensive and a well-balanced financial network, locally and internationally.
Major Banks in the Japanese Banking Industry
As on 2004, before the merger between MTFG and UFJ, The Mizuho Financial Group (Mizuho), MTFG, Sumitomo Mitsui Financial Group (SMFG) and UFJ Holdings were the four major leading banks in the Japanese banking industry. MTFG and SMFG were the 2nd and 3rd largest banks while UFJ holding was the 4th largest bank. (Refer Exhibit 21.1).
- The Mizuho Financial Group (Mizuho)
Mizuho Bank belongs to the Mizuho Financial Group as a core retail banking unit and was the largest mega bank in Japan until the year 2005 and its headquarters were located in Chiyoda, Tokyo. Mizuho Bank was formed by a merger of Dai-Ichi Kangyo Bank with retail operations of Fuji Bank and the Industrial Bank of Japan, which were major financial institutions. Fuji Bank had been one of the major banks during the post-war era and was formed in 1948 as part of the Yasuda Zaibatsu. During the last half of the 20th century, Dai-Ichi Kangyo Bank was one of the largest banks in the world and was formed in 1971 by merging Dai-Ichi and Nippon Kangyo Banks. When merging the three banks, the Bank Dai-Ichi Kangyo was renamed Mizuho Bank and inherited the groups` individual, small businesses and local/regional government services, while individual banking services were consolidated into the Fuji bank and is being renamed as Mizuho Corporate Bank. Then the two banks, namely, Mizuho Bank and the Mizuho Corporate Bank were consolidated under Mizuho Holdings on October 2005 and were transferred to the Mizuho Financial Group. Mizuho Financial Group was initially formed in January 2003 and was financed by Mizuho Holdings by using share exchange. In March 2003, it became sole shareholder of Mizuho Holdings Inc.
- The Mitsubishi Tokyo Financial Group
The Mitsubishi Tokyo Financial Group (MTFG) had divided into different subsidiaries, such as Bank of Tokyo–Mitsubhishi, Mitsubhishi Trust, Nippon Trust and Tokyo Trust. Bank of Tokyo–Mitsubhishi was the flagship organization within the group.
This bank (Bank of Tokyo–Mitsubhishi) was the financial wing of the Mitsubishi Group of Companies, but they also expanded their business which covered many Japanese industries ranging from small-, mediumsised companies to individuals. The Mitsubishi Group of Companies were engaged in a broad range of activities including manufacturing, trading, natural resources, transportation, real estate, banking and insurance and were managed and operated individually. They had been able to build a worldwide network and were involved in a range of commercial banking activities locally and internationally.
- Sumitomo Mitsui Banking Financial Group
Sumitomo Group of Enterprises has been one of the oldest surviving business entities in the world and dates back to 1600. Sumitomo Bank was established as a subsidiary of the Sumitomo Group of Enterprises in 1895 and experienced smooth and rapid growth. After World War II, due to some laws Sumitomo Bank was renamed as Bank of Osaka and it was again restored as Sumitomo Bank in 1952. In 1965, it merged with Kaiwachi Bank and in 1986 with Heiwa Sogo Bank. Due to the crisis in the banking sector in 1990s, the financial situation continued to worsen, and Sumitomo Bank had also made an unprecedented move of writing off 100 billion (US$895 million)9 in bad loans. In April 2001, Sumitomo Bank merged with Sakura Bank and formed Sumitomo Mitsui banking corporation (SMBC). In December 2002, SMBC established a holding company by the name Sumitomo Mitsui Banking Corporation Inc. through a share transfer and became a wholly-owned subsidiary of SMFG. In 2003 again, SMBC merged with Wakshio Bank and the same name was kept. During this period, Sumitomo Bank was one of the leading providers of highest quality financial products and services by maintaining their respect and confidence, providing quality service to its worldwide clients. Its expansion ranges all over Japan as well as nearly hundred overseas branch offices, and subsidiaries in about 30 countries
- UFJ Group
UFJ group was headquartered in Osaka. UFJ Bank was the flagship firm within the group, which was formed by merging Sanwa Bank and Tokai Bank in 2001. Sanwa bank had an extensive branch network in Tokyo and Osaka, and it had been providing innovative financial services with a well-established service network. Tokai Bank, which was one of the leading banks in Nagoya, had a considerable presence in Tokyo and Osaka.
Financial Times had ranked UFJ as 392 among the Global 500 companies, during the pre-merger period. During this period, UFJ Group was ranked 14th in the world and 4th in Japan among banks in terms of assets. Operations were being broadly classified into retail banking and corporate banking. Retail banking business were handled by providing housing and consumer loans. Corporate banking division mainly catered for medium and small companies providing services, such as electronic banking, sales of derivatives and corporate finance services, global banking and trading, trust operations, securities and investment banking, and asset management. UFJ had been able to establish a wide global network covering the US, Canada, Europe, the Middle East and Oceania. However, during the three fiscal years 2002–2004 (pre-merger period), UFJ had been facing losses.
Need for Mega Banks
Global financial industry had turned into a major battle field among the major mega banks by the end of 20th century. Merging banks and forming mega banks was not only common to Japan but had been a worldwide trend in 1990s, even though it has been criticised in the context of global financial crisis in 2008–2010.
Japanese banks were ranked in higher positions among the banks in the world during 1980s. Japanese yen had appreciated more than 50 per cent in 1980s (mainly because of excessive exports and surplus in trade account) which caused deflationary effects in Japan. The government and the central bank, i.e., the Bank of Japan relaxed the rules for providing credit (loan) to counteract the deflationary pressure. Loans and share prices had risen and touched peak points. Japanese firms had become cash-rich by mid-1980s with remarkable export growth rate and high share prices. Banks also started investing lot of money (lent money for borrowers who invested in real estate), in order to compensate for the lowered demand for loans by the companies to meet their working capital requirements.
In early 1990s, there were signs that Japanese economy was slowing down. Bank of Japan introduced new measures to control the credit and tightened monetary policy. As a result, share and land prices went on a down spin and the individual borrowers defaulted the loan repayments. This was instrumental in creating large amount non-performing loans (NPL) in Japanese banks during 1990s. Major banks began to crumble with the collapses and bankruptcies. In order to reduce their NPL and to earn sustainable revenues and profits recovering from the exiting problems, banks tried to merge and get stronger with their capital and assets. Japanese financial service sector triggered due to economic bubble during the 1990s.
Due to the inability of securing sufficient revenues from its conventional loan operations, Japanese banks made effort to expand their revenues made through service charges and commissions while others were seeking to obtain profit stream in securities services through investment banking services. They also started to focus on small-scale consumer loans which were let out for consumer finance companies up to this period. Therefore, many banks tried to associate and attach business by way of merger proposals.
Compared to the banks in many other countries during this period of time, Japanese banks had been lagging behind in terms of high-risk financial products such as derivatives. In order to perform banking activities, such as investment banking services, massive capital base was required. Also, in order to expand their international operations, merging and forming into mega banks gave them the necessary strength to compete with their international competitors.
The Establishment of Mitsubishi Tokyo UFJ Financial Group Inc. and MUFJ Bank The merger and the establishment of Mitsubishi Tokyo Financial Group Inc. (MUFG) and the combined new bank named as Bank of Tokyo Mitsubhishi–UFJ (MUFJ Bank) were fully completed on 1 January 2006. The new group’s asset base was regarded as the world’s largest asset base in the global banking sector. The deposit base was also significantly higher than other Japanese banks.
The new group established its corporate governance based on a dual system which comprised of a system of voluntary committees, corporate auditors and directors supplemented by external perspectives. In order to fully and appropriately preview their responsibility of accountability to shareholders and to enhance management transparency, they appointed independent directors on the board. They also had appointed outside corporate auditors. An advisory board had been established, which composed of external experts. This helped them to build up a proper framework for risk management and internal audit across the entire group to strengthen oversight of management. They also listed their bank in the New York Stock Exchange.
Synergies of the Merger
The synergies and the impact of the merger between Bank of Tokyo Mitsubhishi and UFJ Bank Ltd can be analyzed as follows.
- Impact on loans and deposits
• Pre-merger period (until 2005). Loans and bills discounted for the physical year 2004 (including trust accounts) had recorded an amount of 85 trillion yen and had increased for the physical year 2005 by 1.1 trillion to 86.1 trillion yen, mainly due to the growth in lending by overseas branches and subsidiaries. Total amount of deposits for the physical year 2004 amounted to 118.2 trillion yen, which had got increased by 1.1 trillion yen than that of the previous year. For the physical year 2005, the amount got increased by 0.7 trillion to record 118.9 trillion yen.10 (see Exhibit 21.1 to 21.5)
• Post-merger (2006 onwards). For the physical year 2006, loans and bills discounted decreased by 0.6 trillion yen than that of the previous year and amounted to 85.1 trillion yen.11 During year 2007, loans and bills discounted had increased by 3.6 trillion yen than the previous year and amounted to 85.1 trillion yen.12 For the physical year 2008, the above amount again got increased by 3.4 trillion to record 92 trillion yen.13 This increment was mainly due to the factors such as increase in domestic corporate lending. Deposits for the year 2006 amounted to 118.7 trillion yen. The amount for the year 2007 got increased from 2.5 trillion yen and recorded an amount of 121.3 trillion yen. This was mainly due to the increase in deposits in overseas offices. Deposits got again decreased by 1.1 trillion to 120 trillion yen in the year 2008 due to decrease in deposits at overseas offices (refer Exhibit 21.6).
- Non-performing loans
• Pre-merger. Non-performing loan (NPL) ratio for the fiscal year 2004 was 3.33 per cent, and for the year 2005, the percentage values decreased by 1.26 points to 2.07 per cent. This was a result of decline in newly arising NPLs and progress in the disposal of NPLs.
• Post-merger. In the fiscal year 2006, disclosed NPL ratio was 1.46 per cent and had decreased by 0.60 points than that of the previous year. The ratio again got decreased for the year 2007 by 0.31 points to 1.15 per cent. This was mainly due to credit rating improvements of obligors and progress in the disposal of NPLs. For the year 2008, the ratio got increased by 0.09 per cent to record 1.24 per cent.
- Domestic and overseas branches of MUFG
Before the merger, MTFG had 306 domestic branches and UFJ bank had 546 branches all over Japan. By the year 2008, the total number of domestic branches of MUFJ Bank had increased to 1,244. Before the merger, MTFG had 81 overseas branches and UFJ had 26 overseas branches. Both holding companies altogether had 107 overseas branches. After the merger, they opened new overseas branches, and at the end of the fiscal year 2006, the total number of overseas branches was 429. The number of overseas branches increased in the year 2007 to 456 branches, and in the year 2008 to 459 branches. MUFG is the largest current global network than any of the Japanese financial group with over 400 locations in more than 40 countries and has a solid domestic customer base with approximately 40 million retail accounts and 5,00,000 corporate clients.
- Share price In this section, we compare the Tokyo stock market share prices of the combined financial group MUFJ (also known as Bank of Tokyo Mitsubhishi–UFJ) during the post-merger period with that of MTFG bank during the pre-merger period. The price data were collected from Yahoo finance portal and were given in US dollar terms. A comparison exercise with NIKKEI 225 (Stock market index for the Tokyo Stock Exchange) has also been undertaken. From the year 2002 to end of 2004 (prior to the merger), there was no clear improvement/increase in the share prices of MTFG bank. From the second half of 2004, particularly during the second half of 2005, MTFG share price had risen. This could be because of rumours and the news pertaining to the discussion for merger between MTFG and UFJ group.
While considering as a whole, share prices had improved than that of the past during the first 1 year of post-merger period, but there was no stable improvement after that. The extent of fluctuation was greater than the fluctuations in the benchmark index NIKKEI 225. From October 2001 to November 2002, market closing share price had fluctuated between 6.15 and 7.15 USD. During December 2002 to September 2003, the share price had fallen down much more and had lowered down to less than 4 USD, continuously for about 3–4 months. The share price had gone up during October 2004 to January 2006 but had fluctuated between 8.75 and 13.7 USD (see Exhibit 21.7).
After the completion of the merger in January 2006, there had been an improvement in share prices until October 2006, but since then up to March 2009, share prices had declined. At the end of the year 2007, the value had decreased down to about 9.8 USD. At the end of year 2008, the value had decreased to about 6.5 USD (This could be because of the global financial crisis). During the year 2008, the share price had fluctuated between 5.5 and 11 USD. In the year 2009, on a specific day, this had fallen down to around 4.5 USD. Therefore, one can say that from the merger, there had been no visible positive effects of merger on the share prices of the merged entity (refer Exhibits 21.6–21.9).
Strategies for the future
Getting stronger with earnings and profits has been a major target for the MUFJ Bank. They have been trying to concentrate more on to demonstrate sustainable growth strategies in their core business areas, including retail, corporate and trust assets businesses. They have the ability to strengthen their investment product sales by responding well to each customer segment in the retail business segment. But, the challenges remain as it is, whether it is possible for them to upgrade activities in all categories and main sources of earnings in retail operations, such as investment product sales, consumer finance and housing loans. Would it be difficult to reinforce internal management systems, execute a strategy to increase distribution channels, etc. are some of the actions that can take place to increase retail earnings. Recently MUFG had made a US$9 billion strategic investment in Morgan Stanley and had come up with a strategic alliance and had also signed a memorandum of understanding for integration of their respective security firms in Japan, creation of marketing joint ventures for corporate finance operations in America, developing a cooperative framework in Asia, etc.
Does it make sense to use this alliance to advance their corporate and investment banking strategies as well as to expand their businesses globally?
Another question is how to take advantage of their strong capital base for investments? Do they have to look forward and review for possible business opportunities such as services that use Internet and which can deliver solid returns that enhance their profitability and growth?
EXHIBIT 21.1 RANKINGS: JAPANESE BANKING INDUSTRY (2004—PRE-MERGER)
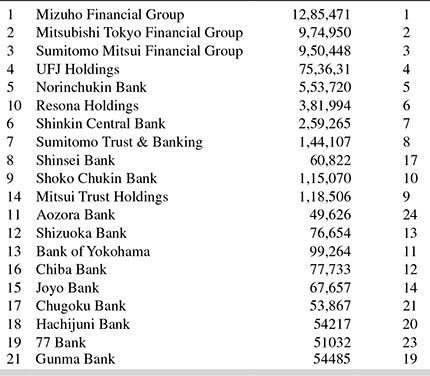
EXHIBIT 21.2 NUMBER OF BRANCHES WITHIN JAPAN AND OVERSEAS (2004—PRE-MERGER)

EXHIBIT 21.3 SYNERGIES OF CONSOLIDATED STATEMENTS OF OPERATIONS: EARNINGS (2004–05 INCLUDES PRE-MERGER STATISTICS

EXHIBIT 21.4 NET INCOME

EXHIBIT 21.5 IMPACT ON LOANS AND DEPOSITS (2004–05 INCLUDES PRE-MERGER STATISTICS AND 2006–08 INCLUDES POST-MERGER STATISTICS)

EXHIBIT 21.6 PRE-MERGER MONTHLY SHARE PRICES OF MTFG (01/2006–03/2009)

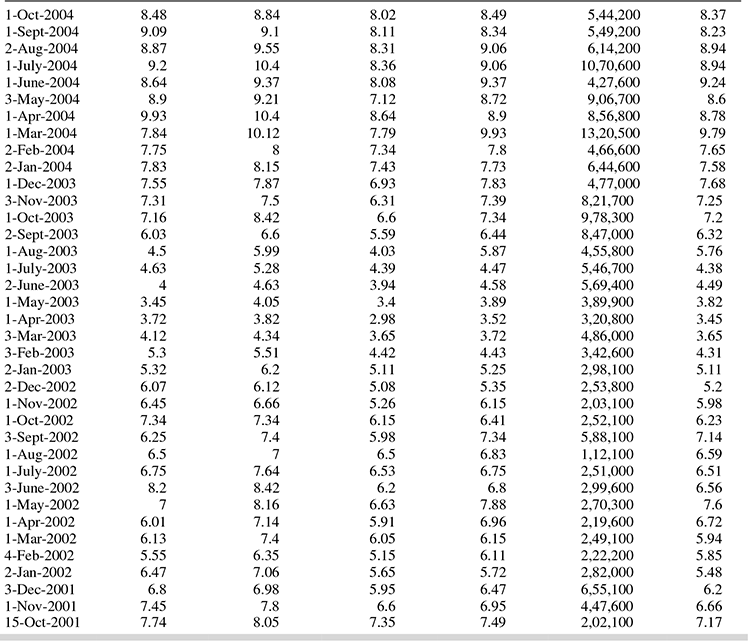
EXHIBIT 21.7 COMPARISON OF SHARE PRICE FLUCTUATIONS MTFG VERSUS NIKKEI (PRE-MERGER 2002–12/2005)

EXHIBITS 21.8 POST MERGER SHARE PRICE FLUCTUATIONS
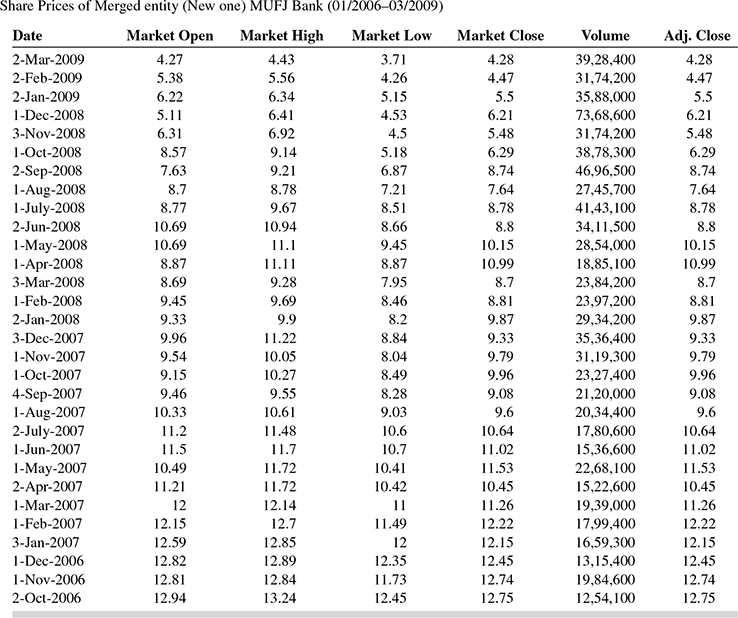
EXHIBIT 21.9 COMPARISON OF SHARE PRICE FLUCTUATIONS MTUFG VERSUS NIKKEI (POST-MERGER–01/2006–03/2009)

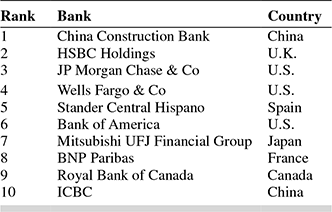
EXHIBIT 21.10 TOP 10 BANKS IN THE WORLD IN TERMS OF ASSETS $MILLION (2009)

EXHIBIT 21.11 TOP 10 TOP 10 BANKS IN THE WORLD IN TERMS OF MARKET CAPITALIZATION $ MILLION (2009)
SELECT REFERENCES
- Basant, Rakesh (2000). ‘Corporate response to Economic Reforms’, Economic and Political Weekly, 4 March, pp. 813–822.
- Paul, Justin (2003). ‘Bank of Madura Merger with ICICI Bank: An Analysis’, IIM-B Management Review vol. 15, no. 3, July–September, pp. 10–17.
Newspapers
The Economic Times 7 December to 15 December 2000. The Hindu Business Line, 7 December to 15 December 2000. Business Standard, 7 December to 15 December 2000.
ENDNOTES
- Walter, Ingo (2004). Mergers and Acquisitions in Banking and Finance—What Works, What Fails Why? New Delhi: Oxford University Press.
- Ghemawat, Pankaj and Fariborz Ghadar (2000). ‘The Dubious Logic of Global Megamergers’ Harvard Business Review, July–August, pp. 65–72.
- Venkiteswaran (1997). ‘Restricting of Corporate India, Emerging Scenario’, Vikalpa, vol. 22, no. 3, July–September, pp. 3–13.
- Pawaskar, Vardhana (2001). ‘Effect of Mergers on Corporate Performance in India’, Vikalpa, vol. 26, no. 1, January–March, pp. 19–31.
- Pandey, Ajay (2001). ‘Takeover Announcements, Open Offers and Shareholders’ Returns in Target Firms’ Vikalpa, vol. 26, no. 3, July–September, pp. 19–26, IIM Ahmedabad
- Paul, Justin (2003). ‘Business Strategy for Niche structure: A Case Study of Acquisition from Indian Commercial Banking Market’, Award Winning Paper, 25th Bank Economist Conference (BECON-2003), 11–12 December.
- This case was prepared by Professor Justin Paul solely for the purpose of classroom discussion. This case is not intended to serve as endorsements, sources of primary data or illustrations of effective or ineffective management. Statistics reported in this case were, unless otherwise, specified as on 2000.
- Professor Justin Paul and Yasiru Vikrama, Nagoya University of Commerce and Business co-authored this case study. This case is not intended to serve as endorsements, sources of primary data or illustrations of effective or ineffective management. The case is prepared solely as the basis for classroom discussion.
- Source: International Directory of Company Histories, Vol. 26. St. James Press.
- Financial review for the fiscal year ended on 31 March 2006, MUFJ Group.
- ibid as on 31 March 2007.
- ibid as on 31 March 2008.
- Financial review for the fiscal year ended on 31 March 2009.