
- Cover
- Title Page
- Contents
- About the Authors
- Preface
- I Introduction to Marketing Research
- 1 Marketing Research: An Introduction
- 1.1 Introduction
- 1.2 Difference Between Basic and Applied Research 5
- 1.3 Defining Marketing Research 6
- 1.4 Roadmap to Learn Marketing Research 7
- 1.5 Marketing Research: A Decision Making Tool in the Hands of Management
- 1.6 Use of Software in Data Preparation and Analysis
- 1.7 Ethical Issues in Marketing Research
- Summary
- Key Terms
- Discussion Questions
- Case Study
- 2 Marketing Research Process Design
- 1 Marketing Research: An Introduction
- II Research Design Formulation
- 3 Measurement and Scaling
- 4 Questionnaire Design
- 5 Sampling and Sampling Distributions
- 5.1 Introduction
- 5.2 Sampling
- 5.3 Why Is Sampling Essential?
- 5.4 The Sampling Design Process
- 5.5 Random Versus Non-Random Sampling
- 5.6 Random Sampling Methods
- 5.7 Non-Random Sampling
- 5.8 Sampling and Non-Sampling Errors
- 5.9 Sampling Distribution
- 5.10 Central Limit Theorem
- 5.11 Sample Distribution of Sample Proportion
- Summary
- Key Terms
- Discussion Questions
- Numerical Problems
- Case Study
- III Sources and Collection of Data
- 6 Secondary Data Sources
- 7 Data Collection: Survey and Observation
- 7.1 Introduction
- 7.2 Survey Method of Data Collection
- 7.3 A Classification of Survey Methods
- 7.4 Evaluation Criteria for Survey Methods
- 7.5 Observation Techniques
- 7.6 Classification of Observation Methods
- 7.7 Advantages of Observation Techniques
- 7.8 Limitations of Observation Techniques
- Summary
- Key Terms
- Discussion Questions
- Case Study
- 8 Experimentation
- 8.1 Introduction
- 8.2 Defining Experiments
- 8.3 Some Basic Symbols and Notations in Conducting Experiments
- 8.4 Internal and External Validity in Experimentation
- 8.5 Threats to the Internal Validity of the Experiment
- 8.6 Threats to the External Validity of the Experiment
- 8.7 Ways to Control Extraneous Variables
- 8.8 Laboratory Versus Field Experiment
- 8.9 Experimental Designs and their Classification
- 8.10 Limitations of Experimentation
- 8.11 Test Marketing
- Summary
- Key Terms
- Discussion Questions
- Case Study
- 9 Fieldwork and Data Preparation
- IV Descriptive Statistics and Data Analysis
- 10 Descriptive Statistics: Measures of Central Tendency
- 10.1 Introduction
- 10.2 Central Tendency
- 10.3 Measures of Central Tendency
- 10.4 Prerequisites for an Ideal Measure of Central Tendency
- 10.5 Mathematical Averages
- 10.6 Positional Averages
- 10.7 Partition Values: Quartiles, Deciles, and Percentiles
- Summary
- Key Terms
- Discussion Questions
- Numerical Problems
- Case Study
- 11 Descriptive Statistics: Measures of Dispersion
- 11.1 Introduction
- 11.2 Measures of Dispersion
- 11.3 Properties of a Good Measure of Dispersion
- 11.4 Methods of Measuring Dispersion
- 11.5 Empirical Rule
- 11.6 Empirical Relationship Between Measures of Dispersion
- 11.7 Chebyshev’s Theorem
- 11.8 Measures of Shape
- 11.9 The Five-Number Summary
- 11.10 Box-and-Whisker Plots
- 11.11 Measures of Association
- Summary
- Key Terms
- Discussion Questions
- Numerical Problems
- Case Study
- 12 Statistical Inference: Hypothesis Testing for Single Populations
- 12.1 Introduction
- 12.2 Introduction to Hypothesis Testing
- 12.3 Hypothesis Testing Procedure
- 12.4 Two-Tailed and One-Tailed Tests of Hypothesis
- 12.5 Type I and Type II Errors
- 12.6 Hypothesis Testing for a Single Population Mean Using the z Statistic
- 12.7 Hypothesis Testing for a Single Population Mean Using the t Statistic (Case of a Small Random Sample When n < 30)
- 12.8 Hypothesis Testing for a Population Proportion
- Summary
- Key Terms
- Discussion Questions
- Numerical Problems
- Case Study
- 13 Statistical Inference: Hypothesis Testing for Two Populations
- 13.1 Introduction
- 13.2 Hypothesis Testing for the Difference Between Two Population Means Using the z Statistic
- 13.3 Hypothesis Testing for the Difference Between Two Population Means Using the t Statistic (Case of a Small Random Sample, n1, n2 < 30, When Population Standard Deviation is Unknown)
- 13.4 Statistical Inference About the Difference Between the Means of Two Related Populations (Matched Samples)
- 13.5 Hypothesis Testing for the Difference in Two Population Proportions
- 13.6 Hypothesis Testing About Two Population Variances (F Distribution)
- Summary
- Key Terms
- Discussion Questions
- Numerical Problems
- Case Study
- 14 Analysis of Variance and Experimental Designs
- 15 Hypothesis Testing for Categorical Data (Chi-Square Test)
- 16 Correlation and Simple Linear Regression Analysis
- 16.1 Measures of Association
- 16.2 Introduction to Simple Linear Regression
- 16.3 Determining the Equation of a Regression Line
- 16.4 Using MS Excel for Simple Linear Regression
- 16.5 Using Minitab for Simple Linear Regression
- 16.6 Using SPSS for Simple Linear Regression
- 16.7 Measures of Variation
- 16.8 Statistical Inference About Slope, Correlation Coefficient of the Regression Model, and Testing the Overall Model
- Summary
- Key Terms
- Discussion Questions
- Numerical Problems
- Case Study
- 17 Multivariate Analysis I: Multiple Regression Analysis
- 17.1 Introduction
- 17.2 The Multiple Regression Model
- 17.3 Multiple Regression Model with Two Independent Variables
- 17.4 Determination of Coefficient of Multiple Determination (R2), Adjusted R2, and Standard Error of the Estimate
- 17.5 Statistical Significance Test for the Regression Model and the Coefficient of Regression
- 17.6 Indicator (Dummy Variable Model)
- 17.7 Collinearity
- Summary
- Key Terms
- Discussion Questions
- Numerical Problems
- Case Study
- 18 Multivariate Analysis lI: Discriminant Analysis and Conjoint Analysis
- 19 Multivariate Analysis III: Factor Analysis, Cluster Analysis, Multidimensional Scaling and Correspondence Analysis
- 20 Sales Forecasting
- 20.1 Introduction
- 20.2 Types of Forecasting Methods
- 20.3 Qualitative Methods of Forecasting
- 20.4 Time Series Analysis
- 20.5 Components of Time Series
- 20.6 Time Series Decomposition Models
- 20.7 The Measurement of Errors in Forecasting
- 20.8 Quantitative Methods of Forecasting
- 20.9 Freehand Method
- 20.10 Smoothing Techniques
- 20.11 Exponential Smoothing Method
- 20.12 Double Exponential Smoothing
- 20.13 Regression Trend Analysis
- 20.14 Seasonal Variation
- 20.15 Solving Problems Involving all Four Components of Time Series
- 20.16 Autocorrelation and Autoregression
- Summary
- Key Terms
- Discussion Questions
- Numerical Problems
- Case Study
- 10 Descriptive Statistics: Measures of Central Tendency
- V Result Presentation
- VI Applications of Marketing Research
- Appendix
Appendix
TABLE A.1 Random numbers


Source: Partially extracted from The RAND Corporation, A Million Random Digits with 100,000 Normal Deviates (Glencoe, IL, The Free Press, 1955).
TABLE A.2 Areas of the standard normal distribution
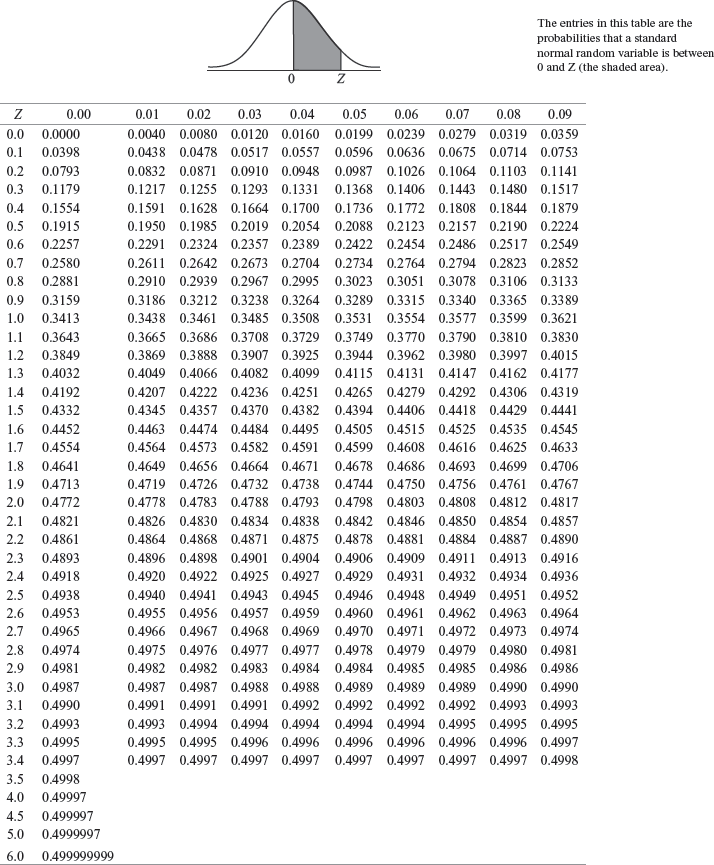
TABLE A.3 Critical values from the t distribution

TABLE A.4 Percentage points of the F distribution


TABLE A.5 The Chi-Square table

TABLE A.6 Critical values for the Durbin–Watson test

-
No Comment
..................Content has been hidden....................
You can't read the all page of ebook, please click here login for view all page.