
The art of debugging is as important as the art of programming. We usually write code that we think is going to work as soon as we execute it, but this is not true sometimes. We write the code, then we get an exception or JavaScript error, and then we need to dive into the code again to see where we went wrong. It's part of being a developer and it is also part of life!
Throughout this book, you learned that debugging is important, especially when we were learning an easier way to figure out the correct Component Query selector. When developing applications with Ext JS, it is mandatory to use a debug tool. This is so because it is not only for debugging, but you will also be able to learn more about the framework, and it is a great learning exercise.
A few things we always need to remind ourselves of while creating Ext JS applications: case-sensitive matters—the LoginScreen class is different from Loginscreen. Be careful with reserved words (http://mattsnider.com/reserved-words-in-javascript/)—you cannot use them as namespaces, names of classes and packages, or as variable names. Check the spelling; this is very important—sometimes when we are typing, we can type an extra character (fat finger syndrome).
If you have programmed in JavaScript for almost 10 years now, you will know that before, our only friend was the dear alert prompt. We used to put several alerts on the code, execute it, and then see which alert was not executed so that we could find where the error was. Now we have our dear friend console. Abuse the use of console for log, warn, and error!
We also have great tools to debug! The two most important are Google Developer Tools and Firebug for Firefox! Learn to use at least one of them (they are very similar).
For example, let's use Google Developer Tools. It comes with a few tabs; on the Network tab, we can see the files that were loaded as follows:

And speaking of files that are being loaded or not, this is a very huge deal! Simple mistakes, such as the name of the class (using MVC), path of CSS, and JS on the index.html file, can be verified using the Console or the Network tab. This tab is also very important as in some chapters we verified the parameters that were being sent to the server. Even though it might be the first time we are working with an Ext JS component, and we do not know how to handle the data that will be sent to the server, we can take a look at the parameters of the request in the Network tab, and then it is easier to read the correct parameters in the server. The same applies when we receive any information from the server, for example, check whether the JSON is coming as per Ext JS expectations.
On the Elements tab, we can see details; the HTML code that was generated by the Ext JS code and also the CSS that is being applied to the components. This is very useful when we want to apply some custom CSS and debug why the style was not applied.

When we move the mouse over, the portion related to that HTML is highlighted on the screen. We also have the CSS and Script tabs. We can change the CSS and script in real time and see the changes applied in real time! This is simply amazing! So, it is very important to learn how to use a debug tool.
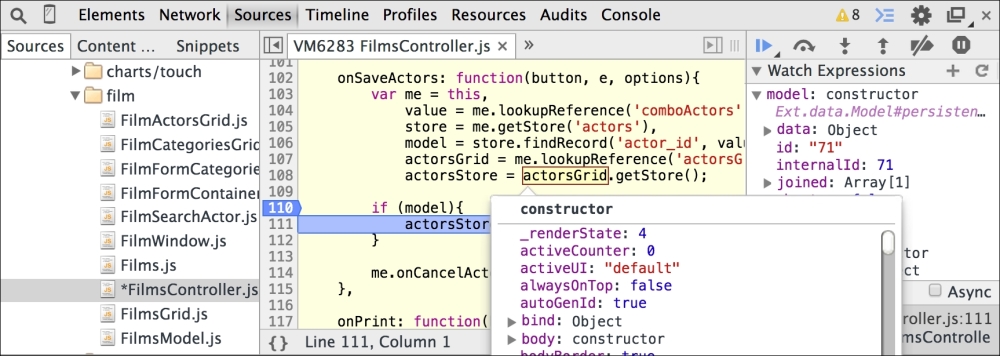
In the Sources tab, we can take the source code that was loaded in the form of the project's structure. This tab is very important for us because it allows us to use the debugging capabilities of the browser to debug our code. The debugging technique is very similar to what is used with server-side languages; we add a breakpoint, execute the code, and then watch and inspect variable values and see what happens in every line of the source code, as follows:
Note
To learn more about Firebug, please visit http://getfirebug.com/. And to learn more about Google Developer Tools, please visit: https://developers.google.com/chrome-developer-tools/ and https://developer.chrome.com/extensions/tut_debugging.
And, of course, there are the special add-ons we talked about in Chapter 7, Static Data Management: Sencha add-on for Chrome and Illumination for developers for Firebug.
Mastering one debugging tool is important as mastering the art of programming in Ext JS. After all, we don't know if we will have the opportunity to work on a project from scratch or we will need to maintain other developers' code. In this case, knowing how to debug is a must-have skill! Choose your favorite weapon and have fun coding and debugging!