Chapter 4
Another Visit with the Financial Planner
Bob has been thinking about the best way to explain the result spreadsheet to Jane and June after their questions the previous day. He has decided to go through it line by line starting at the top, because the assets in the top part are where the withdrawals in the bottom part actually come from. So, he starts up the program and reloads the results with the automatic death date calculation.
Year Numbers
Bob begins, “Let’s start at the top, with the year numbers. As you can see, there isn’t room for all the years on the display at once, so the program shows the number of years that will fit. You can use the slider to look at different years.” (See Figure 4.1.)

“Of course, the rest of the rows on the spreadsheet follow along with the slider, too, so that you are always looking at the data for the years listed on the top. Here’s what it looks like when we move the slider so that the first year displayed is 2033.” (See Figure 4.2.)

June chips in, “That’s pretty cool. By the way, this program looks like it was a lot of work to write. Did you write it yourself?”
Bob answers, “No, I didn’t write it; the programmer put a free version up on his website.”
June replies, “It looks complicated to learn to use.”
Bob answers, “It has a pretty good instruction manual and the author responds to questions.”
June says, “Well, I had no idea we could get this kind of detail and so many options. Anyway, sorry for the interruption. Let’s get back to what all the rows mean on the spreadsheet.”
Cash
Bob says, “Sure. The next line, ‘Cash,’ is the simplest one. It represents the total amount of cash held by both spouses at the beginning of each year. In your case, we have just lumped all the cash into your account rather than dividing it up between your account and Jim’s, which is simpler and doesn’t make any difference in the results.” (See Figure 4.3.)

He continues, “The main reason cash is split out from the other assets is because cash tends to have different (usually lower) rates of return than assets like stocks and bonds. So the ‘Assumptions’ tab has a separate entry for the assumed rate of return of cash.” Bob moves the slider back to start at the beginning, 2017, and clicks on the “Assumptions” tab. (See Figure 4.4.)

Nominal vs. Real Return
Jane says, “Why does it say ‘Nominal’ return?”
Bob replies, “Nominal return is the return before inflation. Over a long period of time, inflation causes the dollar to lose a lot of its value, so we have to adjust the amount of spending according to our estimate of inflation, which right now is set to 2.0%. So, if you are making any projections of income and spending for long periods of time, as this program needs to do, it has to account for inflation. There are two main ways to do that: either you can show all the results in ‘constant dollars,’ that is, with inflation removed, or you can show all the results in ‘current dollars,’ that is, with inflation included. What you don’t want to do is to mix current dollars and constant dollars, because that doesn’t make sense.”
“This tool shows everything in ‘current dollars,’ which lose value over time. That’s why the ‘Cash After Tax & Ins’ line at the bottom increases over time to compensate for inflation, rather than being constant. We’ll get back to that later in more detail, by the way, but it’s relevant here because we are discussing the inflation adjustment.” (See Figure 4.5.)

Bob continues, “Does that make sense now?”
Jane answers, “Yes. I seem to recall that you also explained why the entries for 2018 and 2020 have much higher numbers in that ‘Cash After Tax & Ins’ row. That’s because I told you that we were going to be spending extra money in those years, right?”
Bob replies, “Yes, that’s why. That information is in the ‘Expected Additional Expenses’ tab. Here is that tab again.” (See Figure 4.6.)

Jane says, “Yes, I remember that. I assume that if we change our minds about those extra expenses, you can run the program again to see how that affects the results. Is that right?”
The Need for an Annual Review
“In fact, it’s one of several reasons that this program should be run at least once a year.”
“First, of course, the tax calculations change, even if just because of inflation, which increases tax brackets, standard deductions, and a number of other parts of the calculation almost every year. And, of course, once in a while there are changes in the tax laws themselves. But either way, the projections will be more realistic if we run the latest version of the program, which is updated according to the latest tax information available.”
“Another reason to rerun the simulations at least once a year is that the results will be different because both of you have survived another year. For example, suppose we run it next year (2018). Obviously, the ‘worst-case scenario’ can no longer be that one of you dies in 2017, because that didn’t happen. That means that the calculations don’t have to consider that possibility.”
“As you just suggested, you may also make changes in your spending plans, like not taking that vacation or buying the new car, which will affect the sustainable spending level.”
“And of course, I don’t have to explain that if one of you does die, then the results will be much different, if only because there will be only one Social Security payment and possibly an insurance payout.”
June contributes her thoughts: “Yes, that makes sense. Can you put it on your calendar to call both of us early next year so we can update the results?”
Bob says, “Sure. I’ll do that right now.” He enters a note in his reminder program to call them, then continues, “Does either of you have any more questions about the ‘Cash’ row, or the assumptions?”
Jane and June both shake their heads “no.”
Traditional Retirement Account Assets
Bob says, “The next row is the one labeled ‘TRA Assets.’ This is the total amount that both spouses have in their traditional (pretax) retirement accounts at the beginning of each year.” (See Figure 4.7.)
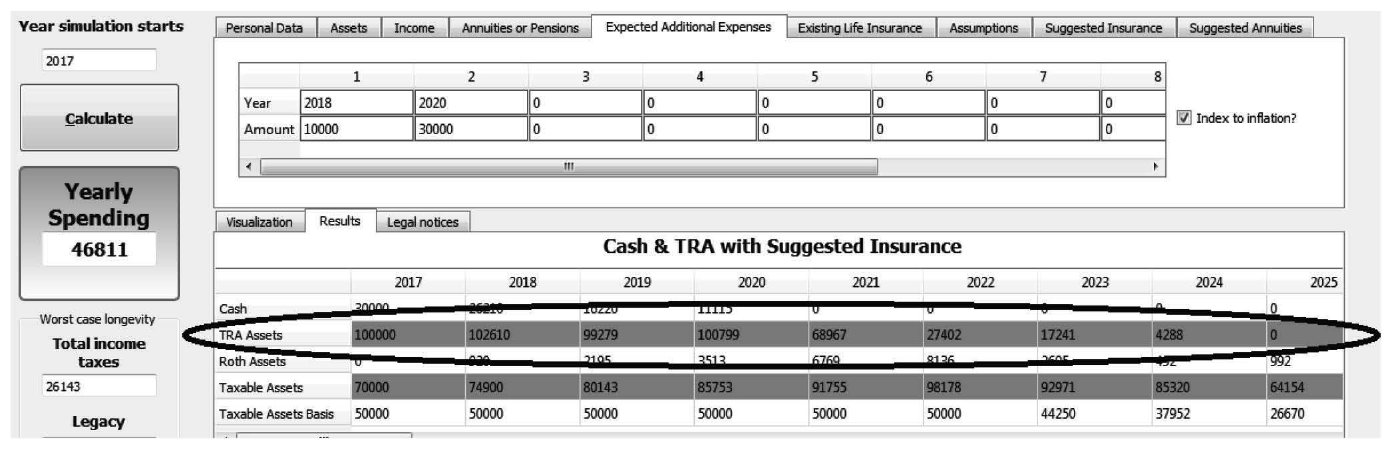
Bob continues, “These have to be kept track of separately from other types of accounts because taking money out of them incurs income taxes. Withdrawals of certain amounts, called ‘Required Minimum Distributions,’ or RMDs, also must start by age 70.5. The program includes the necessity of taking RMDs when calculating how much money you can spend every year.”
Withdrawal Strategies to Optimize Taxes
“However, there’s a feature of the program that I’ve blown right past so far: the determination of which accounts to take money out of in which order.
“These methods are what the labels on the ‘various withdrawal strategy’ bars on the ‘Visualization’ page refer to.” (See Figure 4.8.)

Bob continues, “As you can see, this screen shows the results of four withdrawal strategies for the situation where you don’t have any life insurance (on the left) and the results of the same four withdrawal strategies for the situation where you buy the suggested life insurance (on the right). In your case, as the position of the ‘Best’ button indicates, the ‘Cash & TRA’ strategy with ‘Suggested Insurance’ is the best strategy overall. This means that your best sustainable spending rate would be achieved if you were to buy the suggested life insurance and use your cash and your traditional retirement accounts first, before spending down your other assets (which in your case is just your taxable account balance). Of course, this assumes that the assumptions we have made are accurate.”
Four Different Withdrawal Strategies
“I should also explain what the four different strategies mean. ‘Taxable and Cash’ means that withdrawals will be made from both the taxable account and the cash account until they are exhausted, then the other accounts will be used. ‘Taxable’ means that withdrawals will be made from the taxable account alone until it is exhausted, then the other accounts will be used. ‘Taxable and TRA’ and ‘Cash and TRA’ are similar to ‘Taxable and Cash’ except for which two accounts will be used first.”
“The program tries to maximize sustainable spending using all four of these strategies with both existing and suggested insurance, and displays the ‘Best’ button below the result that has the highest sustainable spending.”
“This was actually the original idea for the program: looking for the best way to take money out of various types of accounts during retirement. Have you ever noticed that although just about every retirement-advice article tells you to take distributions from your accounts in a ‘tax-efficient manner,’ they never tell you how to figure that out? So, the programmer decided to write a program to try a number of different methods of taking money out, to see which way led to the highest sustainable spending rate.”12
“Does that make sense?”
June replies, “I recall your briefly mentioning that to me when we went over my results, but I didn’t know exactly how the calculation was done. Thanks for the extra explanation.”
Other Ways to Improve Sustainable Spending
Jane says, “I think I understand it, but if that was the original idea for the program, why does it have all the other features like Social Security optimization and adding term insurance? Wasn’t the original idea good enough? Assuming you know the answer, of course.”
Bob replies, “Yes, that is covered in the training for the program. What happened was that the programmer found that the difference in after-tax sustainable spending results, just from taking the money out of the various accounts in the correct order, was noticeable but not enormous. In your case, for example, it’s about $1,000 a year, as you can see by comparing the lowest and highest numbers in the ‘With Existing Insurance’ area.”
Assuming the same return on all the different accounts13, the reason for the difference in after-tax sustainable spending between one withdrawal method and another is the difference in the tax treatment of money taken out of different accounts. This effect will be different based on your exact situation. For example, if your taxable account has a cost basis higher than its current value, you will have losses when you liquidate that account, offsetting some taxable income. On the other hand, if your taxable account has a cost basis lower than its current value, you will have to pay some capital gains taxes as you liquidate it. The program takes these effects into account when calculating the results of the different withdrawal strategies. For example, let’s look at the ‘Taxable & TRA’ and ‘Cash & TRA’ results for your existing insurance. (See Figure 4.9.)

Significant Improvements in Sustainable Spending by Adding Insurance
Bob continues, “I know the exact numbers are a bit hard to see on this graph, but that’s because it has to represent the much bigger difference between the ‘With Existing Insurance’ and ‘With Suggested Insurance’ results, so the display of the much smaller difference among the results within those two groups gets compressed. But we can see the exact difference by clicking the button for the ‘Taxable & TRA,’ then for the ‘Cash & TRA’ results and noting how much the ‘Yearly Spending’ value changes. First, here’s the ‘Taxable & TRA with Existing Insurance’ result, which shows the ‘Yearly Spending’ as $31,599.” (See Figure 4.10.)

Bob continues, “And now here’s the result for ‘Cash & TRA with Existing Insurance,’ which shows the ‘Yearly Spending’ as $32,443.” (See Figure 4.11.)

Bob continues, “The difference is a little more than $800 a year, which is nice but not exactly life-changing. So the programmer decided to add some more financial data to see what happened. He was amazed to find that adding term life insurance could make a far larger difference in sustainable spending than just trying to optimize the withdrawals to reduce taxes. It’s also much less time-consuming to calculate than searching for the maximum possible improvement in withdrawal methods, so he decided to concentrate on that and the other more powerful optimizations like Social Security timing and annuities (which we’ll get to later).”
“Does that answer your question? If so, we can continue with the next row on the spreadsheet.”
Jane replies, “Yes, that makes sense now. Go ahead.”
Roth Assets
Bob continues, “First, let’s switch back to the best result, ‘Cash and TRA with Suggested Insurance.’ Then, the next row is ‘Roth Assets.’ This is the total amount that both spouses have in their Roth (post-tax) retirement accounts at the beginning of each year.” (See Figure 4.12.)

Jane says, “We don’t have any Roth assets at present, so I see why it starts out as 0. But why does it show them starting in 2018?” (See Figure 4.13.)

Bob replies, “That’s because what the program is trying to do is to make the ‘Cash After Tax & Ins’ as level as possible in ‘real dollars’ after accounting for the ‘Expected Additional Expenses’. This means that sometimes it has to cash in more of your assets than it needs in one year. When this happens, it puts the extra back into a Roth account, because that has the most favorable tax treatment when you take the money out.”14
Jane says, “OK, I guess so, but I don’t see the ‘Cash After Tax & Ins’ row being very level. All the numbers are different.”
Bob replies, “That’s because of inflation. A dollar now is worth less than a dollar some years from now, so the program increases spending later to make that come out even. But I know it’s hard to see the leveling out of spending this way.”
“Let’s change the inflation rate to 0 and rerun the program, and you’ll see that the ‘Cash After Tax & Ins’ row shows level spending, other than the bumps in 2018 and 2020 for your ‘Expected Additional Expenses.’” (See Figure 4.14.)

Jane says, “Yes, now I see it is level. Go ahead with the other rows.”
Bob continues, “OK, first I’ll set the inflation back to 2% and hit the ‘Calculate’ button again.”
Taxable Assets
“The next row is ‘Taxable Assets,’ which is what it sounds like: the total amount that both spouses have in their taxable account or accounts.” (See Figure 4.15.)

Jane says, “I see that it keeps going up until 2022, then starts down. Is that because we are seeing the ‘Cash and TRA with Suggested Insurance’ result?”
Bob answers, “Yes, exactly. The program has calculated that taking money from cash and your traditional retirement accounts produces the highest ‘Yearly Spending,’ so it exhausts those accounts first.”
Jane says, “OK, got it.”
Taxable Assets Basis
“What about the next row, ‘Taxable Assets Basis’? What is that for?”
Bob replies, “That shows your ‘cost basis’ (how much you paid) for the assets you have in your taxable account at the beginning of each year, which is deducted from the sale price when calculating capital-gains taxes. I’ve also switched back to the ‘Assets’ tab so you can see where the original figure comes from.” (See Figure 4.16.)

Bob continues, “You can see that your original ‘Tax Basis’ is $50,000, meaning that you paid that much for the assets in your taxable account. As you can see in the ‘Taxable Assets Basis’ row, this goes down whenever you sell assets, because you have less left in the taxable account.”
“The reason we need to keep track of this is because it affects how much you have to pay in capital-gains taxes. Basically, whenever you sell a taxable asset, you subtract the basis from the sale price to figure your gain; then the capital-gain tax is assessed on that gain. For example, in 2022, the program shows ‘Taxable Sold’ of $12,079 worth of taxable assets, with a ‘Sale Basis’ of $5,749, producing a ‘LTCG’ (long-term capital gain) of (approximately) $6,330.” (See Figure 4.17.)

Bob continues, “By the way, the reason that ‘Taxable Sold’ is negative is because it is a sale, which reduces the amount you have in your ‘Taxable Assets.’ ‘Sale Basis’ and ‘LTCG’ (long-term capital gains) don’t affect how much you have in assets, just your tax liability, so they aren’t displayed as negative. Does that explain what the taxable basis means?”
Jane says, “I get the general idea, but my tax program does all these calculations for me, so I don’t have to understand the details when it does my taxes. Is that OK here, too?”
Estimating Taxes vs. Precise Tax Calculations
Bob answers, “Yes, absolutely. Remember that this is a retirement estimating program, so you can’t count on its calculating the taxes precisely. That’s what your tax preparation program (or your tax preparer) is for. The tax calculations in this program are used just to estimate how much you will have to take out of savings each year; there is no way to know exactly what tax brackets are going to be even next year, much less 30 years in the future, even if we assume that tax laws aren’t going to change in all that time.
“Of course, no one else knows that either, so that’s not a weakness of this program compared to any other program that tries to estimate future taxes; they are all in the same position.”
“I’ll bet you are ready to knock off for the day, right? This is a lot of information to absorb in one session.”
Jane and June both nod, so Bob says “OK, how about if we get together tomorrow and go over the middle rows in the spreadsheet, the income sources?”
Jane looks at June, who says, “I’m in. We are going to be retired for a long time, and you don’t get two chances at planning retirement.”
Jane adds, “Yes, I agree. Most people spend more time deciding which car to buy than they do on one of the biggest decisions in their lives. I don’t want to make that mistake.”
Bob says, “OK, how about 1 PM tomorrow, back here?”
They nod, so he shuts down the program and closes up his laptop.