Appendix B
Reference Manual for the GUI for the Rhino
Retirement Analyzer v1.0, Expert Mode
The Expert mode of the Rhino Retirement Analyzer provides a number of options that are useful in exploring alternatives to the results calculated by the automated features. For example, after calculating the worst-case scenario for death dates of the two spouses, clients often ask how things would turn out if those death dates were different. The Expert mode allows you to specify different death years and see how those scenarios would play out. Similarly, you can show your client what could happen if they spent more (or less) than what the program calculates as their sustainable spending rate.
This appendix describes the Expert mode features in detail.
The Expert Mode Checkbox
Figure B.1 shows the location of the Expert Mode checkbox on the right side of the screen.

The first Expert Mode option is Tax Verification. (See Figure B.2)
Tax Verification

Definition: Causes tax brackets and other quantities that are normally inflation-adjusted to remain at the original values
Use in program: Allows comparison of tax calculations with the results of tax-preparation programs
The results of tax preparation programs apply only to the year for which they are published, e.g., the “2015 filing year edition” of a tax preparation program will use the tax brackets, deductions, exemptions, and so on that were in effect for 2015. This is what such programs are intended for, so the results are perfectly appropriate for these programs.
Rhino also contains official IRS tax brackets, deductions, and so on for a particular (“base”) year, but in addition, it needs to calculate estimates for future tax liabilities. This requires adjusting these values according to projected inflation, so that its tax calculations will correspond to the results that would be obtained in each future year according to that projected inflation rate.
But in order to see whether Rhino’s tax estimates are close to the results of a tax preparation program, we need to suppress these inflation effects so that Rhino will calculate taxes as though every year had the same brackets, deductions, and so on as the base year. This is the main purpose of the Tax Verification checkbox and its associated Expert Mode tab, the Tax Test tab. (See Figure B.3)62

Let’s take a look at an example. First, Figure B.4 shows the Income tab for a couple who have a combined salary income of $125,000 and an income from qualified dividends of $1,000.

Now let’s go back to the Tax tab and enter those values for salary and qualified dividend income, along with the $1,300 interest income that they would receive on their $65,000 in cash at a 2% interest rate, then push the Run Test button. (See Figure B.5)
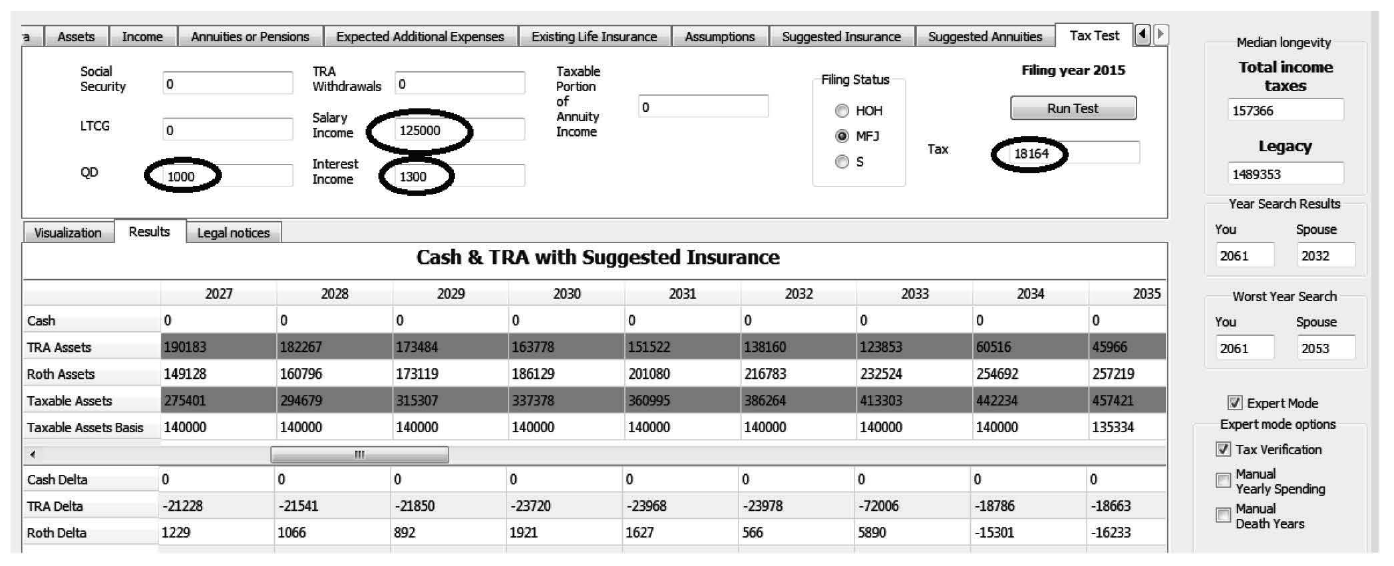
As you can see, the tax test feature estimates the federal income tax as $18,164. How does this compare with the results of a tax preparation program for the same filing year (2015), given the same inputs? (See Figure B.6)

The Rhino tax calculator is $1 off from the tax preparation program’s results. That is certainly close enough for projections 30 years or more into the future, when we will be very fortunate to have the outcomes match our projections within 10%!
The next expert mode feature is Manual Yearly Spending. (See Figure B.7)
Manual Yearly Spending

As we have already seen, the Rhino Retirement Analyzer, in its basic mode, calculates the maximum sustainable spending level automatically. However, the client often wishes to know what would happen in the event that he or she spent more (or less) than the automatically determined maximum sustainable spending level. Another use for this option is to illustrate what would happen if the assumptions are too generous (or too stingy). We will take a look at both of these uses for this option as soon as we discuss the effects on the GUI of turning the option on.
First, let us look at the change in the graphical user interface as a result of clicking the Manual Yearly Spending checkbox. (See Figure B.8)
The Asset Depletion Box

The only change to the GUI caused by checking the Manual Yearly Spending checkbox is that the Asset Depletion box is now visible in the lower left of the screen. The first field in that box is Year depleted. (See Figure B.9)
Year Depleted

Year depleted, as the name suggests, indicates the year when remaining assets will be insufficient to continue the sustainable Yearly Spending amount previously calculated. Until you change the Yearly Spending from the automatically calculated value, the year shown in Year depleted will be the last year that either of the spouses is alive, as shown in the Figure. That is because the sustainable Yearly Spending amount is calculated to use up the assets in the year of the later death.
The other value in the Asset Depletion box is Continuing income, which is the amount of income that will continue after the assets are depleted. In this case that figure is $90,189 per year. (See Figure B.10)
Continuing Income

Increasing Yearly Spending
The first use of setting manual yearly spending amounts is to see what would happen with higher yearly spending. Obviously, higher yearly spending amounts will cause asset depletion to occur more rapidly, but the question is how much more rapidly. For example, if we increase Yearly Spending to $80,000, the result might look like Figure B.11.

Checking the Results of More Conservative Return Assumptions
Another use of the manual yearly spending feature is to see what would happen if we spent the amount that was projected using more aggressive assumptions on returns and inflation, but the actual results for returns and inflation are less favorable. For example, let’s suppose that we estimate sustainable spending using inflation of 2%, cash returns of 2%, and asset returns of 7%, as shown in Figure B.12.

Now let’s set the Inflation, Portfolio Assets Nominal Return, and Cash Nominal Return assumptions to 0%, click the Manual Yearly Spending checkbox, then click the Calculate button. The result will look like Figure B.13.

The next expert mode feature is Manual Death Years. (See Figure B.14)
Manual Death Years

As we have already seen, the Rhino Retirement Analyzer, in its basic mode, calculates the maximum sustainable spending level, assuming that both spouses die at times that put the maximum strain on their assets. However, the client often wishes to know what would happen in the event that they die at different times than those worst possible times. This option allows the user to illustrate results with different death dates.
First, let’s look at the change in the graphical user interface as a result of clicking the Manual Death Years checkbox. (See Figure B.15)

The changes in the GUI are that the median longevity and worst-case longevity boxes are no longer visible, because they are irrelevant when you are specifying death years manually, and as with the Manual Yearly Spending option, the Asset Depletion box is shown.
Now let’s see what happens if we specify different death years from those selected by the program, which in this case are 2061 for the client and 2032 for the spouse. Probably the most common use of this option will be to answer the question “What if we both live to our median lifespans?”, so those are the years we will choose. (See Figure B.16)
Checking the Results of Manually Specified Death Years

Note that the sustainable yearly spending would be about $10,000 higher if we knew that both spouses would die at the median lifespan. Of course, it is to be expected that sustainable yearly spending would be higher if the spouses did not die at the worst possible time, but it is convenient to be able to investigate the magnitude of the difference.
Also note that the Asset Depletion box shows the later of the two years of death, as we have told the program to use up all the assets by that year. (See Figure B.17)
Assets Depleted in the Later of the Two Death Years

Also note that it is possible to combine manual yearly spending and manual death years, if you have a need to do so.