0-9
1-10-100 rule – See cost of quality.
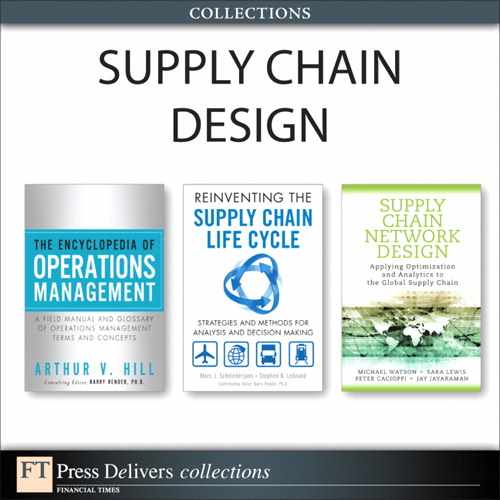
3Ds – The idea that an evaluation of a potential automation project should consider automating tasks that are dirty, dangerous, or dull.
The picture at the right is the PackBot EOD robot from the iRobot Corporation designed to assist bomb squads with explosive ordinance disposal. This is a good example of the second “D.”
See automation.
3Gs – A lean management practice based on the three Japanese words gemba, genbutsu, and genjitsu, which translate into “actual place,” “actual thing,” and “actual situation” or “real data.”
• Gemba (or genba) – The actual place where work takes place and value is created.
• Gembutsu (or genbutsu) – The actual things (physical items) in the gemba, such as tools, machines, materials, and defects.
• Genjitsu (or jujitsu) – The real data and facts that describe the situation.
In Japanese, Genchi Gembutsu ![]() means to “go and see” and suggests that the only way to understand a situation is to go to the gemba, which is the place where work is done.
means to “go and see” and suggests that the only way to understand a situation is to go to the gemba, which is the place where work is done.
See gemba, lean thinking, management by walking around, waste walk.
3PL – See Third Party Logistics (3PL) provider.
5 Whys – The practice of asking “why” many times to get beyond the symptoms and uncover the root cause (or causes) of a problem.
Here is a simple example:
• Why did the ink-jet label system stop printing? The head clogged with ink.
• Why did the head clog with ink? The compressed air supply had moisture in it.
• Why did the compressed air supply have moisture in it? The desiccant media was saturated.
• Why was the desiccant media saturated? The desiccant was not changed prior to expiration.
• Why was the desiccant not changed prior to expiration? A change procedure does not exist for the compressed air desiccant.
Galley (2008) and Gano (2007) argue persuasively that problems rarely have only one cause and that assuming a problem has only single root cause can prevent investigators from finding the best solution.
The focus of any type of root cause analysis should be on finding and fixing the system of causes for the problem rather than finding someone to blame. In other words, use the 5 Whys rather than the 5 Who’s.
See Business Process Re-engineering (BPR), causal map, error proofing, impact wheel, kaizen workshop, Root Cause Analysis (RCA).
5S – A lean methodology that helps organizations simplify, clean, and sustain a productive work environment. ![]()
The 5S methodology originated in Japan and is based on the simple idea that the foundation of a good production system is a clean and safe work environment. Translated from Japanese words that begin with the letter “S,” the closest English equivalents normally used are Sort, Set in order, Shine, Standardize, and Sustain. The following list is a combination of many variants of the 5S list found in various publications:
• Sort (separate, scrap, sift) – Separate the necessary from the unnecessary and get rid of the unnecessary.
• Set in order (straighten, store, simplify) – Organize the work area (red tag, shadow boards, etc.) and put everything in its place.
• Shine (scrub, sweep) – Sweep, wash, clean, and shine everything around the work area.
• Standardize – Use standard methods to maintain the work area at a high level so it is easy to keep everything clean for a constant state of readiness.
• Sustain (systematize, self-discipline) – Ensure that all 5S policies are followed through the entire organization by means of empowerment, commitment, and accountability.
Some lean practitioners add a sixth “S” for Safety. They use this “S” to establish safety procedures in and around the process. However, most organizations include safety as a normal part of the set in order step.
The benefits of a 5S program include reduced waste and improved visibility of problems, safety, morale, productivity, quality, maintenance, leadtimes, impression on customers, and sense of ownership of the workspace. More fundamentally, a 5S program can help the firm develop a new sense of discipline and order that carries over to all activities.
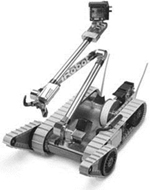
Five stages of understanding the benefits of a 5S program
Source: Professor Arthur V. Hill
Awareness of the benefits of a 5S program goes through five stages, as depicted in the figure below.
• Stage 1: Clean – People tend to assume initially that 5S is just cleaning up the work area. Cleaning a work area is a good practice, but this is only the beginning of 5S. (Some students joke that 5S is just “Mom telling me to clean up my room.”)
• Stage 2: Standard – People understand that 5S is about making this clean work process more standard. This makes it easy to find things because everything is always in the same place.
• Stage 3: Improved – People begin to understand that 5S is about continually improving how work is done. 5S challenges people to always be looking for better ways to organize their work areas, to make the work simple, visible, error-proof, and wasteless.
• Stage 4: Visible – People understand that 5S is about making work more visible so workers can focus on their work and so anything out of place “screams” for immediate attention. A visual work area provides cues that help workers and supervisors know the current status of the system and quickly identify if anything needs immediate attention.
• Stage 5: Disciplined – People wholeheartedly embrace the 5S disciplined mindset for how work is done and apply the discipline to everything they do.
Some practical implementation guidelines for a 5S program include:
• Take pictures before and after to document and encourage improvement.
• Practice the old slogan, “A place for everything and everything in its place.”
• Place tools and instruction manuals close to the point of use.
• Design storage areas with a wide entrance and a shallow depth.
• Lay out the storage area along the wall to save space.
• Place items where they are easy to see and access.
• Store similar items together and different items in separate rows.
• Do not stack items together. Use racks or shelves when possible.
• Use small bins to organize small items.
• Use color for quickly identifying items.
• Clearly label items and storage areas to improve visibility.
• Use see-through/transparent covers and doors for visibility.
• Remove unnecessary doors, walls, and other barriers to visibility, movement, and travel.
• Use carts to organize, move, and store tools, jigs, and measuring devices.
The Japanese characters for 5S are on the right (source: http://net1.ist.psu.edu/chu/wcm/5s/5s.htm, November 7, 2004).
See 8 wastes, facility layout, kaizen workshop, lean thinking, multiplication principle, point of use, red tag, shadow board, standardized work, Total Productive Maintenance (TPM), visual control.
6Ps – The acronym for “Prior Planning Prevents Painfully Poor Performance,” which emphasizes the need for planning ahead.
Wikipedia’s 7Ps entry includes several other variants. Apparently, the phase originated in the British Army, but is also popular in the U.S. Army1. The U.S. Army replaces the word “painfully” with a coarse word.
One somewhat humorous way to write this expression is as ![]() .
.
See personal operations management, project management.
7 wastes – See 8 wastes.
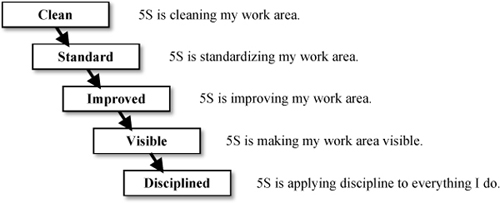
7S Model – A framework developed by McKinsey to help organizations evaluate and improve performance.
The McKinsey 7S Model (Waterman, Peters, & Phillips 1980) can be used to help organizations evaluate and improve their performance. The elements of the 7S Model (with simplified explanations) are as follows:
• Strategy – How to gain competitive advantage.
The McKinsey 7S Model
• Structure – How the organization’s units are interrelated. Options include centralized, functional (top-down), de-centralized, matrix, network, or holding.
• Systems – The procedures and processes that define how the work is done.
• Staff – The employees and their attributes.
• Style – The type of leadership practiced.
• Skills – The employee capabilities.
• Shared values – The organization’s beliefs and attitudes. This is the center of McKinsey’s model and is often presented first in the list.
These seven elements need to be aligned for an organization to perform well. The model can be used to help identify which elements need to be realigned to improve performance. The hard elements (strategy, structure, and systems) are easy to define and can be influenced directly by management. The soft elements (skills, style, staff, and shared values) are less tangible and harder to define, but are just as important as the hard elements.
See operations strategy.
8 wastes – Seven original forms of waste identified by Taiichi Ohno, plus one widely used in North America. ![]()
Taiichi Ohno, the father of the Toyota Production System, defined seven categories of waste (Ohno 1978). Waste (“muda”) includes any activity that does not add value to the customer. More recently, Bodek (2009) defined the eighth waste and called it “underutilized talents of workers.” Liker (2004) used the similar phrase “unused employee creativity.” Most sources now label this “waste of human potential.” The 8 wastes include:
1. Overproduction – Producing more than what is needed or before it is needed.
2. Waiting – Any time spent waiting for tools, parts, raw material, packaging, inspection, repair, etc.
3. Transportation – Any transportation of parts, finished goods, raw materials, packaging, etc. Waste is particularly apparent here when materials are moved into and out of storage or are handled more than once.
4. Excess processing – Doing more work than necessary (e.g., providing higher quality than needed, performing unneeded operations, or watching a machine run).
5. Inventory – Maintaining excess inventory of raw materials, in-process parts, or finished goods.
6. Excessive motion – Any wasted motion or poor ergonomics, especially when picking up or stacking parts, walking to look for items, or walking to look for people.
7. Defects (correction) – Repair, rework, recounts, re-packing, and any other situation where the work is not done right the first time.
8. Unused human potential – Unused employee minds and creativity.
One of the best approaches for eliminating these wastes is to implement a 5S program. The lean thinking entry also suggests many specific approaches for eliminating each of these wastes.
Macomber and Howell (2004) identified several additional wastes, including too much information, complexity, design of goods and services that do not meet users’ needs, providing something the customer does not value, not listening, not speaking, assigning people to roles that they are not suited for, not supporting people in their roles, and high turnover.
Many experts distinguish between necessary waste and unnecessary waste (also known as pure waste). Unnecessary waste is any activity that adds no direct value to the customer, to the team making the product, or to other activities that add direct value to the customer. In contrast, necessary waste is any activity that does not add value directly to the customer, but is still necessary for the team or for another step that does add value. Necessary waste supports the best process known at the current time, but will ideally be eliminated sometime in the future. Examples of necessary waste might include planning meetings and preventive maintenance.
See 5S, efficiency, Lean Enterprise Institute (LEI), lean thinking, muda, overproduction, rework, subtraction principle, waste walk.
80-20 rule – See ABC classification, Pareto’s Law.
A
A3 Report – A lean term for a concise document that combines a project charter and progress report on a single large sheet of paper. ![]()
The A3 Report is named after the A3 paper size used everywhere in the world except for the U.S. The A3 is equivalent to two side-by-side A4 pages and is 297 × 420 mm (about 11 × 17 inches). In the U.S., most organizations use two side-by-side 8.5 × 11 inch pages, which is about the same size as an A3.
Although many types of A3 Reports are used in practice, the A3 is most often used as a combination of a parsimonious project charter, project status report, and project archive. A3 Reports are often organized so it tells a “story,” where the left side is a description and analysis of the current problem and the right side presents countermeasures (solutions) and an implementation plan for the solutions. The A3 Report defines the problem, root causes, and corrective actions and often includes sketches, graphics, simple value stream maps, and other visual descriptions of the current condition and future state. The logical flow from left to right, the short two-page format, and the practice of posting A3s on the wall help develop process thinking and process discipline.
Some lean consultants insist that A3 Reports be done by hand to avoid wasted time in making “pretty” graphs and figures. Although many lean experts in North America insist that A3 problem solving is essential to lean thinking, other lean experts in North America do not use it at all.
See kaizen workshop, lean thinking, project charter, value stream map.
ABAP (Advanced Business Application Programming) – The name of the proprietary object-oriented programming language used by SAP, which is the world’s largest ERP software firm.
See SAP.
ABC – See Activity-Based Costing (ABC).
ABC classification – A method for prioritizing items in an inventory system, where A-items are considered the most important; also called ABC analysis, ABC stratification, distribution by value, 80-20 rule, and Pareto analysis. ![]()
The ABC classification is usually implemented based on the annual dollar volume, which is the product of the annual unit sales and unit cost (the annual cost of goods sold). High annual volume items are classified as A-items and low annual dollar volume items are classified as C-items. Based on Pareto’s Law, the ABC classification system demands more careful management of A-items where these items are ordered more often, counted more often, located closer to the door, and forecasted more carefully.
In contrast, C-items are not as important from an investment point of view and therefore should be ordered and counted less frequently. Some firms classify obsolete or non-moving items as D-items.
One justification for this approach is based on the economic order quantity model. Higher dollar volume items are ordered more often and therefore have a higher transaction volume, which means that they are more likely to have data accuracy problems.
The first step in the ABC analysis is to create a ranked list of items by cost of goods sold (annual dollar volume). The top 20% of the items are labeled A-items. The next 30% of the items in the list are labeled B-items and the remaining 50% are labeled C-items. Of course, these percentages can vary depending upon the needs of the firm. A-items will likely make up roughly 80% of the total annual dollar volume, B-items will likely make up about 15%, and C-items will likely make up about 5%.
A Lorenz Curve is used to graph the ABC distribution, where the x-axis is the percentage of items and the y-axis is the percentage of total annual dollar usage. The graph on the right shows that the first 20% of the items represent about 80% of the annual dollar usage. Items must be first sorted by annual dollar volume to create this graph. See the Lorenz Curve entry for information on how to create this graph.

Some firms use other variables for prioritizing items in the ABC classification such as unit sales, annual sales (instead of cost of goods sold), profit margin, stockout cost (such as medical criticality), shelf life, and cubes (space requirements).
Note that the ABC inventory classification has nothing to do with Activity Based Costing.
See bill of material (BOM), cost of goods sold, cycle counting, Economic Order Quantity (EOQ), inventory management, Lorenz Curve, obsolete inventory, Pareto Chart, Pareto’s Law, warehouse, Warehouse Management System (WMS).
absorption costing – An accounting practice for allocating overhead to measure product and job costs.
With absorption costing, product costs include the direct cost (i.e., labor and materials) and indirect (fixed) costs (e.g., administrative overhead). Overhead costs from each workcenter are assigned to products as they pass through the workcenter. Traditionally, the overhead (indirect) cost is assigned to the product based on the number of direct labor hours. With Activity Based Costing systems, overhead is assigned to products based on cost-drivers, such machine hours, number of orders per year, number of inspections, and product complexity.
Absorption costing is often criticized because it tends to drive operations managers to produce more inventory in order to absorb more overhead. This is contrary to the lean thinking and is only in the best interests of shareholders when capacity is costly and inventory is cheap. Throughput accounting, developed by Goldratt (Noreen, Smith, and Mackey 1995), is a form of variable costing that ignores overhead.
See Activity Based Costing (ABC), cost center, lean thinking, overhead, standard cost, Theory of Constraints (TOC), throughput accounting, variable costing.
absorptive capacity – The ability of an organization to recognize the value of new external information, integrate and assimilate that information, and apply the information to make money.
Absorptive capacity can be examined on multiple levels (an individual, group, firm, and national level), but it is usually studied in the context of a firm. Absorptive capacity can also refer to any type of external information, but is usually applied in the context of research and development (R&D) activities. The theory involves organizational learning, industrial economics, the resource-based view of the firm, and dynamic capabilities. Organizations can build absorptive capacity by conducting R&D projects internally rather than outsourcing them.
The term “absorptive capacity” was first introduced in an article by Cohen and Levinthal (1990). According to the ISI Web of Science, this article has been cited more than 1500 times. This entire article can be found at http://findarticles.com/p/articles/mi_m4035/is_n1_v35/ai_8306388 (May 10, 2010).
Adapted from http://en.wikipedia.org/wiki/Absorptive_capacity and http://economics.about.com/cs/economicsglossary/g/absorptive_cap.htm, May 10, 2010.
See capacity, empowerment, human resources, New Product Development (NPD), organizational design, outsourcing, workforce agility.
Acceptable Quality Level (AQL) – The maximum percentage defective that can be considered satisfactory as a process average.
When deciding whether to accept a batch, a sample of n parts is taken from the batch and a decision is made to accept the batch if the percentage of defects is less than the AQL. The AQL is the highest proportion defective that is considered acceptable as a long-run average for the process.
For example, if 4% nonconforming product is acceptable to both the producer and consumer (i.e., AQL = 4.0), the producer agrees to produce an average of no more than 4% nonconforming product.
See acceptance sampling, consumer’s risk, incoming inspection, Lot Tolerance Percent Defective (LTPD), producer’s risk, quality management, Statistical Process Control (SPC), Statistical Quality Control (SQC), zero defects.
acceptance sampling – Methods used to make accept/reject decisions for each lot (batch) based on inspecting a limited number of units. ![]()
With attribute sampling plans, accept/reject decisions are based on a count of the number of units in the sample that are defective or the number of defects per unit. In contrast, with variable sampling plans, accept/reject decisions are based on measurements. Plans requiring only a single sample set are known as single sampling plans; double, multiple, and sequential sampling plans may require additional samples.
For example, an attribute single sampling plan with a sample size n = 50 and an accept number a = 1 requires that a sample of 50 units be inspected. If the number of defectives in that sample is one or zero, the lot is accepted. Otherwise, it is rejected. Ideally, when a sampling plan is used, all bad lots will be rejected and all good lots will be accepted. However, because accept/reject decisions are based on a sample of the lot, the probability of making an incorrect decision is greater than zero. The behavior of a sampling plan can be described by its operating characteristic curve, which plots the percentage defective against the corresponding probabilities of acceptance.
See Acceptable Quality Level (AQL), attribute, consumer’s risk, incoming inspection, inspection, Lot Tolerance Percent Defective (LTPD), operating characteristic curve, producer’s risk, quality management, sampling, Statistical Process Control (SPC), Statistical Quality Control (SQC).
Accounts Payable (A/P) – The money owed to suppliers for goods and services purchased on credit; a current liability; also used as the name of the department that pays suppliers.
Analysts look at the relationship between accounts payable and purchases for indications of sound financial management. Working capital is controlled by managing accounts payable, accounts receivable, and inventory.
See Accounts Receivable (A/R), invoice, purchase order (PO), purchasing, supplier, terms.
Accounts Receivable (A/R) – The money customers owe an organization for products and services provided on credit; a current asset on the balance sheet; also used as the name of the department that applies cash received from customers against open invoices.
A sale is treated as an account receivable after the customer is sent an invoice. Accounts receivable may also include an allowance for bad debts. Working capital is controlled by managing accounts payable, accounts receivable, and inventory.
See Accounts Payable (A/P), invoice, purchase order (PO), purchasing, supplier, terms.
acquisition – A contracting term used when an organization takes possession of a product, technology, equipment, or another organization.
In a mergers and acquisitions context, acquisition refers to one firm buying another firm. In a learning context, learning is often called acquisition of new knowledge, skills, or behaviors. In a marketing context, the customer acquisition cost is the cost of finding and winning new customers and is sometimes measured as the advertising cost plus other marketing costs targeted toward new customers divided by the number of new customers added during the time period.
See due diligence, e-procurement, forward buy, mergers and acquisitions (M&A), purchasing, service recovery.
active item – Any inventory item that has been used or sold in the recent past (e.g., the last year).
It is common for a retailer to have 100,000 items in their item master, but only 20,000 active items.
See inventory management, part number.
Activity Based Costing (ABC) – An accounting practice that identifies the cost drivers (variables) that have the most influence on the product (or service) cost and then allocates overhead cost to products and services based on these cost drivers. ![]()
Allocating overhead (particularly manufacturing overhead) is an important activity for many firms. Allocating overhead is needed to estimate product costs in product profitability analysis and important decisions with respect to pricing, product rationalization, and marketing and sales efforts.
Traditional standard costing systems usually allocate overhead cost based on direct labor. For example, consider a product that requires one hour of labor and $30 of materials. If the direct labor wage rate (without overhead) is $20 and the overhead burden rate is $200 per direct labor hour, the standard cost for the product is then direct materials ($20), direct labor ($30), and allocated overhead ($200), for a total cost of $250.
One common criticism of traditional standard costing systems is that it does not make sense to allocate the largest cost (the overhead) based on the smallest cost (the direct labor cost). (Overhead is often the largest component of the standard cost and direct labor cost is often the smallest component.) Traditional standard costing systems assume that the only resource related to overhead is direct labor and that all other resources and activities required to create the product or service cannot be related to overhead.
In contrast, Activity Based Costing begins by identifying the major activities and resources required in the process of creating a product or service. ABC then identifies the “cost pools” (overhead cost) for each activity or resource. Finally, ABC defines an equitable way of allocating (assigning) the overhead cost from the cost pools to the products and services based on a variable called a “cost driver.”
A cost driver should reflect the amount of the cost pool (resource) consumed in the process of creating the product or service. Cost drivers might include the number of setups (for a shared setup team), direct materials cost (for allocating purchasing overhead), direct labor time (for allocating labor-related overhead), total throughput time (for allocating manufacturing overhead), inspection time (for allocating quality control overhead), and space used (for allocating building related overhead).
Activity Based Management (ABM) is the use of the Activity Based Costing tools by process owners to control and improve their operations. Building an Activity Based Costing model requires a process analysis, which requires management to have a deep understanding of the business and evaluate value-added and nonvalue-added activities. The cost analysis and the process understanding that is derived from an ABC system can provide strong support for important managerial decisions, such as outsourcing, insourcing, capacity expansion, and other important “what-if” issues.
Some argue that all manufacturing overhead cost should be allocated based on direct labor (or some other arbitrary cost driver), even if the cost is not traceable to any production activity. However, most experts agree that the sole purpose of an ABC system is to provide management with information that is helpful for decision making. Arbitrary allocation of overhead cost does not support decision making in any way. Even with Activity Based Costing, certain costs related to a business are included in overhead without being allocated to the product.
See absorption costing, burden rate, cost center, customer profitability, hidden factory, outsourcing, overhead, product proliferation, standard cost, throughput accounting, variable costing, what-if analysis.
Activity Based Management (ABM) – See Activity Based Costing (ABC).
ad hoc committee – See committee.
addition principle – Combining two tasks and assigning them to one resource (person, machine, etc.).
Love (1979) defines the addition principle for improving a process as combining two or more process steps so one resource (person, machine, contractor, etc.) does all of them. This strategy has many potential advantages, including reducing cost, reducing cycle time, reducing the number of queues, reducing the number of handoffs, reducing lost customer information, reducing customer waiting time, improving customer satisfaction, improving quality, improving job design, accelerating learning, developing people, and improving accountability.
The addition principle is an application of job enlargement where a worker takes on some of a co-worker’s job and job enrichment, where a worker takes on part of the boss’s job. This is closely related to the queuing theory concept of pooling.
The application of the addition principle is particularly effective in the service context, where it can impact customer waiting time and put more of a “face” on the service process. For example, many years ago, Citibank reduced the number of handoffs in its international letter of credit operation from about 14 to 1. Instead of 14 different people handling 14 small steps, one person handled all 14 steps. This change dramatically reduced customer leadtime, improved quality, and improved process visibility. Citibank required workers to be bilingual, which also improved service quality. The visibility of the new process allowed them to further improve the process and prepared the way for automating parts of the process. However, implementing this new process was not without problems. Many of the people in the old process had to be replaced by people with broader skill sets and the new process increased risk because it eliminated some of the checks and balances in the old process.
See customer leadtime, handoff, human resources, job design, job enlargement, multiplication principle, pooling, subtraction principle.
ADKAR Model for Change – A five-step model designed to help organizations affect change.
ADKAR, developed by Prosci (Hiatt 2006), is similar to the Lewin/Schein Theory of Change. ADKAR defines five stages that must be realized for an organization or an individual to successfully change:
• Awareness – An individual or organization must know why the change is needed.
• Desire – Either the individual or organizational members must have the motivation and desire to participate in the proposed change or changes.
• Knowledge – Knowing why one must change is not enough; an individual or organization must know how to change.
• Ability – Every individual and organization that truly wants to change must implement new skills and behaviors to implement the necessary changes.
• Reinforcement – Individuals and organizations must be reinforced to sustain the changes and the new behaviors. Otherwise, the individuals and organization will likely revert to their old behaviors.
See change management, control plan, Lewin/Schein Theory of Change.
adoption curve – The major phases in the product life cycle that reflect the market’s acceptance of a new product or technology.
According to the Product Development and Management Association (www.pdma.org), consumers move from (a) a cognitive state (becoming aware of and knowledgeable about a product) to (b) an emotional state (liking and then preferring the product) and finally into (c) a behavioral state (deciding on and then purchasing the product). At the market level, the new product is first purchased by market innovators (roughly 2.5% of the market), followed by early adopters (roughly 13.5% of the market), early majority (34%), late majority (34%), and finally, laggards (16%).
See Bass Model, New Product Development (NPD), product life cycle management.
Advanced Planning and Scheduling (APS) – An information system used by manufacturers, distributors, and retailers to assist in supply chain planning and scheduling.
Most APS systems augment ERP system functionality by providing forecasting, inventory planning, scheduling, and optimization tools not historically found in ERP systems. For example, APS systems can calculate optimal safety stocks, create detailed schedules that do not exceed available capacity (finite scheduling), and find the near-optimal assignments of products to plants. In contrast, traditional ERP systems were fundamentally transaction processing systems that implemented user-defined safety stocks, created plans that regularly exceeded available capacity (infinite loading), and did not optimize anything.
The best-known dedicated APS software vendors were i2 Technologies and Manugistics, but they are both now owned by JDA Software. SAP has an APS module called APO, which stands for Advanced Planning and Optimization. According to SAP’s website, “SAP APO is a software solution that enables dynamic supply chain management. It includes applications for detailed planning, optimization, and scheduling, allowing the supply chain to be accurately and globally monitored even beyond enterprise boundaries. SAP APO is a component of mySAP Supply Chain Management.”
The sales script for these APS systems in the past (exaggerated here for sake of emphasis) has been that the big ERP systems (SAP, Oracle, etc.) were “brain dead” and had little intelligence built into them. These big ERP systems were only transaction processing systems and did little in the way of creating detailed schedules, forecasting, or optimization. The promise of the APS systems was that they were “smart” and could make the ERP systems a lot smarter. In recent years, the lines have blurred and nearly all ERP systems offer add-on products that do much of what only APS systems could do in the past.
Many APS users have found that several APS features were hard to implement and maintain, which has led to some negative assessments of APS systems. The three main complaints that this author has heard are (1) massive data requirements (capacity information on almost every workcenter for every hour in the day), (2) complexity (few managers understand the mathematical algorithms used in APS applications), and (3) lack of systems integration (the APS must work alongside the ERP system and must share a common database). The finite scheduling entry discusses some of the needs that motivated the development of APS systems.
See algorithm, back scheduling, closed-loop MRP, Enterprise Resources Planning (ERP), finite scheduling, I2, infinite loading, job shop scheduling, load, load leveling, Manugistics, Materials Requirements Planning (MRP), optimization, SAP.
Advanced Shipping Notification (ASN) – An electronic file sent from a supplier to inform a customer when incoming goods are expected to arrive.
An ASN may be a document, a fax, or electronic communication. However, electronic communication is preferred. ASNs usually include PO numbers, SKU numbers, lot numbers, quantity, pallet or container number, carton number, and other information related to the shipment and to each item in the shipment.
ASN files are typically sent electronically immediately when a trailer (destined for a given receiving facility) leaves a DC. The ASN file should be received by the receiving facility well in advance of the time the trailer arrives. When the trailer (or other shipping container) arrives, the contents of the trailer can be electronically compared to the contents of the ASN file as the trailer is unloaded. Any missing items or unexpected items would be highlighted on the OS&D report. The ASN is typically received and processed by the Transportation Management System (TMS) or Warehouse Management System (WMS) at the receiving facility.
The ASN file serves three important purposes:
• The receiving facility uses the ASN to plan inventory or load movement (interline hauls or ground-route distribution) based on the expected inbound mix of goods. Such planning may include scheduling of other resources (drivers, warehouse personnel) or even advance calls to customers to inform them of their expected delivery time windows.
• The TMS or WMS systems at the receiving facility may use the expected inbound mix of goods to prepare warehouse employees to receive the goods by downloading the information to wireless barcode scanners or alerting warehouse planning staff to the expected incoming volume of goods.
• The TMS or WMS system may ultimately use the expected inbound goods to form the basis of an Over/Short/Damaged (OS&D) report upon actual scanning of the inbound goods.
Although commonly used in over-the-road trucking, an ASN can be sent in relation to any shipment, including air, rail, road, and sea shipments. An ASN file is often sent in the agreed-upon EDI 210 (“Advanced Shipping Notification”) format. However, technically, an ASN could be any file format agreed upon by the originating and receiving facilities.
See consignee, cross-docking, distribution center (DC), Electronic Data Interchange (EDI), incoming inspection, manifest, Over/Short/Damaged Report, packing slip, receiving, trailer, Transportation Management System (TMS), Warehouse Management System (WMS).
adverse event – A healthcare term used to describe any unintended and undesirable medical occurrence experienced by a patient due to medical therapy or other intervention, regardless of the cause or degree of severity.
The term “adverse event” is often used in the context of drug therapy and clinical trials. In the drug therapy context, it is also called an adverse reaction or an adverse drug reaction.
Very serious adverse events are usually called sentinel events or never events. However, a few sources treat the terms “adverse event” and “sentinel event” as synonyms. The term “near miss” is used to describe an event that could have harmed the patient, but was avoided through planned or unplanned actions.
Barach and Small (2000) report lessons for healthcare organizations from non-medical near miss reporting systems. This interesting report begins by emphasizing that most near misses and preventable adverse events are not reported and that healthcare systems could be improved significantly if more of these events were reported. The report further argues that healthcare could benefit from what has been learned in other industries. The authors studied reporting systems in aviation, nuclear power technology, petrochemical processing, steel production, military operations, and air transportation as well as in healthcare. They argue that reporting near misses is better than reporting only adverse events, because the greater frequency enables better quantitative analysis and provides more information to process improvement programs. Many of the non-medical industries have developed incident reporting systems that focus on near misses, provide incentives for voluntary reporting (e.g., limited liability, anonymous reporting, and confidentiality), bolster accountability, and implement systems for data collection, analysis, and improvement.
The key to encouraging reporting of near misses and adverse events is to lower the disincentives (costs) of reporting for workers. When people self-report an error or an event, they should not be “rewarded” with disciplinary action or dismissal (at least not the first time). Many organizations allow for anonymous reporting via a website, which makes it possible for the person reporting the event to keep his or her identity confidential. It is also important to make the process easy to use.
See error proofing, Joint Commission, sentinel event.
advertising allowance (ad allowance) – See trade promotion allowance.
affinity diagram – A “bottoms-up” group brainstorming methodology designed to help groups generate and organize a large number of ideas into related groups; also known as the KJ Method and KJ Analysis. ![]()
Affinity diagrams are a simple yet powerful way to extract qualitative data from a group, help the group cluster similar ideas, and develop a consensus view on a subject. For example, an affinity diagram might be used to clarify the question, “What are the root causes of our quality problems?”
Despite the name, affinity diagrams are not really diagrams. Occasionally, circles are drawn around clusters of similar concepts and lines or trees are drawn to connect similar clusters, but these drawings are not central to the affinity diagramming methodology.
For example, affinity diagrams are often used with Quality Function Development (QFD) to sort and organize ideas on customer needs. To do this, the facilitator instructs each individual in a group to identify all known customer needs and write them down on 3M Post-it Notes, with each need on an individual piece of paper. The group then shares their ideas one idea at a time, organizes the notes into clusters, develops a heading for each cluster, and then votes to assign importance to each group.
The steps for creating an affinity diagram are essentially the same as the used in the nominal group technique and the KJ Method. See the Nominal Group Technique (NGT) entry for the specific steps. An affinity diagram example can be found at http://syque.com/quality_tools/tools/TOOLS04.htm (April 7, 2011).
See brainstorming, causal map, cluster analysis, Kepner-Tregoe Model, KJ Method, Nominal Group Technique (NGT), parking lot, Quality Function Deployment (QFD), Root Cause Analysis (RCA).
aftermarket – An adjective used to describe parts or products that are purchased to repair or enhance a product.
For example, many people buy cases for their cell phones as an aftermarket accessory.
See service parts.
aggregate inventory management – The analysis of a large set of items in an inventory system with a focus on lotsizing and safety stock policies to study the trade-offs between carrying cost and service levels.
Inventories with thousands of items are difficult to manage because of the amount of data involved. Aggregate inventory management tools allow managers to group items and explore opportunities to reduce inventory and improve service levels by controlling the target service level, carrying charge, and setup cost parameters for each group of items. Aggregate inventory analysis typically applies economic order quantity logic and safety stock equations in light of warehouse space limitations, market requirements, and company strategies. Aggregate inventory analysis often results in a simultaneous reduction in overall inventory and improvement in overall service levels. This is accomplished by reducing the safety stock inventory for those items that have unnecessarily high safety stocks and by increasing the safety stock inventory for those items that have poor service levels.
The Sales and Operations Plan (S&OP), sometimes called the Sales, Inventory, and Operations Plan (Si&OP), is similar to the aggregate inventory plan. However, unlike aggregate inventory management, S&OP rarely uses mathematical models and focuses on building consensus in the organization.
See Economic Order Quantity (EOQ), inventory management, inventory turnover, lotsizing methods, production planning, safety stock, Sales & Operations Planning (S&OP), service level, unit of measure, warehouse.
aggregate plan – See production planning.
aggregate production planning – See production planning.
agile manufacturing – A business strategy for developing the processes, tools, training, and culture for increasing flexibility to respond to customer needs and market changes while still controlling quality and cost.
The terms agile manufacturing, time-based competition, mass customization, and lean are closely related. Some key strategies for agile manufacturing include commonality, lean thinking, modular design, postponement, setup time reduction, and virtual organizations.
See Goldman, Nagel, and Preiss (1995) and Metes, Gundry, and Bradish (1997) for books on the subject.
See commonality, lean thinking, mass customization, modular design (modularity), operations strategy, postponement, Quick Response Manufacturing, resilience, scalability, setup time reduction methods, time-based competition, virtual organization.
agile software development – A software development methodology that promotes quick development of small parts of a project to ensure that the developers meet user requirements; also known as agile modeling.
Agile software development promotes iterative software development with high stakeholder involvement and open collaboration throughout the life of a software development project. It uses small increments with minimal planning. Agile attempts to find the smallest workable piece of functionality, deliver it quickly, and then continue to improve it throughout the life of the project as directed by the user community. This helps reduce the risk that the project will fail to meet user requirements.
In contrast, the waterfall scheduling requires “gates” (approvals) for each step of the development process: requirements, analysis, design, coding, and testing. Progress is measured by adherence to the schedule. The waterfall approach, therefore, is not nearly as iterative as the agile process.
See beta test, catchball, cross-functional team, Fagan Defect-Free Process, lean thinking, prototype, scrum, sprint burndown chart, stakeholder, waterfall scheduling.
AGV – See Automated Guided Vehicle.
AHP – See Analytic Hierarchy Process.
AI – See artificial intelligence.
alpha test – See prototype.
alignment – The degree to which people and organizational units share the same goals.
Two or more people or organizational units are said to be “aligned” when they are working together toward the same goals. They are said to be “misaligned” when they are working toward conflicting goals. Alignment is usually driven by recognition and reward systems.
For example, sales organizations often forecast demand higher than the actual demand because sales people tend to be much more concerned about running out of stock (and losing sales) than having too much inventory. In other words, they are prone to “add safety stock to the forecast.” Given that sales organizations are typically rewarded only based on sales, this bias is completely logical. However, this behavior is generally not aligned with the overall objectives of the firm.
See balanced scorecard, forecast bias, hoshin planning.
algorithm – A formal procedure for solving a problem.
An algorithm is usually expressed as a series of steps and implemented in a computer program. For example, some algorithms for solving the Traveling Salesperson Problem can require thousands of lines of computer code. Some algorithms are designed to guarantee an optimal (mathematically best) solution and are said to be exact or optimal algorithms. Other algorithms, known as heuristics or heuristic algorithms, seek to find the optimal solution, but do not guarantee that the optimal solution will be found.
See Advanced Planning and Scheduling (APS), Artificial Intelligence (AI), assignment problem, check digit, cluster analysis, Economic Lot Scheduling Problem (ELSP), gamma function, heuristic, job shop scheduling, knapsack problem, linear programming (LP), lotsizing methods, network optimization, operations research (OR), optimization, transportation problem, Traveling Salesperson Problem (TSP), Wagner-Whitin lotsizing algorithm.
alliance – A formal cooperative arrangement with another firm, which could be for almost any purpose, such as new product development, sharing information, entering a new market, etc. Alliances usually involve sharing both risks and rewards.
allocated inventory – A term used by manufacturing and distribution firms to describe the quantity of an item reserved but not yet withdrawn or issued from stock; also called allocated stock, allocated, allocations, committed inventory, committed quantity, quantity allocated, or reserved stock.
The inventory position does not count allocated inventory as available for sale. Allocations do not normally specify which units will go to an order. However, firm allocations will assign specific units to specific orders.
See allocation, backorder, inventory position, issue, Materials Requirements Planning (MRP), on-hand inventory.
allocation – (1) Inventory reserved for a customer. See allocated inventory. (2) A set of rules used to determine what portion of available stock to provide to each customer when demand exceeds supply.
See allocated inventory.
all-time demand – The total of all future requirements (demand) for an item; also called all-time requirement, lifetime requirement, and all-time demand.
All-time demand is the sum of the demand until the product termination date or until the end of time. Organizations need to forecast the all-time demand for a product or component in the following situations:
• Determine the lotsize for a final purchase (“final buy”) – When an item is near the end of its useful life and the organization needs to make one last purchase, it needs to forecast the all-time demand. Future purchases will be expensive due to the supplier’s cost of finding tooling, skills, and components.
• Determine the lotsize for a final manufacturing lot – When an item is near the end of its useful life and the manufacturer needs to make one last run of the item, it needs to forecast the lifetime demand. Future manufacturing will likely be very expensive.
• Identify the amount of inventory to scrap – When an item is near the end of its useful life, a forecast of the all-time demand can be used to help determine how many units should be scrapped and how many should be kept (the keep stock).
• Identify when to discontinue an item – A forecast of the lifetime demand can help determine the date when an item will be discontinued.
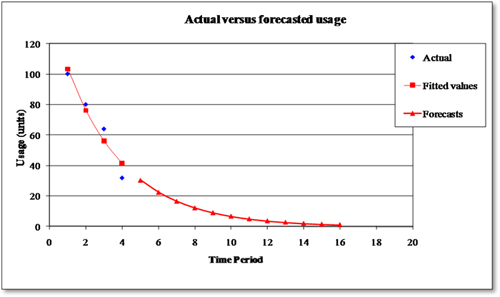
Several empirical studies, such as Hill, Giard, and Mabert (1989), have found that the demand during the end-of-life phase of the product life cycle often decays geometrically. The geometric progression suggests that the demand in any period is a constant times the demand in the previous period (i.e., dt = βdt−1), where 0 < β < 1. The beta parameter is called the common ratio, because β = d1/d0 = ... = dt+1/dt. Given that period 0 had demand of d0 units, the forecasted demand for period 1 is f1 = βd0 and for period 2 is f2 = βf1 = β2d0. In general, given that period 0 demand is d0 units, the forecasted demand t periods into the future is fT = βT d0.
The cumulative forecasted demand through the next T periods after period 0 is the sum of the finite geometric progression FT = f1 + f2 + ... + fT = βd0 + β2d0 + ... + βT d0. Multiplying both sides of this equation by β yields βFT = β2d0 + β3d0 + ... + βT+1d0 and then subtracting this new equation from the first one yields FT − βFT = βd0 − βT+1 d0, which simplifies to FT · − β) = d0β(1 − βT). Given that β < 1, it is clear that 1 − β ≠ 0, which means that it is possible to divide both sides by 1 − β, which yields FT = d0β(1 − βT)/(1 − β). At the limit, as T → ∞, βT → 0, and the sum of the all-time demand after period 0 is F∞ = d0β/(1 −β). In summary, given that the actual demand for the most recent period (period 0) was d0, the forecast of the cumulative demand over the next T time periods is FT = d0β(1 − βT)/(1 −β). The cumulative demand from now until the end of time is then F∞ = d0β/(1 − β).
The graph on the right shows the geometric decay for four historical data points (100, 80, 64, and 32). With β = 0.737, the all-time demand forecast is F∞ = d0β/(1 −β)= 100 · 0.737/(1 − 0.737) = 116 units, and a forecast over a T = 16 period horizon is 113 units.
See all-time order, autocorrelation, Bass Model, demand, forecast horizon, forecasting, geometric progression, obsolete inventory, product life cycle management, slow moving inventory, termination date.
all-time order – The last order for a particular product in the last phase of its life cycle.
The all-time order is sometimes called the “lifetime buy” or “last buy.” The all-time order should be large enough so the inventory provided will satisfy nearly all expected future demand and balance the cost of a stockout with the cost of carrying inventory.
See all-time demand, product life cycle management.
alternate routing – See routing.
American Society for Quality (ASQ) – A professional association that advances learning, quality improvement, and knowledge exchange to improve business results and create better workplaces and communities worldwide.
ASQ has more than 100,000 individual and organizational members. Founded in 1946, and headquartered in Milwaukee, Wisconsin, the ASQ was formerly known as the American Society for Quality Control (ASQC). Since 1991, ASQ has administered the Malcolm Baldrige National Quality Award, which annually recognizes companies and organizations that have achieved performance excellence. ASQ publishes many practitioner and academic journals, including Quality Progress, Journal for Quality and Participation, Journal of Quality Technology, Quality Engineering, Quality Management Journal, Six Sigma Forum Magazine, Software Quality Professional, and Technometrics. The ASQ website is www.asq.org.
See Malcolm Baldrige National Quality Award (MBNQA), operations management (OM), quality management.
Analysis of Variance (ANOVA) – A statistical procedure used to test if samples from two or more groups come from populations with equal means.
ANOVA is closely related to multiple regression in that both are linear models and both use the F test to test for significance. In fact, a regression with dummy variables can be used to conduct an ANOVA, including exploring multiple-way interaction terms. The test statistic for analysis of variance is the F-ratio.
ANOVA is applicable when the populations of interest are normally distributed, populations have equal standard deviations, and samples are randomly and independently selected from each population.
Multivariate Analysis of Variance (MANOVA), an extension of ANOVA, can be used to accommodate more than one dependent variable. MANOVA measures the group differences between two or more metric dependent variables simultaneously, using a set of categorical non-metric independent variables.
See confidence interval, covariance, Design of Experiments (DOE), Gauge R&R, linear regression, sampling, Taguchi methods, t-test, variance.
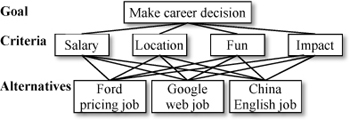
Analytic Hierarchy Process (AHP) – A structured methodology used to help groups make decisions in a complex environment; also known as Analytical Hierarchy Process.
The AHP methodology, developed by Saaty (2001), can be summarized as follows:2
• Model the problem as a hierarchy containing the decision goal, the alternatives for reaching it, and the criteria for evaluating the alternatives.
• Establish priorities among the elements of the hierarchy by making a series of judgments based on pairwise comparisons of the elements.
• Synthesize these judgments to yield a set of overall priorities for the hierarchy.
• Check the consistency of the judgments.
• Come to a final decision based on the results of this process.
For example, a student has three job offers and needs to select one of them. The student cares about four criteria: salary, location, fun, and impact. The offers include (1) a job setting the price for the Ford Mustang in Detroit, (2) a job as a website developer at Google in San Francisco, and (3) a job teaching English in a remote part of China. The goal, criteria, and alternatives are shown in the figure on the right.
Analytic Hierarchy Process example
The student scores the relative importance of the objectives by comparing each pair of objectives in a table and scoring them on the scale:
1 = Objectives i and j are of equal importance.
3 = Objective i is moderately more important than j.
5 = Objective i is strongly more important than j.
7 = Objective i is very strongly more important than j.
9 = Objective i is absolutely more important than j.

Scores 2, 4, 6, 8 are intermediate values. The respondent only puts a score in a cell where the row is more important than the column. The remainder of the matrix is then filled out by setting all main diagonal values to 1 (i.e., aii = 1) and setting the cell on the other side of the main diagonal to the inverse value (i.e., aji = aij). In general, participants must score n(n − 1)/2 pairs, where n is the number of criteria to be evaluated.
The next step is to compute the eigenvalues and the normalized eigenvector3 of this matrix. The set of n values will add to one. The consistency index can then be computed. The eigenvalue for this problem is λ = 4.2692 and the normalized eigenvector is shown in the table above. The consistency ratio is 9.97%, which is considered acceptable. The next step is to evaluate all pairs of the three alternatives on each of the four dimensions using the same 1 to 9 scale. As a result, each alternative now has a weight for each dimension. These are then weighted by the vector, which suggests a final decision to the user.
An AHP tutorial can be found at http://people.revoledu.com/kardi/tutorial/AHP/index.html (April 10, 2011). See the Kepner-Tregoe Model and Pugh Matrix entries for other methods for multiple-criteria decision making.
See causal map, conjoint analysis, decision tree, force field analysis, Kano Analysis, Kepner-Tregoe Model, New Product Development (NPD), Pugh Matrix, TRIZ, voice of the customer (VOC).
anchoring – Allowing estimates or thinking to be influenced by some starting information or current conditions; also used to describe the difficulty of changing behavior that is heavily influenced by old habits.
According to the Forecasting Dictionary (Armstrong 2001), the initial value (or anchor) can be based on tradition, previous history, or available data. Anchoring is a significant problem in many operations contexts, including forecasting and subjective estimation of probabilities. For example, when making a subjective forecast, people often anchor on the previous period’s demand.
In one interesting study, Tversky and Kahneman (1974) asked subjects to predict the percentage of nations that were African in the United Nations. They selected an initial value by spinning a wheel in the subject’s presence. The subjects were then asked to revise this number upward or downward to obtain an answer. This information-free initial value had a strong influence on the estimate. Those starting with 10% made predictions averaging 25%. In contrast, those starting with 65% made predictions averaging 45%.
See forecasting, newsvendor model.
andon board – See andon light.
andon light – A lean term (pronounced “Ann-Don”) that refers to a warning light, warning board, or signal on (or near) a machine or assembly line that calls attention to defects or equipment problems; also called an andon board; the Japanese word for andon (![]() ) means “lamp.”
) means “lamp.”
An andon is any visual indicator signaling that a team member has found an abnormal situation, such as poor quality, lack of parts, improper paperwork, missing information, or missing tools. When a worker pulls an andon cord (or pushes a button), the red light goes on, the line is stopped, and a supervisor or technician responds immediately to help diagnose and correct the problem. It is important for management to define exactly who is responsible as the support person. The idea here is to have a simple visual system that immediately calls for the right kind of help from the right people at the right time. This is a good example of Rule 5 in the Spear and Bowen (1999) framework.
The number of lights and their possible colors can vary even by workcenter within a plant. Most implementations have three colors: red, yellow, and green (like a stoplight). Red usually means the line is down, yellow means the line is having problems, and green means normal operations. Some firms use other colors to signal other types of issues, such as material shortages or defective components. Some firms use a blinking light to signal that someone is working on the problem.
See assembly line, error proofing, jidoka, lean thinking, visual control.
ANOVA – See Analysis of Variance.
anticipation inventory – Inventory held to (1) satisfy seasonal demand, (2) cope with expected reduced capacity due to maintenance or an anticipated strike, or (3) store seasonal supply for a level demand throughout the year (for example, a crop that is harvested only once per year).
See production planning, seasonality.
antitrust laws – Government regulations intended to protect and promote competition.
Competition is beneficial because it causes firms to add more value to society. Firms that add value to the market (and society) survive, but those that do not add value go out of business.
The four main antitrust laws in U.S. Federal law are:
The Sherman Antitrust Act – Passed in 1890, this act outlaws “every contract, combination in the form of trust or otherwise, or conspiracy, in restraint of trade or commerce among the several States, or with foreign nations.” This law makes it illegal to create a monopoly or engage in practices that hurt competition.
The Clayton Act – Passed in 1914 and revised in 1950, this act keeps prices from skyrocketing due to mergers, acquisitions, or other business practices. By giving the government the authority to challenge largescale moves made by corporations, this act provides a barrier against monopolistic practices.
Robinson-Patman Act – Passed in 1936 to supplement the Clayton Act, this act forbids firms from engaging in interstate commerce to discriminate in price for different purchasers of the same commodity if the effect would be to lessen competition or create a monopoly. This act protects independent retailers from chain-store competition, but it was also strongly supported by wholesalers who were eager to prevent large chain stores from buying directly from the manufacturers at lower prices.
The Federal Trade Commission Act of 1914 – Like the Clayton Act, this act is a civil statute. This act established the Federal Trade Commission (FTC), which seeks to maintain competition in interstate commerce.
In addition to these acts, antitrust violators may be found guilty of criminal activity or civil wrongdoing through other laws. Some of the other possible charges include perjury, obstruction of justice, making false statements to the government, mail fraud, and conspiracy.
See bid rigging, bribery, category captain, General Agreement on Tariffs and Trade (GATT), mergers and acquisitions (M&A), predatory pricing, price fixing, purchasing.
APICS (The Association for Operations Management) – A professional society for operations managers, including production, inventory, supply chain, materials management, purchasing, and logistics.
APICS stands for American Production and Inventory Control Society. However, APICS has adopted the name “The Association for Operations Management,” even though the name no longer matches the acronym.
The APICS website (www.apics.org) states, “The Association for Operations Management is the global leader and premier source of the body of knowledge in operations management, including production, inventory, supply chain, materials management, purchasing, and logistics.” Since 1957, individuals and companies have relied on APICS for training, certifications, comprehensive resources, and a worldwide network of accomplished industry professionals. APICS confers the CIRM, CPIM, and CSCP certifications. APICS produces a number of trade publications and a practitioner/research journal, the Production & Inventory Management Journal.
See operations management (OM).
A-plant – See VAT analysis.
Application Service Provider (ASP) – An organization that provides (hosts) remote access to a software application over the Internet.
The ASP owns a license to the software and customers rent the use of the software and access it over the Internet. The ASP may be the software manufacturer or a third-party business. An ASP operates the software at its data center, which customers access online under a service contract. A common example is a website that other websites use for accepting payment by credit card as part of their online ordering systems. The benefits of an ASP are lower upfront costs, quicker implementation, scalability, and lower operating costs. The term “Software as a Service (SaaS)” seems to have diminished the importance of this term.
The unrelated term Active Server Pages (ASP) describes HTML pages that contain embedded scripts.
See cloud computing, service management, Software as a Service (SaaS).
appraisal cost – An expense of measuring quality through inspection and testing. ![]()
Many popular quality consultants argue that appraisal costs should be eliminated and that firms should not try to “inspect quality into the product,” but should instead “design quality into the product and process.”
See cost of quality.
APS – See Advanced Planning and Scheduling (APS).
AQL – See Acceptable Quality Level.
arbitrage – Buying something in one market and reselling it at a higher price in another market.
Arbitrage involves a combination of matching deals to exploit the imbalance in prices between two or more markets and profiting from the difference between the market prices. A person who engages in arbitrage is called an arbitrageur.
Arbitrage is a combination of transactions designed to profit from an existing discrepancy among prices, exchange rates, or interest rates in different markets, often without risk of these changing. The simplest form of arbitrage is the simultaneous purchase and sale of something in different markets. More complex forms include triangular arbitrage. To arbitrage is to make a combination of bets such that if one bet loses, another one wins, with the implication of having an edge, at no risk or at least low risk. The term “hedge” has a similar meaning, but does not carry the implication of having an edge.
See hedging.
ARIMA – Autoregressive Integrated Moving Average. See Box-Jenkins forecasting.
ARMA – Autoregressive Moving Average. See Box-Jenkins forecasting.
Artificial Intelligence (AI) – Computer software that uses algorithms that emulate human intelligence.
Many applications of AI have been made in operations management, including decision support systems, scheduling, forecasting, computer-aided design, character recognition, pattern recognition, and speech/voice recognition. One challenge for computer scientists is differentiating AI software from other types of software.
See algorithm, expert system, neural network, robotics.
ASN – See Advanced Shipping Notification (ASN).
AS/RS – See Automated Storage & Retrieval System (AS/RS).
ASQ – See American Society for Quality.
assemble to order (ATO) – A customer interface strategy that stocks standard components and modules that can quickly be assembled products to meet a wide variety of customer requirements. ![]()
ATO allows an organization to produce a large variety of final products with a relatively short customer leadtime. Well-known examples of ATO processes include Burger King, which assembles hamburgers with many options while the customer waits, and Dell Computer, which assembles and ships a wide variety of computers on short notice. ATO systems almost never have any finished goods inventory, but usually stock major components. Pack to order and configure to order systems are special cases of ATO.
See assembly, build to order (BTO), customer leadtime, Final Assembly Schedule (FAS), make to stock (MTS), mass customization, Master Production Schedule (MPS), respond to order (RTO).
assembly – A manufacturing process that brings together two or more parts to create a product or a subassembly that will eventually become part of a product; the result of an assembly process.
A subassembly is an intermediate assembly used in the production of higher-level subassemblies, assemblies, and products.
See assemble to order (ATO), assembly line, manufacturing processes.
assembly line – The organization of a series of workers or machines so discrete units can be moved easily from one station to the next to build a product; also called a production line.
On an assembly line, each worker (or machine) performs one relatively simple task and then moves the product to the next worker (or machine). Assembly lines are best suited for assembling large batches of standard products and therefore require a highly standardized process. Unlike continuous processes for liquids or powders, which can move through pipes, assembly lines are for discrete products and often use conveyer belts to move products between workers. Assembly lines use a product layout, which means the sequence is determined by the product requirements. Some automated assembly lines require substantial capital investment, which makes them hard to change.
One issue with an assembly line is assigning work to workers to balance the line to minimize wasted time. See the line balancing entry.
The term “production line” is more general than the term “assembly line.” A production line may include fabrication operations, such as molding and machining, whereas an assembly line only does assembly.
See andon light, assembly, cycle time, discrete manufacturing, fabrication, facility layout, line balancing, manufacturing processes, mixed model assembly, production line, standard products.
asset turnover – A financial ratio that measures the ability of the firm to use its assets to generate sales revenue.
Asset turnover is measured as the ratio of a company’s net sales to its total assets. The assets are often based on an average. Asset turnover is similar to inventory turnover.
See financial performance metrics, inventory turnover.
assignable cause – See special cause variation.
assignment problem – A mathematical programming problem of matching one group of items (jobs, trucks, etc.) with another group of locations (machines, cities, etc.) to minimize the sum of the costs.
The assignment problem is usually shown as a table or a matrix and requires that exactly one match is found in each row and each column. For example, matching students to seats has N students and N seats and results in an N × N table of possible assignments. Each student must be assigned to exactly one seat and each seat must be assigned to exactly one student. The “cost” of assigning student i to seat j is cij, which may be some measure of the student’s disutility (dislike) for that seat. This problem can be solved efficiently on a computer with special-purpose assignment algorithms, network optimization algorithms, and general-purpose linear programming algorithms. Even though it is an integer programming problem, it can be solved with any general linear programming package and be guaranteed to produce integer solutions, because the problem is unimodular.
The assignment problem is formulated as the following linear program:
Assignment problem: Minimize  Subject to
  for all j and
  for all i where the decision variables are xij
 ![]() {0,1} and cij is the cost of assigning item i to location j.
{0,1} and cij is the cost of assigning item i to location j.
See algorithm, integer programming (IP), linear programming (LP), network optimization, operations research (OR), transportation problem, Traveling Salesperson Problem (TSP).
Association for Manufacturing Excellence (AME) – A practitioner-based professional society dedicated to cultivating understanding, analysis, and exchange of productivity methods and their successful application in the pursuit of excellence.
Founded in 1985, AME was the first major professional society in North America to promote lean manufacturing principles. AME sponsors events and workshops that focus on hands-on learning. AME publishes the Target magazine and puts on several regional and national events each year.
The AME website is www.ame.org.
See operations management (OM).
assortment – A retailer’s selection of merchandise to display; also known as “merchandise assortment” and “product assortment.”
The target customer base and physical product characteristics determine the depth and breadth of an assortment and the length of time it is carried.
See category captain, category management, planogram, product proliferation.
ATO – See assemble to order.
ATP – See Available-to-Promise (ATP).
attribute – A quality management term used to describe a zero-one (binary) property of a product by which its quality will be judged by some stakeholder.
Inspection can be performed by attributes or by variables. Inspection by attributes is usually for lot control (acceptance sampling) and is performed with a p-chart (to control the percent defective) or a c-chart (to control the number of defects). Inspection by variables is usually done for process control and is performed with an x-bar chart (to control the mean) or an r-chart (to control the range or variance).
See acceptance sampling, c-chart, inspection, p-chart, quality management, Statistical Process Control (SPC), Statistical Quality Control (SQC).
autocorrelation – A measure of the strength of the relationship between a time series variable in periods t and t − k; also called serial correlation.
Autocorrelation measures the correlation between a variable in period t and period t − k (i.e., correlation between xt and xt−k). The autocorrelation at lag k is then defined as 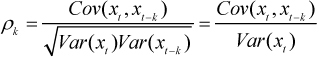 , where Var(xt) = Var(xt−k) for a weakly stationary process.
Testing for autocorrelation is one way to check for randomness in time series data. The Durbin-Watson test can be used to test for first-order (i.e., k = 1) autocorrelation. The runs test can also be used to test for serial independence.
The Box-Jenkins forecasting method uses the autocorrelation structure in the time series to create forecasts.
Excel can be used to estimate the autocorrelation at lag k using CORREL(range1, range2), where range1 includes the first T − 1 values and range2 includes the last T − 1 values of a time series with T values.
See all-time demand, Box-Jenkins forecasting, correlation, Durbin-Watson statistic, learning curve, runs test, safety stock, time series forecasting.
Automated Data Collection (ADC) – Information systems used to collect and process data with little or no human interaction; also called data capture, Automated Identification and Data Capture (AIDC), and Auto-ID.
Automated Data Collection is based on technologies, such as barcodes, Radio Frequency Identification (RFID), biometrics, magnetic stripes, Optical Character Recognition (OCR), smart cards, and voice recognition. Most Warehouse Management Systems and Manufacturing Execution Systems are integrated with ADC systems.
See barcode, Manufacturing Execution System (MES), Optical Character Recognition (OCR), part number, quality at the source, Radio Frequency Identification (RFID), Warehouse Management System (WMS).
Automated Guided Vehicle (AGV) – Unmanned, computer-controlled vehicle equipped with a guidance and collision-avoidance system; sometimes known as an Automated Guided Vehicle System (AGVS).
AGVs typically follow a path defined by wires embedded in the floor to transport materials and tools between workstations. Many firms have found AGVs to be inefficient and unreliable.
See automation, robotics.
Automated Identification and Data Capture (AIDC) – See Automated Data Collection (ADC).
Automated Storage & Retrieval System (AS/RS) – A computer-controlled robotic device used for storing and retrieving items from storage locations; also called ASRS.
Automated Storage and Retrieval Systems are a combination of equipment, controls, and information systems that automatically handle, store, and retrieve materials, components, tools, raw material, subassemblies, or products with great speed and accuracy. Consequently, they are used in many manufacturing and warehousing applications. An AS/RS includes one or more of the following technologies: horizontal carousels, vertical carousels, vertical lift modules (VLM), and the traditional crane-in-aisle storage and retrieval systems that use storage retrieval (SR) cranes.
See automation, batch picking, carousel, warehouse, zone picking.
Automatic Call Distributor (ACD) – A computerized phone system that responds to the caller with a voice menu and then routes the caller to an appropriate agent; also known as Automated Call Distribution.
ACDs are the core technology in call centers and are used for order entry, direct sales, technical support, and customer service. All ACDs provide some sort of routing function for calls. Some ACDs use sophisticated systems that distribute calls equally to agents or identify and prioritize a high-value customer based on the calling number. Some ACDs recognize the calling number via ANI or Caller ID, consult a database, and then route the call accordingly. ACDs can also incorporate “skills-based routing” that routes callers along with appropriate data files to the agent who has the appropriate knowledge and language skills to handle the call. Some ACDs can also route e-mail, faxes, Web-initiated calls, and callback requests.
The business benefits of an ACD include both customer benefits (less average waiting time and higher customer satisfaction) and service provider benefits (more efficient service, better use of resources, and less need for training). However, some customers intensely dislike ACDs because they can be impersonal and confusing.
See automation, call center, customer service.
automation – The practice of developing machines to do work that was formerly done manually. ![]()
Automation is often a good approach for reducing variable cost, improving conformance quality of a process, and manufacturing run time per unit. However, automation requires capital expense, managerial and technical expertise to install, and technical expertise to maintain. Additionally, automation often reduces the product mix flexibility (highly automated equipment is usually dedicated to a narrow range of products), decreases volume flexibility (the firm must have enough volume to justify the capital cost), and increases risk (the automation becomes worthless when the process or product technology becomes obsolete or when the market demand for products requiring the automation declines).
Automation is best used in situations where the work is dangerous, dirty, or dull (“the 3Ds”). For example, welding is dangerous, cleaning a long underground sewer line is dirty, and inserting transistors on a printed circuit board is dull. All three of these tasks can and should be automated when possible. Repetitive (dull) work often results in poor quality work, so automated equipment is more likely to produce defect-free results.
See 3Ds, Automated Guided Vehicle (AGV), Automated Storage & Retrieval System (AS/RS), Automatic Call Distributor (ACD), cellular manufacturing, Flexible Manufacturing System (FMS), flexibility, islands of automation, jidoka, labor intensive, multiplication principle, robotics.
autonomation – See error proofing, jidoka, Toyota Production System (TPS).
autonomous maintenance – A Total Productive Maintenance (TPM) principle that has maintenance performed by machine operators rather than maintenance people.
Maintenance activities include cleaning, lubricating, adjusting, inspecting, and repairing machines. Advantages of autonomous maintenance include increased “ownership” of the equipment, increased uptime, and decreased maintenance costs. It can also free up maintenance workers to focus more time on critical activities.
See maintenance, Total Productive Maintenance (TPM).
autonomous team – A group of people who work toward specific goals with very little guidance from a manager or supervisor; also called an autonomous workgroup.
The members of the team are empowered to establish their own goals and practices. Autonomous teams are sometimes used to manage production workcells and develop new products.
See New Product Development (NPD).
autonomous workgroup – See autonomous team.
availability – A measure used in the reliability and maintenance literature for the percentage of time that a product can be operated.
According to Schroeder (2007), availability is MTBF/(MTBF + MTTR), where MTBF is the mean time between failure and MTTR is the Mean Time to Repair.
See maintenance, Mean Time Between Failure (MTBF), Mean Time to Repair (MTTR), reliability.
Available-to-Promise (ATP) – A manufacturing planning and control term used to describe the number of units that can be promised to a customer at any point in time based on projected demand and supply.
In SAP, ATP is the quantity available to MRP for new sales orders and is calculated as stock + planned receipts – planned issues (http://help.sap.com).
See Master Production Schedule (MPS), Materials Requirements Planning (MRP).
average – See mean.
B
B2B – Business-to-business transactions between manufacturers, distributors, wholesalers, jobbers, retailers, government organizations, and other industrial organizations.
See B2C, dot-com, e-business, wholesaler.
B2C – Business-to-consumer transactions between a business and consumers.
See B2B, dot-com, e-business.
back loading – See backward loading.
back office – The operations of an organization that are not normally seen by customers; most often used in the financial services business context.
Back office operations handle administrative duties that are not customer facing and therefore often focus on efficiency. In the financial services industry, back office operations involve systems for processing checks, credit cards, and other types of financial transactions. In contrast, front office activities include customer-facing activities, such as sales, marketing, and customer service. Some sources consider general management, finance, human resources, and accounting as front office activates because they guide and control back office activities.
See e-business, human resources, line of visibility, service management.
back scheduling – A scheduling method that plans backward from the due date (or time) to determine the start date (or time); in project scheduling, called a backward pass; also called backward scheduling.
Back scheduling creates a detailed schedule for each operation or activity based on the planned available capacity. In project scheduling, the critical path method uses back scheduling (called a “backward pass”) to determine the late finish and late start dates for each activity in the project network. In contrast, backward loading plan backward from the due date but does not create a detailed schedule.
See Advanced Planning and Scheduling (APS), backward loading, Critical Path Method (CPM), forward scheduling, Master Production Schedule (MPS).
backflushing – A means of reducing the number of inventory transactions (and the related cost) by reducing the inventory count for an item when the order is started, completed, or shipped; also called explode-to-deduct and post deduct.
For example, a computer keyboard manufacturer has two alternatives for keeping track of the number of letter A’s stored in inventory. With the traditional approach, the firm counts the number of keys that are issued (moved) to the assembly area in the plant. This can be quite costly. In fact, it is possible that the cost of counting the inventory could exceed the value of the inventory. With backflushing, the firm reduces the letter A inventory count when a keyboard is shipped to a customer. The bill of material for the keyboard calls for one letter A for each keyboard; therefore, if the firm ships 100 keyboards, it should also ship exactly 100 letter A’s.
Backflushing gives an imprecise inventory count because of the delay between the time the items are issued to the shop floor and the time that the balance is updated. However, it can significantly reduce the shop floor data transaction cost. It is also possible to “backflush” labor cost.
The alternative to backflushing is direct issue, where material is pulled from stock according to the pick list for an order, deducted from on-hand inventory, and transferred to work in process until the order is complete.
The floor stock entry covers this topic in more detail.
See bill of material (BOM), cycle counting, floor stock, issue, job order costing, pick list, shop floor control.
backhaul – A transportation term for a load taken on the return trip of a transportation asset, especially a truck, to its origin or base of operations.
An empty return trip is called deadheading. A backhaul will pick up, transport, and deliver either a full or a partial load on a return trip from delivering another load. The first trip is sometimes known as a fronthaul.
See deadhead, logistics, repositioning.
backlog – The total amount of unfilled sales orders, usually expressed in terms of sales revenue or hours of work.
The backlog includes all orders (not just past due orders) accepted from customers that have not yet been shipped to customers. The backlog is often measured in terms of the number of periods (hours, days, weeks, or months) that would be required to work off the orders if no new work were received. The order backlog can disappear when economic conditions change and customers cancel their orders.
backorder – A customer order that has to wait because no inventory is available; if the customer is not willing to wait, it is a lost sale.
If a firm cannot immediately satisfy a customer’s order, the customer is asked to wait. If the customer is willing to wait, the order is called a backorder and is usually filled as soon as inventory becomes available.
When a product is not available but has been ordered from the supplier, it is said to be on backorder. The order backlog is the set of backorders at any point in time. The order backlog, therefore, is a waiting line (queue) of orders waiting to be filled. In a sense, an order backlog is an “inventory” of demand.
See allocated inventory, backlog, inventory position, on-hand inventory, stockout.
backward integration – See vertical integration.
backward loading – A planning method that plan backward from the due date to determine the start date; sometimes called back loading.
The word “loading” means that the plan is created in time buckets and is not a detailed schedule. For example, an executive needs to prepare for a trip in one month and “loads” each of the next four weeks with ten hours of work. Backward loading might fill up a time “bucket” (e.g., a half-day) until the capacity is fully committed. Backward loading is not the same as back scheduling because it does not create a detailed schedule.
See back scheduling, finite scheduling, load.
backward pass – See back scheduling.
backward scheduling – See back scheduling.
bait and switch – See loss leader.
balance sheet – A statement that summarizes the financial position for an organization as of a specific date, such as the end of the organization’s financial (fiscal) year; this statement includes assets (what it owns), liabilities (what it owes), and owners’ equity (shareholders’ equity).
The three essential financial documents are the balance sheet, income statement, and cash flow statement.
See financial performance metrics, income statement.
balanced scorecard – A strategy execution and reporting tool that presents managers with a limited number of “balanced” key performance metrics so they can assess how well the firm is achieving the strategy. ![]()
A balanced scorecard is a popular framework that translates a company’s vision and strategy into a coherent set of performance measures that was first proposed by Kaplan and Norton in a famous article in the Harvard Business Review (Kaplan & Norton 1992). Kaplan and Norton also wrote a number of other articles and books expanding the idea to strategic management (Kaplan & Norton 1996, 2000, 2004), strategic alignment (Kaplan & Norton 2006), and execution of strategy (Kaplan & Norton 2008).
A balanced business scorecard helps businesses evaluate how well they are meeting their strategic objectives. Kaplan and Norton (1992) propose four perspectives: financial, customer, internal, and learning and growth, each with a number of measures. They argue that the scorecard should be “balanced” between financial and nonfinancial measures and balanced between the four perspectives. This author has broadened the view of the balanced scorecard to five types of balance. These are shown in the table below.
Five types of balance between metrics
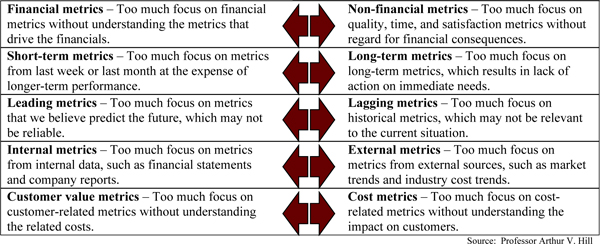
The balanced scorecard includes measures of performance that are lagging indicators (return on capital, profit), current indicators (cycle time), and leading indicators (customer satisfaction, new product adoption rates). The following figure illustrates the balanced scorecard as developed by Kaplan and Norton.
See alignment, benchmarking, causal map, corporate portal, cycle time, dashboard, DuPont Analysis, financial performance metrics, gainsharing, hoshin planning, inventory turnover, Key Performance Indicator (KPI), leading indicator, learning curve, learning organization, Management by Objectives (MBO), mission statement, operations performance metrics, operations strategy, strategy map, suboptimization, supplier scorecard, Y-tree.
Baldrige Award – See Malcolm Baldrige National Quality Award.
balking – The refusal of an arriving customer to join a queue and wait in line.
When customers arrive to a system and find a long line, they will often exit the system. Customers are said to balk when they leave the system. A queuing system with an average arrival rate that is dependent upon the length of the queue is called a state-dependent arrival process.
See queuing theory.
bar chart – A graph with parallel thick lines with lengths proportional to quantities; also called a bar graph and histogram.
Bar charts can be displayed either horizontally or vertically. A Gantt Chart is an example of a horizontal bar chart. Vertical bar charts (also known as histograms) are particularly helpful for frequency data. A bar chart can only be created for discrete data (e.g., age as an integer) or categorical data (e.g., country of origin). Continuous data can be converted into discrete “buckets” or “bins” so a bar chart can be created.
See binomial distribution, Gantt Chart, histogram, Pareto Chart.
barcode – Information encoded on parallel bars and spaces that can be read by a scanner and then translated into an alphanumeric identification code.

Barcodes always identify the product but sometimes also include additional information, such as the quantity, price, and weight. Barcodes are particularly well suited for tracking products through a process, such as retail transactions. A popular example is the UPC code used on retail packaging. Radio Frequency Identification (RFID) is a newer technology that is replacing barcodes in many applications.

Barcodes provide many business benefits, including reducing transaction cost and providing information that can be used to improve service levels, reduce stockouts, and reduce unnecessary inventory.
Barcodes come in many varieties. The 2D (two-dimensional) barcode is in the form of bars and spaces, normally in a rectangular pattern. In contrast, a 3D (three-dimensional) barcode looks like a group of random black boxes scattered across a white background. 3D barcodes are often used in environments where labels cannot be easily attached to items.
A barcode reader (scanner, wand) is a device that scans a barcode to record the information.
The Wikipedia article on barcodes provides detailed information on types of barcodes and barcode standards.
See Automated Data Collection (ADC), Electronic Product Code (EPC), part number, Radio Frequency Identification (RFID), Universal Product Code (UPC).
barter – The exchange of goods without using cash or any other financial medium.
For example, oil is sometimes bartered for military equipment in the Persian Gulf.
barriers-to-entry – See core competence, switching cost.
base stock system – See order-up-to level.
Bass Model – A well-known approach for modeling the sales pattern for the life cycle of a new product introduction developed by Professor Frank Bass.
The demand for a new music title or any other type of new product follows a similar demand pattern through its product life cycle, with early growth, maturity, and finally decline. The Bass Model (and its many extensions) has inspired many academic research papers and has been used in many applications. The basic idea is that some products take off right away due to the early adopters (the “innovators”) who immediately make purchases. The “imitators” do not buy right away, but buy soon after they see others with the product. The model requires three parameters:
m Total market potential, which is the total number of unit sales that we expect to sell over the life of the product. This is the sum of the demand during the product life and is also the area under the curve.
p Innovation coefficient, which primarily affects the shape of the curve during the beginning of the life cycle. This parameter is also called the external influence, or the advertising effect.
q Imitation coefficient, which primarily affects the shape of the curve after the peak of the product life cycle. This parameter is also called the internal influence, or word-of-mouth effect.
In summary, m is the scale parameter and p and q are the shape parameters. With these three parameters, the Bass Model can predict almost any realistic new product introduction demand pattern. The challenge is to estimate m, p, and q for a new product introduction. The best approach for handling this problem is to predict m based on marketing research and to select the p and q parameters based on experience with similar products.
The basic idea of the Bass Model (Bass 1969) is that the probability of an initial purchase made at time t is a linear function of the proportion of the population that has already purchased the product. Define F(t) as the fraction of the installed base through time t and f(t) = dF(t)/dt as the rate of change in the installed base fraction at time t. The fundamental model is given by f(t)/(1 − F(t)) = p + qF(t). Assuming that F(0) = 0 gives ![]() and
and ![]() . From this, the cumulative sales through period t can be estimated as S(t) = mF(t) and the rate of change in the installed base at time t is dS(t)/dt = mf (t). The time of peak sales is t* = ln(q/p)/(p + q). The Bass Model has been extended in many ways, but those extensions are outside the scope of this encyclopedia. Mahajan, Muller, Eitan, and Bass (1995) provided a summary of many of the extensions of the Bass Model.
. From this, the cumulative sales through period t can be estimated as S(t) = mF(t) and the rate of change in the installed base at time t is dS(t)/dt = mf (t). The time of peak sales is t* = ln(q/p)/(p + q). The Bass Model has been extended in many ways, but those extensions are outside the scope of this encyclopedia. Mahajan, Muller, Eitan, and Bass (1995) provided a summary of many of the extensions of the Bass Model.
Historical data can be used to estimate the parameters p and q. Define N(t) as the cumulative historical sales through time t. Simple linear regression can now be run using the model y(t) = a + bN(t) − cN(t)2 and them m, p, and q can be estimated with these equations solved in this order ![]() , p = a/m, and q = CM. The average value of p is around 0.03, but it is often less than 0.01. The value of q is typically in the range (0.3, 0.5) with an average around 0.38.
, p = a/m, and q = CM. The average value of p is around 0.03, but it is often less than 0.01. The value of q is typically in the range (0.3, 0.5) with an average around 0.38.
The example below starts with the empirical data in the table and finds the optimal parameters m = 87, p = 0.100, and q = 0.380. The graph for this curve is shown on the right.


The logistic curve entry presents simpler models, such as the logistic, Richards Curve, and Gompertz Curve.
See adoption curve, all-time demand, forecasting, linear regression, logistic curve, network effect, product life cycle management.
batch – See lotsize.
batch flow – See batch process.
batch picking – A warehousing term for an order picking method where multiple orders are picked by one picker in one pass and then later separated by order.
See Automated Storage & Retrieval System (AS/RS), carousel, picking, wave picking, zone picking.
batch process – A system that produces a variety of products but produces them in groups of identical items.
Unlike a continuous process, a batch process is characterized by (1) a system that can make more than one product or product type, (2) setups that are used to change the process to make a different product, and (3) workin-process inventory between steps in the process due to batchsizes and contention for capacity.
A batch process is often associated with a job-shop that has general purpose equipment arranged in a process layout. In a process layout, the location of the equipment is not dictated by the product design but rather by groups of similar general purpose equipment that share a common process technology or required skill.
Most batch processes require significant setup time and cost with each batch. In the lean perspective, setup time is waste and reducing setup time and cost is often considered a strategic priority. If a system is dedicated to producing only a single product, it has no setups or changeovers and is a continuous process.
Examples of batch processes include (1) apparel manufacturing, where each batch might be a different style or size of shirt, (2) paint manufacturing, where different colors of paint are mixed in different batches, and (3) bottle filling operations, where each batch is a different liquid (e.g., soft drink).
See batch-and-queue, continuous process, discrete manufacturing, job shop, sequence-dependent setup time, setup, setup cost, setup time.
batch-and-queue – A negative term often used by promoters of lean manufacturing to criticize manufacturing operations that have large lotsizes, large queues, long queue times, long cycle times, and high work-in-process.
One-piece flow is a better method because it eliminates batches, which reduces the average time in queue and the average number in queue (assuming that no additional setup time is required).
See batch process, continuous flow, lean thinking, one-piece flow, overproduction, value added ratio.
batchsize – See lotsize.
bathtub curve – A U-shaped curve used in reliability theory and reliability engineering that shows a typical hazard function with products more likely to fail either early or late in their useful lives. ![]()
Reliability engineers have observed population failure rates as units age over time and have developed what is known as the “bathtub curve.” As shown in the graph below4, the bathtub curve has three phases:
Infant failure period – The initial region begins at time zero, when a customer first begins to use the product. This region is characterized by a high but rapidly decreasing failure rate and is known as the early failure, or infant mortality period. Immediate failures are sometimes called “dead on arrival,” or DOA.
Intrinsic failure period – After the infant mortality period has passed, the failure rate levels off and remains roughly constant for the majority of the useful life of the product. This long period with a fairly level failure rate is also known as the intrinsic failure period, stable failure period, or random failure period. The constant failure rate level is called the intrinsic failure rate.
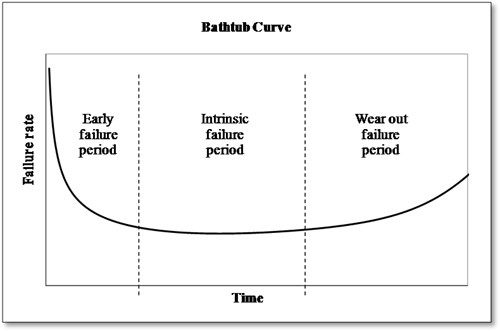
End of life wear out period – Finally, if units from the population remain in use long enough, the failure rate begins to increase again as materials wear out and degradation failures occur at an increasing rate. This is also known as the wear out failure period.
For example, a newly purchased light bulb will sometimes fail when you first install it (or very shortly thereafter). However, if it survives the first few hours, it is likely to last for many months until it fails. Another example is human life. The death rate of infants is relatively high, but if an infant makes it through the first couple of weeks, the mortality rate does not increase very much until old age.
The Weibull distribution is a flexible life distribution model that can be used to characterize failure distributions in all three phases of the bathtub curve. The basic Weibull distribution has two parameters, the shape and scale parameters. The shape parameter enables it to be applied to any phase of the bathtub curve. A shape parameter less than one models a failure rate that decreases with time, as in the infant mortality period. A shape parameter equal to one models a constant failure rate, as in the normal life period. A shape parameter greater than one models an increasing failure rate, as during wear-out. This distribution can be viewed in different ways, including probability plots, survival plots, and failure rate versus time plots (the bathtub curve).
The bathtub curve can inform decisions regarding service parts. However, the need for service parts at the end of the product life cycle is affected by retirement (removal) of the equipment in the field. Although the bathtub curve suggests that the demand for service parts at the end of life might increase, this effect is mitigated by the retirement of machines from the field, making it difficult to predict the demand for service parts at the end of the product life cycle.
See maintenance, Mean Time Between Failure (MTBF), newsvendor model, Poisson distribution, product life cycle management, reliability, service parts, Total Productive Maintenance (TPM), Weibull distribution.
Bayes’ Theorem – An important probability theory concept that expresses the conditional probability of event A in terms of the conditional and marginal probabilities of events A and B.
Bayes’ Theorem stated mathematically is ![]() , where P(A|B) is the probability of event A given event B, P(B|A) is the probability of event B given event A, and P(A) and P(B) are the unconditional (marginal) probabilities of events A and B.
, where P(A|B) is the probability of event A given event B, P(B|A) is the probability of event B given event A, and P(A) and P(B) are the unconditional (marginal) probabilities of events A and B.
A popular example is the North American TV game show “Let’s Make a Deal,” which gave contestants the option of selecting one of three doors (red, green, and blue), where only one door had a prize hidden behind it. After the contestant selected a door, the game show host opened another door where the prize was not hidden. The host then asked the contestant if he or she wanted to select a different door. In this game context, many people incorrectly conclude that the chances are 50-50 between the two unopened doors and that the contestant has no reason to select a different door.
To better understand the probabilities involved in this game, define events R (the prize is behind the red door), G (the prize is behind the green door), and B (the prize is behind the blue door). When the prize is randomly assigned to a door, then P(R) = P(G) = P(B) = 1/3. To simplify exposition, assume that the contestant has selected the red door and that the host has opened the blue door to show that the prize is not behind it (event SB). Without any prior knowledge, the probability that the host will show the blue door is P(SB) = 1/2. If the prize is actually behind the red door, the host is free to pick between the green and blue doors at random (i.e., P(SB|R) = 1/2). If the prize is actually behind the green door, the host must pick the blue door (i.e., P(SB|G) = 1). If the prize is behind the blue door, the host must pick the green door (i.e., P(SB|B) = 0). Given that the host showed the blue door, Bayes’ Theorem shows:
Probability of the prize behind the red door: ![]()
Probability of the prize behind the green door: ![]()
Probability of the prize behind the blue door: ![]()
Therefore, in this situation, the contestant should always choose the green door. More generally, the contestant should always change to the other door. Another way of looking at this problem is to understand that the contestant had a 1/3 chance of being right in selecting the red door. When the blue door was shown to not have the prize, the conditional probability of the red door having the prize is still 1/3, but the probability of the green door having the prize is now 2/3. See http://en.wikipedia.org/wiki/Monty_Hall_problem for more details.
See decision tree.
beer game – A popular simulation game to help people understand the bullwhip problem in supply chains and learn how to deal with the problem in practical ways.
The beer game was designed by Professor John Sterman (1992) at MIT to demonstrate the bullwhip in supply chains. It emphasizes the importance of information flow along the supply chain and shows how humans tend to overreact and overcompensate for small changes in demand, which results in magnified fluctuations in demand that are passed down the supply chain.
The class is divided into teams of four players at each table. The four players include a retailer, warehouse, distributor, and factory. The “products” are pennies, which represent cases of beer. Each player maintains an inventory and keeps track of backorders. Players receive orders from suppliers after a one-week delay. The instructor privately communicates the demand to the retailer, with a demand for four cases per week for the first four weeks and eight cases per week for the remainder of the game.
The results of the game are fairly predictable, with nearly all teams falling into the trap of wild oscillations. At the end of the game, the instructor asks the factory players to estimate the actual demand history. They usually guess that demand varied widely throughout the game. Students are often surprised to learn that demand was steady except for the initial jump. The teaching points of the game revolve around how the internal factors drive the demand variations and about how this “bullwhip” can be managed.
See bullwhip effect.
benchmarking – Comparing products or processes to a standard to evaluate and improve performance. ![]()
Finding comparable numerical comparisons between two or more firms is very difficult because no two organizations, processes, or products are truly comparable. Although knowing that two processes (or products) have different performance might help an organization prioritize its improvement efforts, it does not help the organization know how to improve. Real improvement only comes when a better process or product is understood and that information is used by the organization to improve its processes and products.
Many consulting firms have moved away from the term “benchmarking” because it focused more on comparing numbers (benchmarks) than on understanding and improving processes. Many of these consulting firms then started to use the term “best practices” instead of benchmarking. However, due to the difficulty of knowing if a process or product is truly the best, most consulting firms now use the term “leading practices.”
Product benchmarking compares product attributes and performance (e.g., speed and style) and process benchmarking compares process metrics, such as cycle time and defect rates. Internal benchmarking sets the standard by comparing products and processes in the same firm (e.g., another department, region, machine, worker, etc.). In contrast, external benchmarking sets the standard based on products and processes from another firm. Competitive benchmarking is a type of external benchmarking that sets the standard based on a competitor’s products or processes. Of course, no competitor should be willing to share process information. Informal benchmarking is done by finding a convenient benchmarking partner (often in a warm climate) who is willing to share information. In contrast, formal benchmarking involves mapping processes, sharing process maps, comparing numbers, etc.
Many professional trade organizations provide benchmarking services. For example, several quality awards, such as the Deming Award in Japan, the European Quality Award in Europe, and the Malcolm Baldrige Award in the U.S., serve as benchmarks for quality performance. The PRTM consulting firm and other firms provide benchmarking consulting using the SCOR framework.
See balanced scorecard, best practices, entitlement, lean sigma, Malcolm Baldrige National Quality Award (MBNQA), operations performance metrics, process improvement program, process map, SCOR Model, supplier scorecard, Y-tree.
Bernoulli distribution – A discrete probability distribution that takes on a value of x = 1 (success) with probability p and value of x = 0 (failure) with probability q = 1 − p.
Parameter: The probability of success, p.
Probability mass function: If X is a random variable with the Bernoulli distribution, then P(X = 1) = 1 − P(X = 0) = p = 1 − q.
Statistics: The Bernoulli has range (0, 1), mean p, and variance p(1 − p).
Excel simulation: The inverse transform method can be used. If RAND() < p then X = 1; otherwise, X = 0.
In Excel, this is IF(RAND()< p,1,0).
Other distributions: The sum of n independent identically distributed Bernoulli random variables with probability p has the binomial distribution with parameters n and p.
History: The Bernoulli distribution was named after Swiss mathematician Jacob Bernoulli (1654-1705).
See binomial distribution, negative binomial distribution, p-chart, probability distribution, probability mass function.
best practices – A set of activities that has been demonstrated to produce very good results; the best-known performing process, methodology, or technique.
The term “best practices” is often used in the context of a multi-divisional or multi-location firm that has similar processes in many locations. A best practice is developed by some consensus process (such as the nominal group technique) and then shared across the organizational boundaries.
For example, Wells Fargo (a large bank in North America) has similar processes in many locations. As a result, Wells Fargo is always looking to identify, document, and implement the “best practice” for each process throughout the system.
The challenge, of course, is to identify what is truly the best performing process in light of imperfect information caused by differences in performance measures, process environments, process implementations, and local organizational cultures. To be more accurate, many consulting firms now use the term “leading practice” instead of best practice.
The concept of best practices is closely related to benchmarking and is also closely related to Frederick Taylor’s (1911) notion of “one best method” for each process.
See benchmarking, scientific management.
beta distribution – A continuous probability distribution used for task times in the absence of data or for a random proportion, such as the proportion of defective items.
Historically, the PERT literature recommended that task times be modeled with the beta distribution with mean (a + 4m + b)/6 and variance (b − a)2/36, where the range is (a, b) and m is the mode. The PERT entry critically reviews this model.
Parameters: Shape parameters α > 0 and β > 0.
Density and distribution functions: The beta density function for x > 0 is f(x) = xα−1(1 − x)β−1/B(α,β), where B(α,β) = Γ(α)Γ(β)/Γ(α + β) is the beta function and Γ(α) is the gamma function (not to be confused with the gamma distribution). The beta distribution function has no closed form.
Statistics: The statistics for the beta include range [0,1], mean α/(α + β), variance αβ/((α + β)2 (α + β + 1)), and mode (α − 1)/(α + β − 2) if α > 1 and β > 1; 0 and 1 if α < 1 and β < 1; 0 if α < 1 and β ![]() 1 or α = 1 and β > 1; 1 if α
1 or α = 1 and β > 1; 1 if α ![]() 1 and β < 1; β > 1 or α > 1 and β = 1; the mode does not uniquely exist if α = β = 1.
1 and β < 1; β > 1 or α > 1 and β = 1; the mode does not uniquely exist if α = β = 1.
Graph: The graph on the right is the beta probability density function (pdf) with parameters (α, β) = (1.5, 5.0).
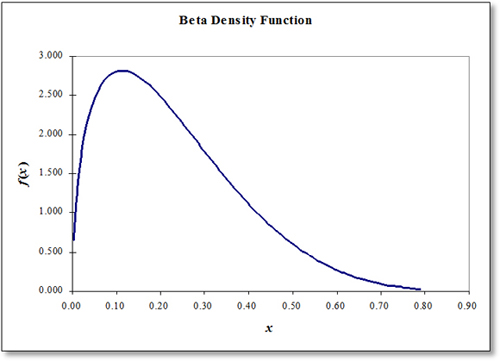
Parameter estimation: Law and Kelton (2000) noted that finding the Maximum Likelihood Estimates for the two parameters requires solving equations involving the digamma function with numeric methods (a non-trivial task) or referencing a table, which may lack accuracy. The method of moments estimates the two parameters based on the sample mean ![]() and sample variance s2 using
and sample variance s2 using ![]() and
and ![]() .
.
Excel: Excel provides the distribution function BETADIST(x, α, β) and the inverse function BETAINV(p, α, β), but does not provide a beta density function. The beta density function in Excel is x^(α-1)*(1 - x)^(β-1)/EXP(GAMMALN(α)+GAMMALN(β)-GAMMALN(α+ β)). For the beta distribution transformed to range [A, B], use BETADIST(x, α, β, A, B). The gamma function is EXP(GAMMALN(α)). In Excel 2010, the beta distribution related functions are renamed BETA.DIST and BETA.INV, but still use the same parameters.
Excel simulation: In an Excel simulation, beta random variates can be generated with the inverse transform method using x = BETAINV(1-RAND(), α, β).
See beta function, gamma distribution, gamma function, probability density function, probability distribution, Project Evaluation and Review Technique (PERT), Weibull distribution.
beta function – An important function used in statistics; also known as the Euler integral.
The beta function is defined as  dt for x > 0 and y > 0. The incomplete beta function is
 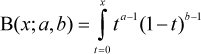 dt and the regularized incomplete beta function is Ix (a,b) B(x;a,b)/B(a,b). The beta and gamma functions are related by B(x,y) = Γ(x)Γ(y)/Γ(x + y). In Excel, B(x, y) can be computed using EXP(GAMMALN(x) + GAMMALN(y) – GAMMALN(x+ y)).
See beta distribution, gamma function, negative binomial distribution.
beta test – An external test of a pre-production product, typically used in the software development context.
A beta test is an evaluation of new software by a user under actual work conditions and is the final test before release to the public. The purpose of a beta test is to verify that the product functions properly in actual customer use. The term is often used in the context of software released to a limited population of users for evaluation before the final release to customers. In contrast, the alpha test is the first test conducted by the developer in test conditions.
See agile software development, pilot test, prototype.
bias – (1) In a statistics context: The difference between the expected value and the true value of a parameter. (2) In a forecasting context: An average forecast error different from zero. (3) In an electrical engineering context: A systematic deviation of a value from a reference value. (4) In a behavioral context: A point of view that prevents impartial judgment on an issue.
See forecast bias, forecast error metrics.
bid rigging – A form of fraud where a contract is promised to one party even though for the sake of appearance several other parties also present a bid.
This form of collusion is illegal in most countries. It is a form of price fixing often practiced where contracts are determined by a request for bids, a common practice for government construction contracts. Bid rigging almost always results in economic harm to the organization seeking the bids. In the U.S., price fixing, bid rigging, and other forms of collusion are illegal and subject to criminal prosecution by the Antitrust Division of the U.S. Department of Justice.
See antitrust laws, bribery, predatory pricing, price fixing.
big box store – A retailer that competes through stores with large footprints, high volumes, and economies of scale.
Examples of big box stores in North America include Home Depot, Walmart, OfficeMax, and Costco. Carrefour is an example in western Europe. Historically, these big box stores have been built in the suburbs of large metropolitan areas where land was less expensive.
See category killer, distribution channel, economy of scale.
bill of lading – A transportation/logistics term for a contract between the shipper and the carrier.
The bill of lading (BOL) serves many purposes, such as (1) providing a receipt for the goods delivered to the carrier for shipment, (2) describing the goods, including the quantity and weight, (3) providing evidence of title, (4) instructing the carrier on how the goods should be shipped, and (5) providing a receiving document for the customer; sometimes abbreviated B/L.
See consignee, manifest, packing slip, purchasing, receiving, waybill.
bill of material (BOM) – Information about the assemblies, subassemblies, parts, components, ingredients, and raw materials needed to make one unit of a product; also called bill of materials, bill, product structure, formula, formulation, recipe, or ingredients list. ![]()
The item master (part master or product master) is a database that provides information for each part (item number, stock keeping unit, material, or product code). A record in the item master may include the item description, unit of measure, classification codes (e.g., ABC classification), make or buy code, accounting method (LIFO or FIFO), leadtime, storage dimensions, on-hand inventory, on-order inventory, and supplier.
The BOM provides the following information for the relationships between items in the item master.
• BOM structure – The hierarchical structure for how the product is fabricated or assembled through multiple levels. In a database, this is a double-linked list that shows the “children” and the “parents” for each item.
• Quantity per – The quantity of each component required to make one unit of the parent item.
• Yield – Yield information is used to inflate production quantities to account for yield losses.
• Effectivity date – This indicates when an item is to be used or removed from a BOM.
A simple multi-level BOM product structure for a toy car is shown below. The final product (Item 1, the car assembly) is at level 0 of the BOM. Level 1 in this example has the body and the axle subassembly. Note that plastic is used for both items 2 and 4, but is planned at level 3 rather than at level 2. If plastic were planned at level 2, it would have to be planned again at level 3 when the gross requirements for item 4 were created. Each item should be planned at its “low level code.”
Simple bill of material (product structure) for a toy car
A single-level BOM shows only the immediate components needed to make the item, whereas a multi-level BOM shows all items. An indented BOM is a listing of items where “child” items are intended (moved to the right). The table below is a simple example of the indented bill of material for the above product structure.
Indented bill of material

A BOM explosion shows all components in the BOM, whereas a where-used report (sometimes called a BOM implosion) shows a list of the items that use an item. A single-level where-used report lists the parent items and quantity per for an item. An indented where-used report lists the lowest-level items on the far left side and indents the parent items one place to the right. Each higher-level parent is indented one additional place to the right until the highest-level item (level 0) is reached. Single-level pegging is like a single-level where-used report but it only points to higher-level items that have requirements. If a BOM has high commonality, items are used by many parent items.
A planning bill of material, sometimes called a percentage BOM, super BOM, or pseudo BOM, can be used to plan a family of products using percentages for each option. For example, in the example below, a car manufacturer has historically sold 20% of its cars with radio A, 30% with radio B, and 50% with radio C. The firm forecasts overall sales for cars and uses a planning BOM to drive Materials Requirements Planning (MRP) to plan to have about the right number of radios of each type in inventory when needed. A Final Assembly Schedule (FAS) is then used to build cars to customer order.
Planning bill of material
A BOM can define a product as it is designed (engineering BOM), as it is built (manufacturing BOM), or as it is ordered by customers (sales BOM).
The Master Production Scheduling (MPS) entry discusses several types of BOM structures and the Materials Requirement Planning (MRP) entry explains how the BOM is used in the planning process.
See ABC classification, backflushing, bill of material implosion, Business Requirements Planning (BRP), commonality, dependent demand, effectivity date, Engineering Change Order (ECO), Enterprise Resources Planning (ERP), Final Assembly Schedule (FAS), formulation, low level code, Master Production Schedule (MPS), Materials Requirements Planning (MRP), part number, pegging, phantom bill of material, product family, routing, shop packet, VAT analysis, Warehouse Management System (WMS), where-used report, yield.
bill of material implosion – A manufacturing term used to describe the process of indentifying the “parent” item (or items) for an item in the bill of material; the opposite of a bill of material explosion; also called a where-used report.
See bill of material (BOM), pegging, where-used report.
bill of resources – A list of the machine time and labor time required to make one unit of a product.
The bill of resources should only include a few key resources (i.e., those resources that normally have the tightest capacity constraints). Rough Cut Capacity Planning (RCCP) uses the bill of resources to convert the Master Production Schedule (MPS) into a rough cut capacity plan.
See capacity, Master Production Schedule (MPS), Rough Cut Capacity Planning (RCCP), Theory of Constraints (TOC).
bimodal distribution – A statistics term for a probability distribution with two identifiable peaks (modes).
A bimodal distribution is usually caused a mixture of two different unimodal distributions. The example on the right shows a histogram for the mixture of two normally distributed random variables with means 14 and 24. (This is a probability mass function because the graph shows frequencies for integer values.)
See probability distribution, probability mass function.
bin – See warehouse.
binary logistic regression – See logistic regression.
binomial distribution – A discrete probability distribution used for the number of successes (or failures) in n independent trials with probability p for success in each trial.
The binomial is a useful tool for quality control purposes.
Probability mass and cumulative distribution functions: The binomial probability mass function is 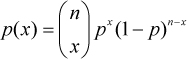 , where
 ![]() is the binomial coefficient, which is the number of combinations of n things taken x at a time. The cumulative distribution function (CDF) is then
is the binomial coefficient, which is the number of combinations of n things taken x at a time. The cumulative distribution function (CDF) is then  , where
 ![]() x
x![]() is the greatest integer less than or equal to x.
is the greatest integer less than or equal to x.
Graph: The graph on the right is the binomial probability mass function with n = 20 trials of a fair coin (p = 0.5).
Statistics: Range {0, 1, .... , n}, mean np, variance np(1 − p), and mode ![]() p(n + 1)
p(n + 1) ![]() or
or ![]() p(n + 1)
p(n + 1)![]() –1.
–1.
Excel: In Excel, the probability mass function is BINOMDIST(x, n, p, FALSE) and the probability distribution function is BINOMDIST(x, n, p, TRUE). Excel does not have an inverse function for the binomial distribution.
Excel simulation: An Excel simulation might use the inverse transform method to generate binomial random variates using a direct search.
Relationships with other distributions: The Bernoulli distribution is Binomial(1, p). The binomial is the sum of n Bernoulli random variables (i.e., if X1, X2, ... , Xn are n independent identically distributed Bernoulli random variables with success probability p, the sum ![]() , is binomial). The normal distribution can be used to approximate the binomial when np
, is binomial). The normal distribution can be used to approximate the binomial when np ![]() 10 np(1 − p)
10 np(1 − p) ![]() 10. However, a continuity correction factor of 0.5 should be used, which means that P(X = x) for the binomial is estimated using F(X + 0.5) – F(X − 0.5) for the normal. The normal approximation is particularly important for large values of n. The Poisson distribution can be used to approximate the binomial with large n and small p (i.e., n
10. However, a continuity correction factor of 0.5 should be used, which means that P(X = x) for the binomial is estimated using F(X + 0.5) – F(X − 0.5) for the normal. The normal approximation is particularly important for large values of n. The Poisson distribution can be used to approximate the binomial with large n and small p (i.e., n ![]() 20 and p
20 and p ![]() 0.05 or n
0.05 or n ![]() 100 and np
100 and np ![]() 10). The binomial is a good approximation for the hypergeometric distribution when the size of the population is much larger than the sample size.
10). The binomial is a good approximation for the hypergeometric distribution when the size of the population is much larger than the sample size.
See bar chart, Bernoulli distribution, combinations, hypergeometric distribution, normal distribution, p-chart, Poisson distribution, probability distribution, probability mass function.
Black belt – See lean sigma.
blanket order – See blanket purchase order, purchase order (PO).
blanket purchase order – A contract with a supplier that specifies the price, minimum quantity, and maximum quantity to be purchased over a time period (e.g., one year); sometimes called a blanket or standing order.
Blanket orders usually do not state specific quantities or dates for shipments. Instead, purchase orders (releases) are placed “against” the blanket order to define the quantity and due date for a specific delivery. The advantage of a blanket purchase order for both the customer and the supplier is that it locks in the price so it does not need to be renegotiated very often. The supplier usually gives the customer a quantity discount for the blanket order and may also be able to provide the customer with a reduced leadtime and better on-time performance. Any company representative who knows the purchase order number can purchase items until the value of the blanket order has been exceeded. Providing a blanket order to a supplier may reduce the leadtime and improve on-time delivery.
See on-time delivery (OTD), purchase order (PO), purchasing, quantity discount.
blending problem – See linear programming (LP).
blind count – An inventory counting practice of not giving counters the current on-hand inventory balance.
With a blind count, the counter is given the item number and location but no information about the count currently in the database. This approach avoids giving counters a reference point that might bias their counts.
See cycle counting.
blocking – The lean practice of not allowing a process to produce when an output storage area is full.
Examples of output storage areas include a container, cart, bin, or kanban square. A kanban square is rectangular area on a table or floor marked with tape. Blocking is good for non-bottleneck processes because it keeps them from overproducing (i.e., producing before the output is needed). Blocking avoids overproduction and keeps the total work-in-process inventory down to a reasonable level. Blocking for a bottleneck process is bad because it causes the system to lose valuable capacity. Remember that an hour lost on the bottleneck is an hour lost for the entire system. Starving and blocking are often discussed in the same context.
See CONWIP, kanban, lean thinking, starving, Theory of Constraints (TOC), Work-in-Process (WIP) inventory.
blow through – See phantom bill of material.
blue ocean strategy – A business strategy that finds new business opportunities in markets that are not already crowded with competitors.
Kim and Mauborgne (2005), both professors at INSEAD in France, communicated their concept by first describing the traditional “red ocean strategy,” where the ocean is blood red with competitors. In contrast, the blue ocean strategy seeks to avoid competing in an existing market space and instead seeks to create an uncontested market space. This approach does not attempt to “beat the competition,” but to make the competition irrelevant and create and capture new demand. Those who have been successful with this strategy have found that they can command good margins, high customer loyalty, and highly differentiated products.
Examples of strategic moves that created blue oceans of new, untapped demand:
• Nintendo Wii
• NetJets (fractional Jet ownership)
• Cirque du Soleil (circus reinvented for the entertainment market)
• Starbucks (coffee as low-cost luxury for high-end consumers)
• eBay (online auctioning)
• Sony Walkman (personal portable stereos)
• Hybrid and electric automobiles
• Chrysler minivan
• Apple iPad
• Dell’s built-to-order computers
See operations strategy.
BOL – See bill of lading.
BOM – See bill of material (BOM).
bonded warehouse – See warehouse.
booking curve – A graph used to show the expected cumulative demand for a scheduled (booked) service (such as an airline) over time and compare it to the actual cumulative bookings (demand); sometimes called the sales booking curve.

Source: Professor Arthur V. Hill
A booking curve is an important yield management tool that guides decision makers with respect to pricing and capacity allocation as the service date (e.g., date of departure) draws near. The graph on the right shows a typical booking curve for an airline. Note that the x-axis counts down the number of days until departure. (Some organizations draw the curve with the x-axes counting up from a negative value.) The middle dotted line is the expected cumulative demand. In this example, the expected cumulative demand declines slightly on the day of departure. This could be caused by “no-shows” and last-minute cancellations. The heavy line is the actual cumulative demand from 17 days before departure to 6 days before departure.
People involved in yield management track the actual cumulative demand and compare it to the expected cumulative demand on the booking curve. When the actual cumulative demand is outside the upper or lower control policy limits (shown in the example with dashed lines), decision makers might intervene to either change prices or reallocate capacity. For instance, in the example above, the actual cumulative demand is above the expected cumulative demand and above the control limits. This suggests that decision makers should raise the price or open up more capacity to try to “capture” more revenue.
See bookings, elasticity, yield management.
bookings – The sum of the value of all orders received (but not necessarily shipped) after subtracting all discounts, coupons, allowances, and rebates.
Bookings are recorded in the period the order is received, which is often different from the period the product is shipped and also different from the period the sales are recorded.
See booking curve, demand.
BOR – See bill of resources.
bottleneck – Any system constraint that holds the organization back from greater achievement of its goals. ![]()
In a system, a bottleneck is any resource that has capacity less than the demand placed on it. Goldratt (1992), who developed the theory of constraints, expanded this definition to include any philosophies, assumptions, and mindsets that limit a system from performing better. When the bottleneck is the market, the organization can achieve higher profits by growing the market by offering better products and services.
See capacity, Herbie, Theory of Constraints (TOC), transfer batch, utilization.
bounded rationality – The concept that human and firm behavior is limited by partial information and is unable to thoroughly evaluate all alternatives.
Many models in the social sciences and in economics assume that people and firms are completely rational and will always make choices that they believe will achieve their goals. However, Herbert Simon (1957) pointed out that people are only partly rational and often behave irrationally in many ways. Simon noted that people have limits in formulating and solving complex problems and in processing (receiving, storing, retrieving, transmitting) information. As a result, people and firms often use simple rules (heuristics) to make decisions because of the complexity of evaluating all alternatives.
See paradigm, satisficing.
box and whisker diagram – See box plot.
box plot – A simple descriptive statistics tool for graphing information to show the central tendency and dispersion of a random variable; also known as a boxplot, box-and-whisker diagram, and Tukey box plot.
As shown in the simple example below, a box plot shows five values: the smallest value (the sample minimum), lower quartile, median, upper quartile, and largest observation (sample maximum). A box plot may also indicate outliers. The endpoints of the line are usually defined as the smallest and largest values not considered to be outliers; however, these endpoints could be defined as the lowest and highest values within 1.5 IQR, where IQR is the interquartile range. Some box plots have an additional dot or line through the box to show the mean.
Box plot example
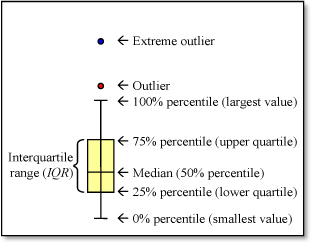
See interquartile range, mean, median, range.
boxcar – An enclosed railcar, typically 40 to 50 feet long used for packaged freight and bulk commodities.
See logistics.
Box-Jenkins forecasting – A sophisticated statistical time series forecasting technique.
Box-Jenkins methods develop forecasts as a function of the actual demands and the forecast errors at lagged time intervals using both moving average (MA) and autoregressive (AR) terms. The autoregressive model is a weighted sum of the past actual data. The AR model of order p is ![]() , where xt is the actual value in period t and
, where xt is the actual value in period t and  (with process mean μ). The constants ϕk are estimated using a least squares direct search where εt is the error in period t. The AR model can be written as a regression model using past values of a variable to predict future values.
The moving average is a weighted sum of the past forecast errors. The MA model of order q is ![]() , where μ is the process mean. The parameters θk are estimated using a least squares direct search where εt-k is the error in period t − k. The MA model can be written as a regression model using past errors to predict future values. The autoregressive-moving average model ARMA(p, q) combines these with
, where μ is the process mean. The parameters θk are estimated using a least squares direct search where εt-k is the error in period t − k. The MA model can be written as a regression model using past errors to predict future values. The autoregressive-moving average model ARMA(p, q) combines these with ![]() . Trend is handled with regular differencing
. Trend is handled with regular differencing ![]() and seasonality is handled with seasonal differencing
and seasonality is handled with seasonal differencing ![]() , where the time series has an L period season.
, where the time series has an L period season.
The Autoregressive Integrated Moving Average (ARIMA) model combines the AR and MA models with differencing. A forecasting model with p AR terms, d differencing terms, and q MA terms is shown as ARIMA(p, d, q). Simple exponential smoothing can be shown to be equivalent to the ARIMA(0,1,1) model.
The Box-Jenkins methodology has three main steps:
1. Specification – Select which lagged terms should be included in the model.
2. Estimation – Estimate the least squares parameters ϕk and θk for the model specified in the first step. A direct search method, such as the Marquardt search, is applied to accomplish this.
3. Diagnostic checking – Check the sample autocorrelations and sample partial autocorrelations5Should I take two more? for opportunities to improve the model by adding (or deleting) terms. A chi-square test is performed to determine if the partial correlations are significant. A correlogram graph is an important part of this process. The table to the right shows typical rules for interpreting the correlogram and adding new terms to a model.
Automatic Box-Jenkins model fitting software requires less human intervention. Multivariate Box-Jenkins models create forecasts based on multiple time series.
Box-Jenkins forecasting model identification
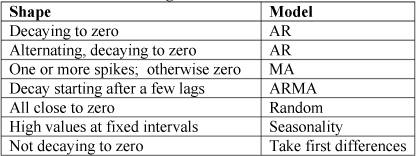
Some empirical studies have shown that Box-Jenkins forecasting models do not consistently perform better than much simpler exponential smoothing methods. Recommended references include Box, Jenkins, Reinsel, and Jenkins (1994) and Armstrong (2000).
See the Institute of Business Forecasting & Planning website (www.ibf.org) for more information.
See autocorrelation, chi-square goodness of fit test, Durbin-Watson statistic, econometric forecasting, exponential smoothing, forecast error metrics, forecasting, linear regression, moving average, seasonality, time series forecasting.
Box-Muller method – See normal distribution.
BPR – See Business Process Re-engineering (BPR).
brainstorming – Using a group of people to generate creative ideas to solve a problem.
Nearly all brainstorming approaches do not allow for debate during the brainstorming session. This is because it is important to allow a free flow of many ideas before evaluating any of them. The Nominal Group Technique (NGT) is one of the more popular structured approaches to brainstorming. In contrast, the devil’s advocate approach assigns the role of challenging ideas to a person or group of people. These challenges should not be allowed until after the brainstorming process has generated many creative ideas.
See affinity diagram, causal map, Delphi forecasting, devil’s advocate, focus group, force field analysis, forming-storming-norming-performing model, ideation, impact wheel, lean sigma, Nominal Group Technique (NGT), parking lot, process map, quality circles.
brand – A set of associations linked to a name, mark, or symbol associated with a product or service.

Schwinn Panther II from 1959
A brand is much like a reputation. It is a surrogate measure of quality built over many years and many contacts with the products, services, and people associated with the brand. However, a brand can be damaged quickly. For example, when Firestone tires were implicated in many SUV rollovers and deaths in the 1990s, the Firestone brand was damaged significantly.
Brands can be purchased and used for competitive advantage. For example, the Schwinn bike brand, founded in Chicago in 1891, ran into financial difficulty and was bought by Dorel Industries in 2004. Similarly, when Nordic Track faced financial problems, the brand was purchased by another firm. The Schwinn and Nordic Track brands continue to live on long after the firms that developed them went out of business.
See brand equity, category management, service guarantee.
brand equity – The value assigned to an organization’s product or service.
See brand.
breadboard – A proof-of-concept modeling technique that represents how a product will work, but not how a product will look.
See New Product Development (NPD), prototype.
break-even analysis – A financial calculation for determining the unit sales required to cover costs. ![]()
If the demand is below the break-even point, the costs will exceed the revenues. Break-even analysis focuses on the relationships between fixed cost, variable cost, and profit.
Break-even analysis is a rather crude approach to financial analysis. Most finance professors recommend using a better approach, such as net present value or Economic Value Added (EVA).
See financial performance metrics, payback period.
break-even point – See break-even analysis.
bribery – The practice of an individual or corporation offering, giving, soliciting, or taking anything of value in exchange for favors or influence; both the giver and receiver are said to be participating in bribery.
A bribe can take the form of money, gift, property, privilege, vote, discount, donation, job, promotion, sexual favor, or promise thereof. Bribes are usually made in secret and are usually considered dishonest. In most business and government contexts around the world, bribes are illegal. Examples of bribery include:
• A contractor kicks back part of a payment to the government official who selected the company for the job.
• A sales representative pays money “under the table” to a customer’s purchasing agent for selecting a product.
• A pharmaceutical or medical device company offers free trips to doctors who prescribe its drug or device.
• A sporting officiator or athlete influences the outcome of a sporting event in exchange for money.
Some people humorously assert that “the difference between a bribe and a payment is a receipt.” However, that is not necessarily true because a receipt does not make an illegal or dishonest transaction into a proper one.
What is considered a bribe varies by culture, legal system, and context. The word “bribe” is sometimes used more generally to mean any type of incentive used to change or support behavior. For example, political campaign contributions in the form of cash are considered criminal acts of bribery in some countries, while in the U.S. they are legal. Tipping is considered bribery in some societies, while in others it is expected. In some countries, bribes are necessary for citizens to procure basic medical care, security, transportation, and customs clearance. Bribery is particularly common in countries with under-developed legal systems.
In the purchasing context, bribes are sometimes used by agents of suppliers to influence buying authorities to select their supplier for a contract. These bribes are sometimes called kickbacks. In 1977, the U.S. Congress passed the Foreign Corrupt Practices Act, which made it illegal for an American corporation to bribe a foreign government official with money or gifts in hopes of landing or maintaining important business contacts. According to the act, all publicly traded companies must keep records of all business transactions even if the companies do not trade internationally to ensure that this act is not being violated. However, this act has exceptions, which are used by many U.S. corporations. For example, the act permits “grease payments,” which are incentives paid to foreign officials to expedite paperwork and ensure the receipt of licenses or permits.
The book of Proverbs in the Bible, written hundreds of years before Christ, condemns bribes: “A wicked man accepts a bribe in secret to pervert the course of justice” (Proverbs 17:23), and “By justice a king gives a country stability, but one who is greedy for bribes tears it down” (Proverbs 29:4).
See antitrust laws, bid rigging, predatory pricing, price fixing, purchasing.
broker – An individual or firm that acts as an intermediary (an agent) between a buyer and seller to negotiate contracts, purchases, or sales in exchange for a commission.
Brokers almost never take possession of the goods. A broker can represent either the buyer or the seller, and in some cases both. The broker’s compensation is commonly called a brokerage fee.
See distributor, gray market reseller, supply chain management, wholesaler.
Brooke’s Law – See project management.
brownfield – See greenfield.
BRP – See Business Requirements Planning.
buffer management – A Theory of Constraints (TOC) concept of strategically placing “extra” inventory or a time cushion in front of constrained resources to protect the system from disruption.
See Theory of Constraints (TOC).
buffer stock – See safety stock.
build to order (BTO) – A process that produces products in response to a customer order.
Some authors equate BTO to assemble to order (ATO), while others equate it to make to order (MTO). Gunasekaran and Ngai (2005, page 424) noted “some confusion in these writings between MTO and BTO. The leadtimes are longer in MTO than in BTO. In MTO, components and parts are made and then assembled. In the case of BTO, the components and parts are ready for assembly.” This quote suggests that these authors equate BTO and ATO.
See assemble to order (ATO), make to order (MTO), respond to order (RTO).
bullwhip effect – A pattern of increasing variability in the demand from the customer back to the retailer, back to the distributor, back to the manufacturer, back to the supplier, etc. ![]()
The four causes of the bullwhip effect include (1) forecast updating, (2) periodic ordering/order batching, (3) price fluctuations, and (4) shortage gaming. Even if customer demand is constant, the raw materials supplier will often see high variability in demand as fluctuations are amplified along the supply chain.
The primary solution to this problem is for the retailer to regularly share actual and projected demand information. Other solutions include vendor-managed inventories (VMI), reducing order sizes by reducing ordering costs, using everyday low prices (instead of promotional prices), avoiding allocation based on orders placed, and reducing cycle time.
The following is a more complete explanation of the subject excerpted from “The Bullwhip Effect in Supply Chains,” by Lee, Padmanabhan, and Whang (1997), with some extensions.
The demand forecast updating problem – Ordinarily, every company in a supply chain forecasts its demand myopically by looking at the orders it has recently received from its customers. Each organization in the supply chain sees fluctuations in customer demand and acts rationally to create even greater fluctuations for the upstream suppliers. This occurs even when the ultimate demand is relatively stable.
Mitigation – Share sales information. Use demand data coming from the furthest downstream points (e.g., point-of-sale data) throughout the supply chain. Reduce the number of stocking points and make aggregate forecasts to improve forecast accuracy. Apply lean principles to reduce cycle times, reduce the forecast horizon, and improve forecast accuracy. Use technologies, such as point-of-sale (POS) data collection, Electronic Data Interchange (EDI), and vendor-managed inventories (VMI), to improve data accuracy, data availability, and data timeliness. Dampen trends in forecasts.
The order batching problem – Companies sending orders to upstream suppliers usually do so periodically, ordering batches that last several days or weeks, which reduces transportation costs, transaction costs, or both. These tactics contribute to larger demand fluctuations further up the chain.
Mitigation – Reduce transaction costs through various forms of electronic ordering, reduce setup costs by applying SMED, offer discounts for mixed-load ordering (to reduce the demand for solid loads of one product), use third party logistics providers (3PLs) to economically combine many small replenishments for/to many suppliers/customers, and do not offer quantity discounts to encourage customers to place large orders.
The price fluctuation problem – Frequent price changes (both up and down) can lead buyers to purchase large quantities when prices are low and defer buying when prices are high. This forward buying practice is common in the grocery industry and creates havoc upstream in the supply chain.
Mitigation – Encourage sellers to stabilize their prices (e.g., use everyday low prices). Activity-based costing systems can highlight excessive costs in the supply chain caused by price fluctuations and forward buying. This helps provide incentives for the entire chain to operate with relatively stable prices.
The rationing and shortage gaming problem – Cyclical industries face alternating periods of oversupply and undersupply. When buyers know that a shortage is imminent and rationing will occur, they will often increase the size of their orders to ensure that they get the amounts they need.
Mitigation – Allocate inventory among customers based on past usage, not on present orders, and share information on sales, capacity, and inventory so buyers are not surprised by shortages.
The underweighting open orders problem – Buyers sometimes seem to forget about orders that have already been placed and focus on the on-hand physical inventory rather than the inventory position (on-hand plus on-order). The following teaching question illustrates this point, “I have a headache and take two aspirin. Five minutes later, I still have a headache. Should I take two more?”
Mitigation – Use a system that gives good visibility to open orders and the inventory position. Train suppliers to avoid foolishly applying “lean systems” that place orders based only on the on-hand inventory without regard for the on-order quantities.
More recently, Geary, Disney, and Towill (2006) identified ten causes of the bullwhip effect.
See beer game, buyer/planner, Everyday Low Pricing (EDLP), forward buy, leadtime syndrome, open order, Parkinson’s Laws, quantity discount, SCOR Model, supply chain management, Third Party Logistics (3PL) provider, upstream, value chain.
burden rate – Overhead allocated to production based on labor or machine hours; also called overhead rate.
For example, a firm might allocate $200 of plant overhead per direct labor hour for an order going through the plant. The burden rate is then $200 per hour. Managers should be careful to avoid the “death spiral,” which is the practice of outsourcing based on full cost only to find increased overhead for the remaining products.
See Activity Based Costing (ABC), make versus buy decision, outsourcing, overhead, setup cost, standard cost.
business capability – A business function that an organization performs or can perform.
A description of a business capability should separate the function from the process. In other words, the description of a capability should describe what can be done without describing the details of how it is done, what technology is used, or who performs it. The details of the people, process, and technology are prone to change fairly often, but the capability will not change very often.
A business capability framework is a collection of an organization’s business capabilities organized in a hierarchy. For example, at the highest level, a firm might have six business capabilities: plan, buy, move, sell, enable, and analyze. Each of these can then be broken down at the next level into many more capabilities.
See process capability and performance.
business case – The economic justification for a proposed project or product that often includes estimates of both the economic and non-economic benefits; also called a business case analysis.
A business case is intended to answer two fundamental business questions: Why this project? Why now? Answering these two questions helps the decision maker(s) prioritize the project vis-à-vis other projects. The best way to collect the data to answer these two questions is to follow these four steps:
1. Gather baseline data – For example, the cycle time for order entry for the time period X to Y has increased from A to B.
2. Quantify the problem or opportunity – For example, what is the cost of excessive order entry cycle time?
3. Analyze stakeholders’ needs (especially customers) – For example, analyze raw comments from surveys and focus groups.
4. Define “best-in-class” performance – For example, our benchmark partner has a cycle time for a process that is half of ours.
In some cases, a business case analysis will analyze two or more competing business alternatives.
See focus group, project charter, stakeholder.
Business Continuity Management (BCM) – A management process for identifying potential events that might threaten an organization and building safeguards that protect the interests of the stakeholders from those risks; also known as Business Continuity Planning (BCP).
BCM integrates the disciplines of emergency management, crisis management, business continuity, and IT disaster recovery with the goal of creating organizational resilience, which is the ability to withstand and reduce the impact of a crisis event. BCM provides the contingency planning process for sustaining operations during a disaster, such as labor unrest, natural disaster, and war.
The BCM process entails (1) proactively identifying and managing risks to critical operations, (2) developing continuity strategies and contingency plans that ensure an effective recovery of critical operations within a predefined time period after a crisis event, (3) periodically exercising and reviewing BCM arrangements, and (4) creating a risk management culture by embedding BCM into day-to-day operations and business decisions.
The Council of Supply Chain Management Professionals provides suggestions for helping companies do continuity planning in its document Securing the Supply Chain Research. A copy of this research is available on www.cscmp.org.
See error proofing, Failure Mode and Effects Analysis (FMEA), resilience, stakeholder.
Business Continuity Planning (BCP) – See Business Continuity Management (BCM).
business intelligence – A computer-based decision support system used to gather, store, retrieve, and analyze data to help managers make better business decisions; sometimes known as BI.
A good business intelligence system should provide decision makers with good quality and timely information on:
• Sales (e.g., historical sales by product, region, etc.)
• Customers (e.g., demographics of current customers)
• Markets (e.g., market position)
• Industry (e.g., changes in the economy, expected regulatory changes)
• Operations (e.g., historical performance, capabilities)
• Competitors (e.g., capabilities, products, prices)
• Business partners (e.g., capabilities)
Ideally, BI technologies provide historical, current, and predictive views for all of the above. Although BI focuses more on internal activities rather than competitive intelligence, it can include both. Most BI applications are built on a data warehouse.
See data mining, Decision Support System (DSS), knowledge management, learning organization.
Business Process Management (BPM) – An information systems approach for improving business processes through the application of software tools, ideally resulting in a robust, efficient, and adaptable information system to support the business.
BPM generally includes tools for process design, process execution, and process monitoring. Information system tools for process design include tools for documenting processes (process maps and data models) and computer simulation. These tools often have graphical and visual interfaces. Information system tools for process execution often start with a graphical model of the process and use business rules to quickly develop an information system that supports the process. Information system tools for process monitoring capture real-time information so the process can be controlled. For example, a factory manager might want to track an order as it passes through the plant.
See Business Process Re-engineering (BPR), process improvement program, process map, real-time, robust.
business process mapping – See process mapping.
business process outsourcing – The practice of outsourcing non-core internal services to third parties; sometimes abbreviated BPO.
Typical outsourced functions include logistics, accounts payable, accounts receivable, payroll, information systems, and human resources. For example, Best Buy outsourced much of its information systems development to Accenture. In North America, Accenture and IBM are two of the larger BPO service providers.
See contract manufacturer, human resources, Maintenance-Repair-Operations (MRO), make versus buy decision, outsourcing, purchasing, Service Level Agreement (SLA), service management, sourcing, supply chain management.
Business Process Re-engineering (BPR) – A radical change in the way that an organization operates.
Business Process Re-engineering (BPR) involves a fundamental rethinking of a business system. BPR typically includes eliminating non-value-added steps, automating some steps, changing organization charts, and restructuring reward systems. It often includes job enlargement, which reduces the number of queues and gives the customer a single point of contact. In many firms, BPR has a bad reputation because it is associated with downsizing (firing people). Hammer and Champy (1993) are credited with popularizing BPR and their website www.hammerandco.com offers books and maturity models.
See 5 Whys, Business Process Management (BPM), error proofing, job enlargement, kaikaku, process improvement program, stakeholder analysis, standardized work, work simplification.
Business Requirements Planning (BRP) – BRP is a conceptual model showing how business planning, master planning, materials planning, and capacity planning processes should work together.
The BRP model starts the business plan (profits), sales plan (revenues), and production plan (sales dollars, cost, or aggregate units). Once the production plan has been checked by Resource Requirements Planning (RRP) to ensure that the resources are available and that the top-level plans are consistent, it is used as input to the Master Production Schedule (MPS), which is a plan (in units) for the firm’s end items (or major subassemblies). The diagram below shows the BRP model (Schultz 1989).
Materials Requirements Planning (MRP) translates the MPS into a materials plan (orders defined by quantities and due dates). Capacity Requirements Planning (CRP) translates the materials plan into a capacity plan (load report) for each workcenter, which is defined in terms of planned shop hours per day. Almost no systems have a computer-based “closed-loop” back to the MPS or the materials plan. The feedback is managed by manual intervention in the schedule to adjust the materials plan or add, remove, or move capacity as needed.
Business Requirements Planning framework
Ultimately, the system creates both purchase orders for suppliers and shop orders for the firm’s own factories. Buyer/planners convert planned orders in the action bucket (the first period) into open orders (scheduled receipts). This planning process is supported by the ERP database, which provides information on items (the item master), the bill of material (the linked list of items required for each item), and the routings (the sequence of steps required to make an item).
The term “Business Requirements Planning” is not widely used. The concept is closely related to Sales and Operations Planning, which has become a standard term in North America. The Master Production Schedule (MPS) and Sales & Operations Planning consider very similar issues.
See bill of material (BOM), Capacity Requirements Planning (CRP), closed-loop MRP, Enterprise Resources Planning (ERP), Master Production Schedule (MPS), Materials Requirements Planning (MRP), open order, production planning, Resource Requirements Planning (RRP), Rough Cut Capacity Planning (RCCP), Sales & Operations Planning (S&OP).
buy-back contract – An agreement between a buyer and seller that allows the buyer to return unsold inventory up to a specified amount at an agreed-upon price.
The most common buy-back contract is in the retail supply chain, where manufacturers or distributors allow retailers to return products, such as music CDs, with a restocking charge. Buy-back contracts increase the optimal order quantity for the seller, which results in the higher product availability for customers and lower lost sales for the seller. These contracts can result in higher profits for both the buyer and the seller. On the negative side, a buy-back contract can result in excess inventory for the supplier. In addition, the supply chain might overreact to the larger orders from sellers and assume that the larger orders represent true demand, when in fact the sellers are just buying for inventory. The most effective products for buy-back contracts are those with low variable cost, such as music, software, books, and magazines, so the supplier can keep the surplus.
A revenue sharing contract is similar to a buy-back contract in that it shares the risks between the buyer and the seller and encourages the seller to carry more inventory, which can reduce the probability of a lost sale. As with buy-back contracts, larger orders from buyers can be misinterpreted as indications of increased demand.
Quantity flexible contracts allow the buyer to modify orders after they have been placed within limits. These contracts help match supply and demand and do a better job of communicating the true demand. However, these contracts often require the supplier to have flexible capacity.
According to Cachon (2001, p. 2), “a contract is said to coordinate the supply chain if the set of supply chain optimal actions is a Nash equilibrium, i.e., no firm has a profitable unilateral deviation from the set of supply chain optimal actions.” Cachon and Lariviere (2005) showed that a continuum of revenue-sharing contracts can coordinate a supply chain with a supplier selling to multiple competing retailers, when the retailers’ sole decision is the quantity to purchase from the supplier. In addition, they show that coordinating revenuesharing contracts can be implemented as profit-sharing contracts.
See fixed price contract, purchasing, Return Material Authorization (RMA), return to vendor, risk sharing contract, supply chain management.
buyer/planner – A person who has the dual responsibility of a buyer (selecting suppliers, negotiating agreements, and placing purchase orders with suppliers) and a planner (planning materials for the factory).
In many firms, the buying responsibility is separated from the planning responsibility. The buyer is responsible only for placing purchase orders with suppliers and the planner handles releasing (starting) and expediting (or de-expediting) manufacturing orders (factory orders). The advantages of combining the two roles into a single buyer/planner role include:
• Both roles require essentially the same skills – The ability to plan ahead, use systems, know part numbers, product structures, and suppliers, understand capacity constraints, know how to expedite (and de-expedite) orders, and understand true customer requirements and priorities.
• Firms can find synergy between the two roles – The planning function in the factory is affected by the availability of materials and the buying function is affected by factory priorities.
See bullwhip effect, expediting, firm planned order, purchase order (PO), purchasing, supplier scorecard.