
Chapter 4
Economic Setting
Following a recession, economists describe the economy as usually going through two phases: recovery then expansion. Economic activity first recovers, sometimes slowly, other times with a surge. Then momentum kicks in and sets the stage for steady expansion (economic growth). Not this time! The post-2008–2009 recession economy was different and imperfect by historic standards and investors’ wishes.
Figure 4.1 shows quarter-over-quarter (Q-O-Q) rate of change in gross domestic product (GDP) from the first quarter of 2008 through the fourth quarter of 2019, which closely aligns with the end of the eleven-year bull market. What stands out first is the four sequential quarters of negative GDP, or contraction, third quarter 2008 through second quarter 2009. The first positive quarter-to-quarter growth to start the recovery was the third quarter 2009. For the twenty quarters (five years) beginning with the third quarter of 2009, three quarters were negative and six out of the twenty were .5% or less. The recovery struggled and momentum never kicked in to set the stage for steady expansion until middle to late 2016.
There are a variety of contributors to this imperfect recovery. The behavior of the Fed is one of them. In the next chapter we will show how the Fed stimulated growth of the money supply to promote recovery but then quickly slowed it down due to inflation fears. As we now know, those inflation fears were inappropriate. The Fed slowed the growth of the money supply before economic momentum was established and inhibited the economy from moving from recovery to expansion. A year later, the Fed had to employ a second round of monetary expansion known as QE2.

Figure 4.1 Quarter-Over-Quarter GDP, 3/2008–12/2019 DGP
With GDP declining in three of those early twenty quarters and growing less than 0.5% in three others, there was enough economic disappointment for skeptics to keep their money on the sidelines, contributing to, as we mentioned before, the “unloved” nature of the bull market. There was a reoccurring, if not constant, concern that the economy would fall back into recession. The “two steps forward, one step back” nature of this recovery caused many observers to doubt its sustainability.
Predictions of a “double-dip” recession were frequently offered by economists. For example, in the Wall Street Journal on October 6, 2010, three economists offered concerns about the economy heading back into recession. “We are probably debating words at this point; a secondary dip is playing out,” said Paul Ballew, chief economist at Nationwide. And in agreement, “The economy has already been hit by a series of shocks earlier this year, so I think we need just one more modest shock to tip the economy back into recession,” said Bank of America economist Michelle Meyer. And a third view for good measure, “This puts a double dip back on the table,” said Justin Wolfers, an economist at the University of Pennsylvania's Wharton School.
As seen in the first chapter, the ICON valuation readings indicated stocks were underpriced during the early years of recovery. In an attempt to persuade financial advisors and investors to our bullish posture we poked some fun at the predictors of the double-dip recession. In 2011, we wrote, “A double-dip recession is a largely mythical economic creature that has rarely been seen or measured by humans. Some contend a double-dip recession was last experienced between 1980 and 1982. In any event, the term ‘double-dip recession’ is quite real to people prone to worry about things that may never come to be.” Despite our best efforts at coaxing, we suspect we were unable to dissuade their negative view of the economy.
Europe
Europe experienced an even more sluggish, less consistent recovery from the great recession, which was a drag on global growth and contributed to the imperfect recovery in the United States. Figure 4.2 shows the Q-O-Q GDP growth for France and Germany. Both countries experienced the global recession with France's being longer (five quarters of negative GDP) whereas Germany's was deeper (−4.5% first quarter 2009). Both countries experienced recovery surges initially but then settled back into disappointing and frequently interrupted growth. Let's note the number of quarters with 0.2% or less growth because four straight quarters of only 0.2% growth would not even reach a dismal 1% for an annual rate. From second quarter 2011 through third quarter 2016 France had fourteen of those twenty-two quarters with Q-O-Q GDP growth of 0.2% or less including three that were negative. During that same period Germany experienced eight quarters with 0.2% or less Q-O-Q growth with four of those being negative.

Figure 4.2 Quarter-Over-Quarter GDP 3/08–12/19
As we will show in the next chapter, the European Central Bank (ECB) stimulated growth in its money supply, which explains the initial recovery surge, but then pulled back, presumably due to inflation fears. This focus on inflation prevention is understandable because, unlike in the United States, where our Federal Reserve has the dual mandate of full employment and price stability, the ECB has only one mandate: price stability. Just as in the United States, the European economies never went from the standard recovery to expansion, making Europe a drag on the global economy.
China
China's influence on the global economic recovery can best be seen in Figure 4.3, which shows year-over-year (Y-O-Y) GDP on a quarterly basis. At the peak of the last economic expansion in 2006 and 2007, Y-O-Y GDP was in the 12% to 14% range for China. During the global recession, China did experience a significant slowdown to 6.4%. As will be seen in the next chapter it used monetary easing to help jolt its economy, and the global economy as well, to recovery.
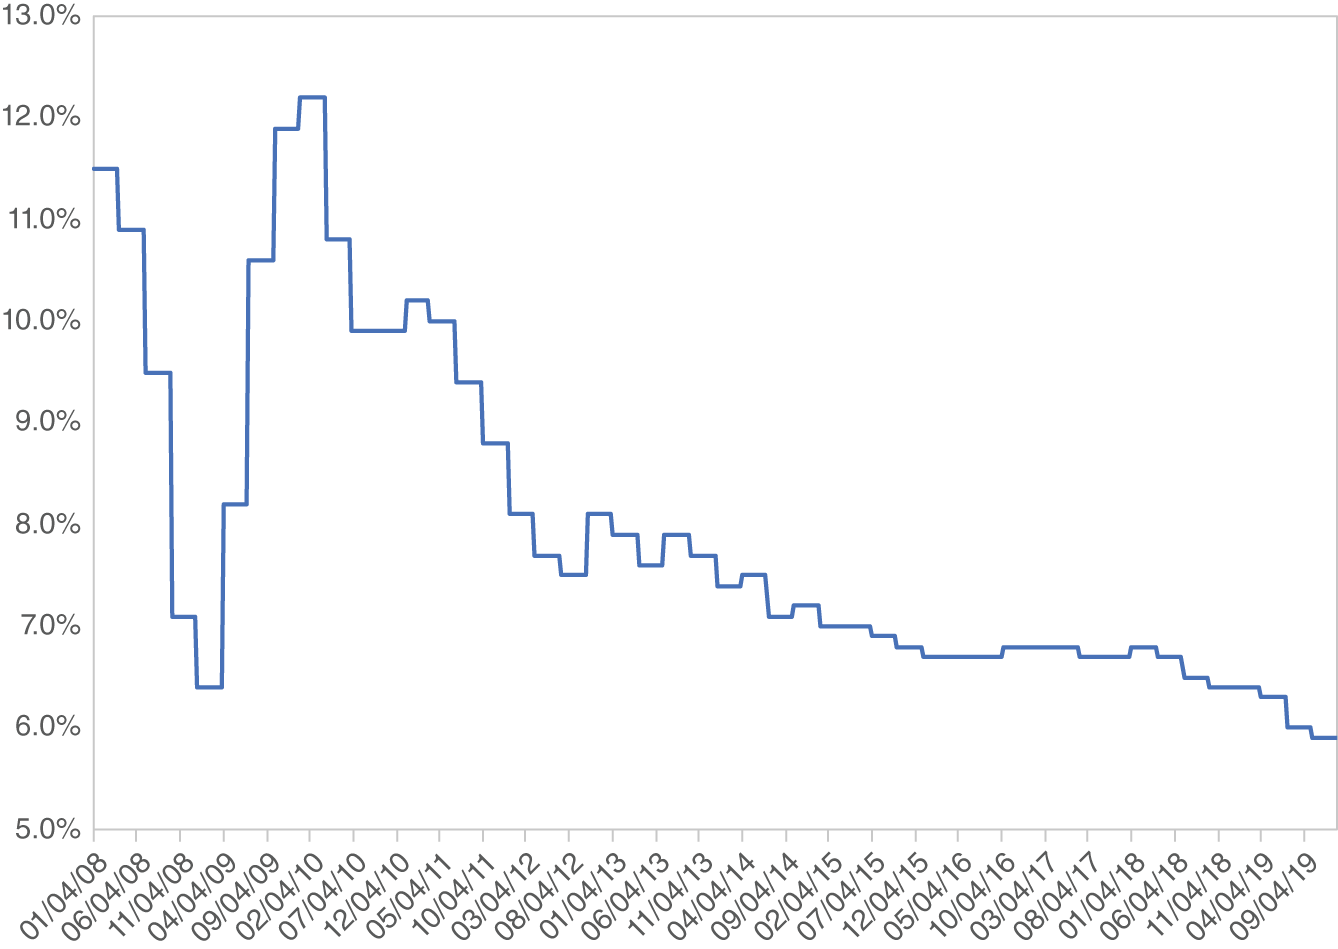
Figure 4.3 China Year-Over-Year GDP, 2008–2019
Monetary stimulus worked as China experienced growth back up over 12%, but then there must have been some heated debates. Some in power must have argued, “Why are we risking inflation to stimulate other economies?” In other words, “Why are we pulling the global economic train?” You can see what must have been a deliberate, orchestrated slowing of the growth of their economy from 2011 through 2019. Our US economy not only didn't have a vigorous European expansion to help but also didn't have the 12% to 14% growth in China that it benefited from during the previous expansion. There were a lot of people in the recovery boat, but many were not paddling.
Economic Surprises
Citigroup Global Markets computes and distributes an index they call The Citi Surprise Index. They survey economists and analysts to get their forecasts for a variety of variables. Then Citigroup compares the forecasts to the actual data when they are released. The index measures data surprises relative to market expectations. A positive reading means that the data releases have been stronger than expected and a negative reading means that the data releases have been worse than expected.
Figure 4.4 shows the Citi Economic Surprise Index weekly from January 2, 2009, through February 21, 2020. The first thing that stands out is the predictions are like a broken clock, correct twice a day. The next thing that stands out is how they rapidly fluctuate from better than expected to worse than expected. It appears that when released data are worse than expected the forecasters revise their forecasts downward, too far downward. It appears they compensate too much. Then the released data become better than their downwardly revised forecasts, so they revise their forecasts upward, eventually too far upward. And so on, back and forth. This cycle repeats, much to the dismay of the investor and money managers using economic forecasts for investment guidance.
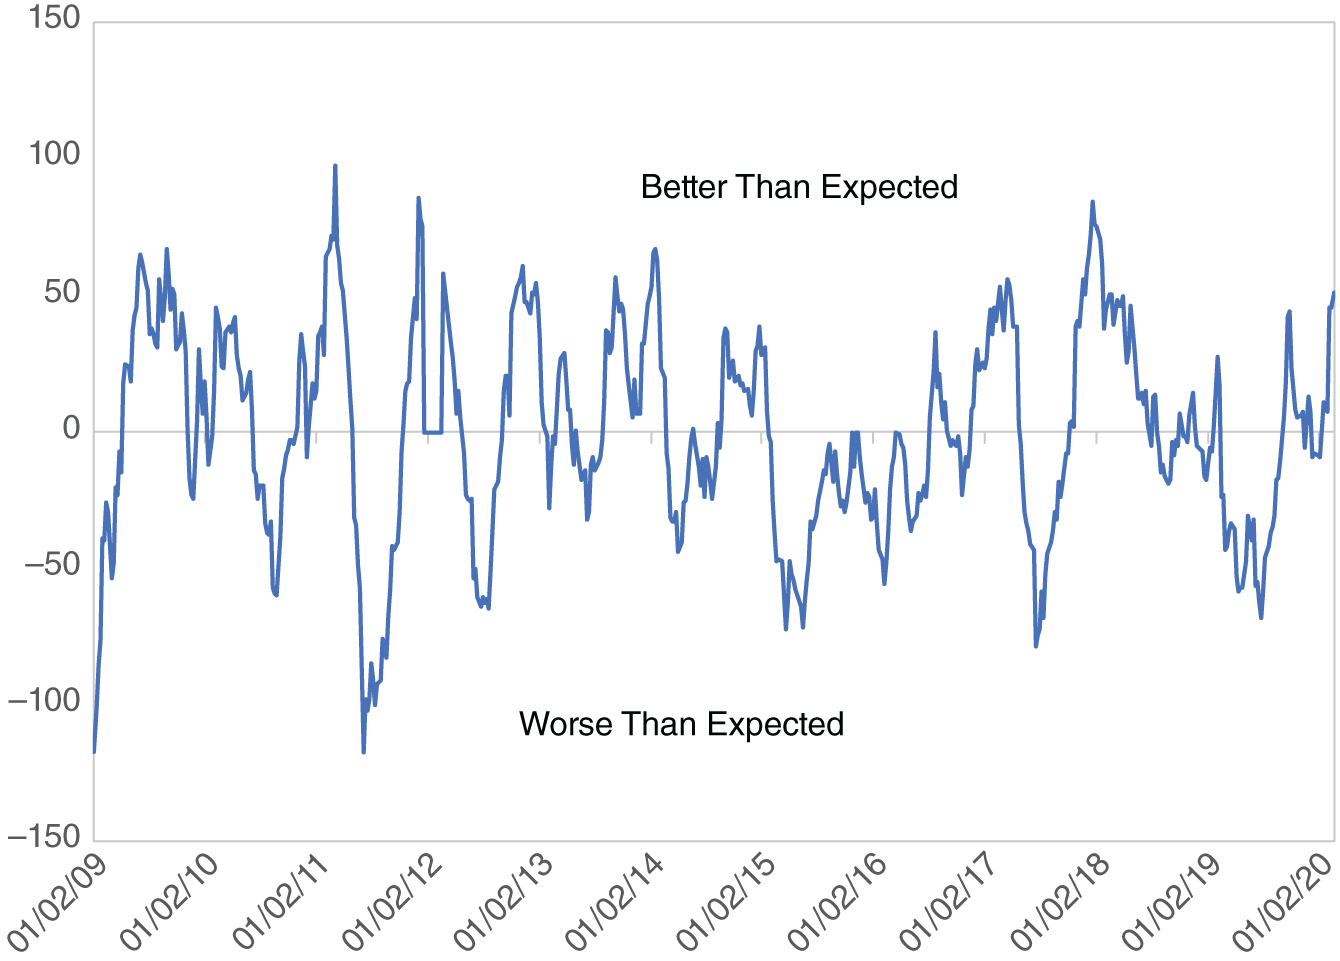
Figure 4.4 Citi Economic Surprise Index
Perhaps the rapid reversals are just human nature and not unique to economists. In the 1990s, we did an investment presentation to an audience in Torrance, California, which included many aerospace engineers. We were stating how a disciplined value approach to investing can filter out the news and investors’ tendency to react, or more often than not, overreact, to the news. A fellow in the audience raised his hand and said in aviation that is known as “pilot-induced oscillation.” If the plane's nose is up, the pilot turns it down, but perhaps too much. Then the pilot tends to turn the nose up too much. Pretty soon the plane is on a path resembling the Citi Economic Surprise Index.
So maybe it is human nature for economic forecasters to “over-revise,” but it is likely that the two steps forward, one step back nature of the economic recovery caused forecasters’ fits. It just appears forecasters had a difficult time getting their arms around the imperfect recovery. Perhaps this economist-induced oscillation contributed to investors holding cash and not fully participating in the multiyear bull market.
Summary
Throughout this bull market, many objections to being invested seemed to come at us from the thirty-thousand-foot level, based on a macroeconomic view. We would respond to those objections by saying that the boots on the ground, company-by-company analysis dictated being invested. There were healthy, growing companies at attractive prices. This dichotomy between the macroeconomic and company analysis levels will be discussed more in Chapter 12. We will see that managers who start their investment process with an economic forecast did not do very well during the eleven-year bull market. Managers who were simply looking for rapidly growing companies or well-managed companies with a dominant brand, which were easy to find, performed very well. Not paying attention to the imperfect economy proved to be advantageous.
A few things contributed to investors not fully participating in the great, but unloved, bull market. With regard to the economic setting, the domestic economy frequently either retreated or experienced sluggish growth. Europe weighed on the US economy because recoveries in those countries were even weaker and less consistent than in the United States. China chose to lower its GDP growth, which diminished its contribution to global growth. The result was an economy that economists and investors alike just couldn't figure out, which kept many investors from participating or maximizing returns in the great bull market.
- During this period there was recovery but no robust expansion.
- Europe was a drag.
- China was slower than in the past.
- There were problems for economic forecasters.