
Chapter 6
The Federal Reserve and Monetary Policy
Let's begin this chapter with a phrase you may have heard or read during the bull market. In a Bloomberg Businessweek article, August 12, 2019, Christina Lindblad wrote, “But the government controls the dollar printing press, so it can't go bust.” You may have heard such an expression from professional money managers who thought the low interest rates were phony, fabricated, and dangerous and believed that the expansive monetary policy would ignite inflation. They would state “the Government is just printing money.” Of course that statement is totally wrong. The Fed is not part of the government. Think of it as a club that banks join. It was intentionally designed to be separate from the government. Through monetary policy, it can influence the growth of the money supply, which is defined to be currency and demand deposits (checking accounts). The US Treasury Department, which is part of the federal government, prints currency and mints coins and has nothing to do with increasing or decreasing the money supply. The Federal Reserve is not the government. The Treasury does not control the money supply. Now that we know that the government does not print (increase the supply of) money, let's see what the Fed does and what role it played in the bull market.
The Federal Reserve was created in 1913. With regard to monetary policy, it has two, sometimes conflicting, mandates of full employment and price stability. In other words, we want people working but we don't want inflation. Its primary tool for implementing this policy is to control the growth of the money supply. If the Fed sells T-Bills to banks, it drains reserves, banks slow down their lending, and the growth of the money supply slows. Just the opposite if the Fed buys T-Bills from banks; it adds reserves, banks increase their lending, and the growth of the money supply increases. As we saw in Chapter 5 and the MV = PQ equation, overall economic activity is influenced by the money supply.
Money Supply
Figure 6.1 shows the fifty-two-week rate of change for M1, the money supply, from December 1979 to February 2020. Each of the 2,098 observations is simply M1 on that date compared to M1 fifty-two weeks prior. Over this entire period the average fifty-two-week rate of growth is 6.1%. At times when the Fed is pursuing “easy” monetary policy M1 has grown at 10%, 15%, even 20% Y-O-Y. At times when the Fed is pursuing “tight” monetary policy growth, M1 has been slowed to zero or even negative growth.
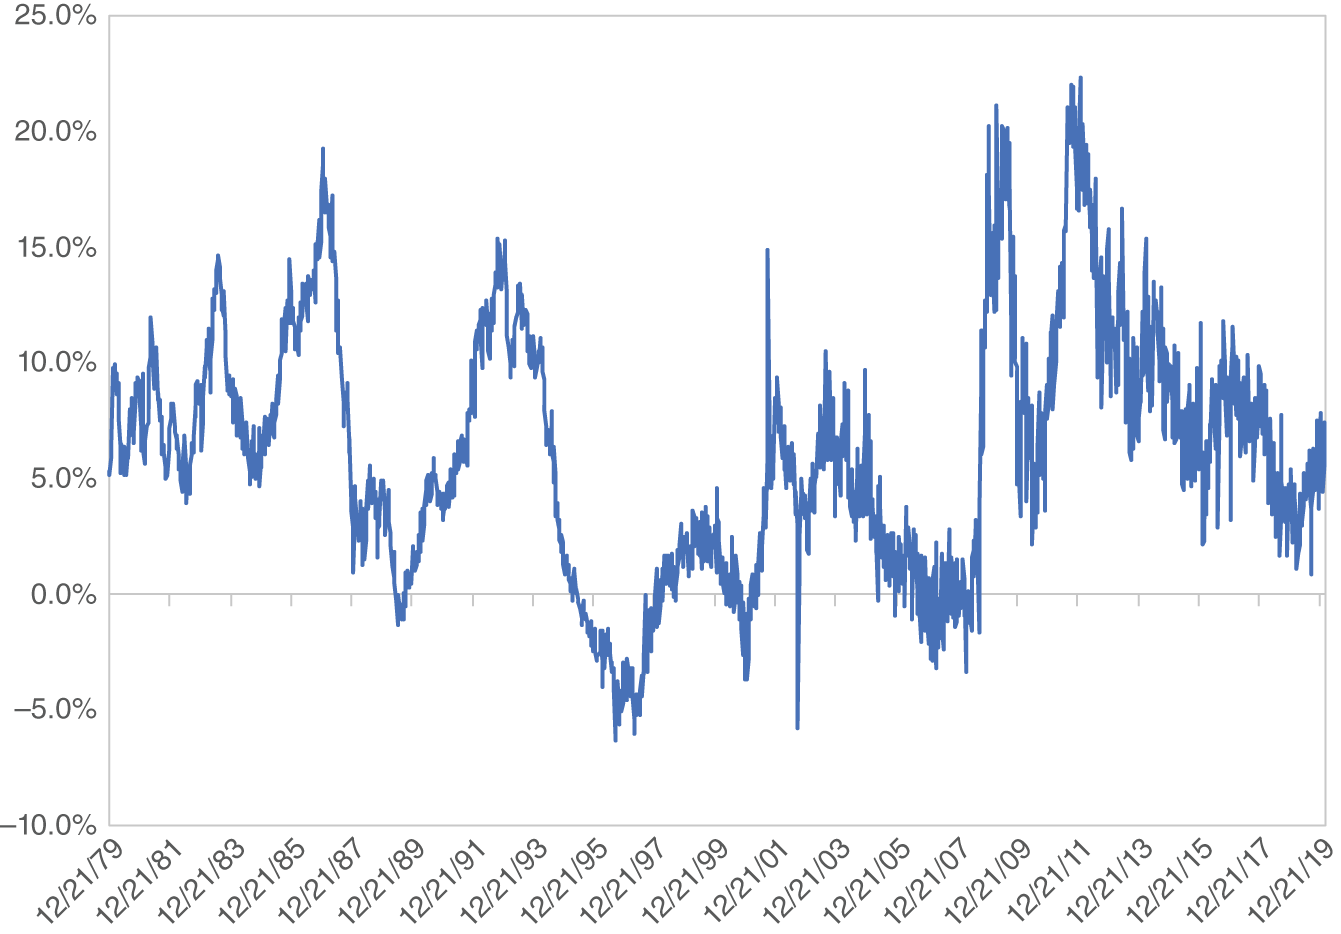
Figure 6.1 M1 Rolling Fifty-Two-Week Percentage Change
Figure 6.2 shows the fifty-two-week rate of growth of M1 but just for 2005 through February 2020. Before looking at the money supply during the recovery and bull market, let's focus on 2005–2009. The Fed was so determined to fight inflation that it took the rate of growth in M1 to zero and even negative. When it became aware of subprime mortgage problems summer 2007, the Fed attempted to ease. In August 2007, it lowered the rate at the Discount Window 50 basis points, a more aggressive move than the usual 25-basis-point cut in the Federal Funds rate. Usually, this would inject reserves into the system, banks would lend, and M1 would grow, but not this time.
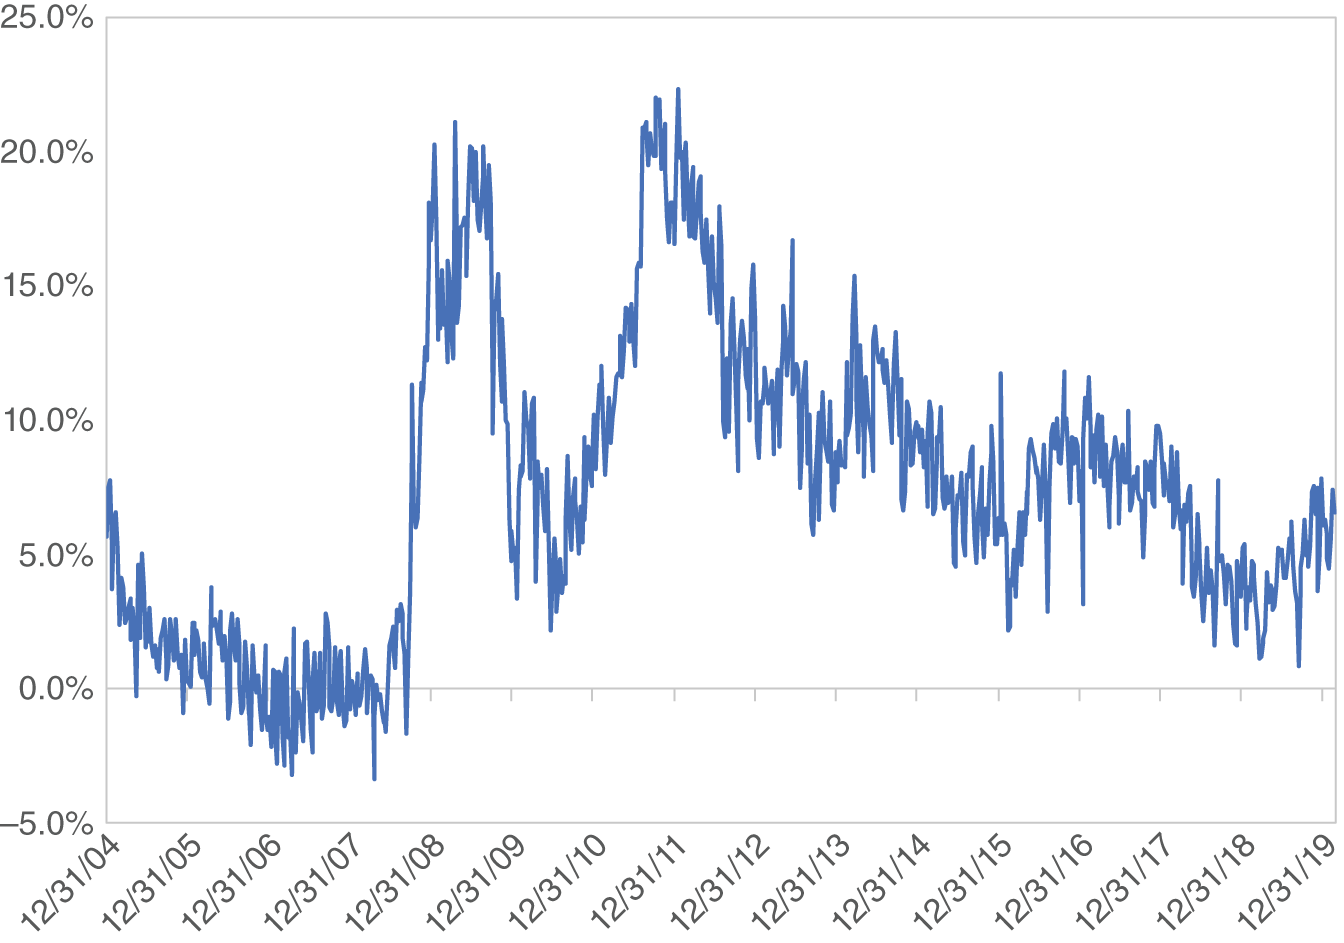
Figure 6.2 M1 Rolling Fifty-Two-Week Percentage Change, 1/05–2/20
The banking system was frozen, a state the Fed (along with the FDIC and Comptroller of the Currency) had failed to pick up in bank examinations. The housing and real estate collapse hit banks from two sides. Banks had made real estate loans but also bought real estate bonds and mortgage-backed securities in their bond portfolios apparently reaching for yield in a low interest rate environment. By frozen, we mean the banks could not make loans. The Fed injected reserves but the banks could not lend so M1 could not grow. Once the Fed realized the circumstances, you saw some unusual actions from the Fed and the Treasury Department trying to unlock the banking system. Terms such as “bailouts” and “too big to fail” were heard frequently as officials would sweep in over a weekend and merge an unhealthy commercial or investment bank into a healthy one. Finally, they succeeded at unlocking the banking system and by late 2008 and early 2009, a year and a half later, banks made loans and M1 grew 20% Y-O-Y.
One final note on what caused the Great Recession is in order, especially when there was so much blame being thrown around. We do not have to look any further than the money supply. If we asked economists, a profession known for disagreement, “what would happen if the growth of M1 went to near zero and even negative for four years?” We expect they would agree and the answer would be, “You'd have a really bad recession!” That is all it would take. The Fed didn't plan on it being four years of no M1 growth but it turned out being that long because the banking system was frozen.
The big spike in the rate of growth of the money supply in early 2009 is a result of banks lending once again. When a bank makes a loan, money is created. Spotting the increase in the money supply we wrote to investors “the cavalry is on the way,” meaning the stock market and the economy can recover. Of course, the doubters brought us the old expression that the relationship between increasing the money supply and subsequent economic activity is like pushing on a string. That ineffective relationship did hold in the 1930s with 25% unemployment and massive bank failures, but not in 2009. Once the banking system was unfrozen, M1 grew, the stock market rallied, and then with the usual lag, the economy recovered.
For the Fed governors with the gut level fear that inflation could return (discussed in Chapter 5) 20% Y-O-Y growth in M1 was uncomfortable. Here is an example in a Wall Street Journal article by Deborah Lynn Blumberg on February 24, 2011, titled “Fed's Bullard Proposes Inflation Target.” “In the current climate of concerns about rising global inflation, it might make sense for the Federal Reserve to set a target for inflation, St. Louis Federal Reserve President James Bullard said Thursday. The Fed is charged with controlling U.S. inflation, but perhaps global inflation will drive U.S. prices higher or cause other problems, he said.”
Apparently those who held that view prevailed in meetings and the Fed slowed the growth in the money supply back down to below 5% per year, as seen in Figure 6.2, but the economy had not picked up momentum. It had not transitioned from recovery to expansion. With slower monetary growth, the recovery sputtered, so the Fed reversed course and juiced up the growth of M1 again under the name of Quantitative Easing round 2, or QE2. The Fed's misguided fear of inflation explains the erratic recovery discussed in Chapter 3 and could be a reason for the lack of participation by investors in the multiyear bull market.
There were always doubters who did not believe the easing by the Fed would help the economy. As mentioned, in 2009 they used the “like pushing on a string” analogy. Again in 2011, there were similar doubts expressed about the ability of QE2 to stimulate the economy in the Wall Street Journal on September 22, 2011. In an article entitled “Asian Shares, Currencies Plunge,” by Alex Frangos, Norman Chan, executive director of the Hong Kong Monetary Authority, questioned the efficacy of the Fed's move. “As the U.S. housing markets are still extremely weak, and U.S. families’ debt ratio remains high, it's uncertain how effective the Fed's new measure would be to the U.S. economy.” Perhaps Mr. Chan wasn't familiar with an old Wall Street expression, “Don't fight the Fed.” It means if the Fed is easing, you want to own stocks. It certainly held valid during this bull market.
Europe and China
The central banks of Europe and China report their money supply monthly. Figure 6.3 shows twelve-month rates of growth for the money supplies of Europe and China for January 2008 through February 2020. Similar to the United States, they both increased the rate of growth of the money supply to stimulate their economies out of the global 2008–2009 recession. They might have been slightly behind the United States, but not by much. China was the more aggressive central bank, with its money supply reaching 30% Y-O-Y growth. After that initial spurt, China has been gradually slowing the rate of growth of its money supply.
Europe was different because of the different mandates between the US Fed and the European Central Bank (ECB). Inflation is a severe situation for small countries that have their own currencies, which was typical in Europe before the European Economic Union. With inflation, a small country's currency gets devalued and the country becomes poorer. The ECB, with only a single mandate, cares only about fighting inflation, not promoting employment or growth. We can only imagine that when they got their money supply growing at 14.5% Y-O-Y in 2009, there must have been extreme discomfort and fist pounding over concern of stimulating the dreaded inflation. Apparently that group prevailed, and they slowed the growth of their money supply to almost zero. With the resulting no inflation and sluggish economic conditions, the ECB once again stimulated growth in the money supply, but grudgingly. During this recovery Europe was a drag on global growth. We believe it contributed to the erratic recovery in the United States. Europe behaved like unified fiefdoms so concerned about inflation that it could not fulfill its role as an economic power.
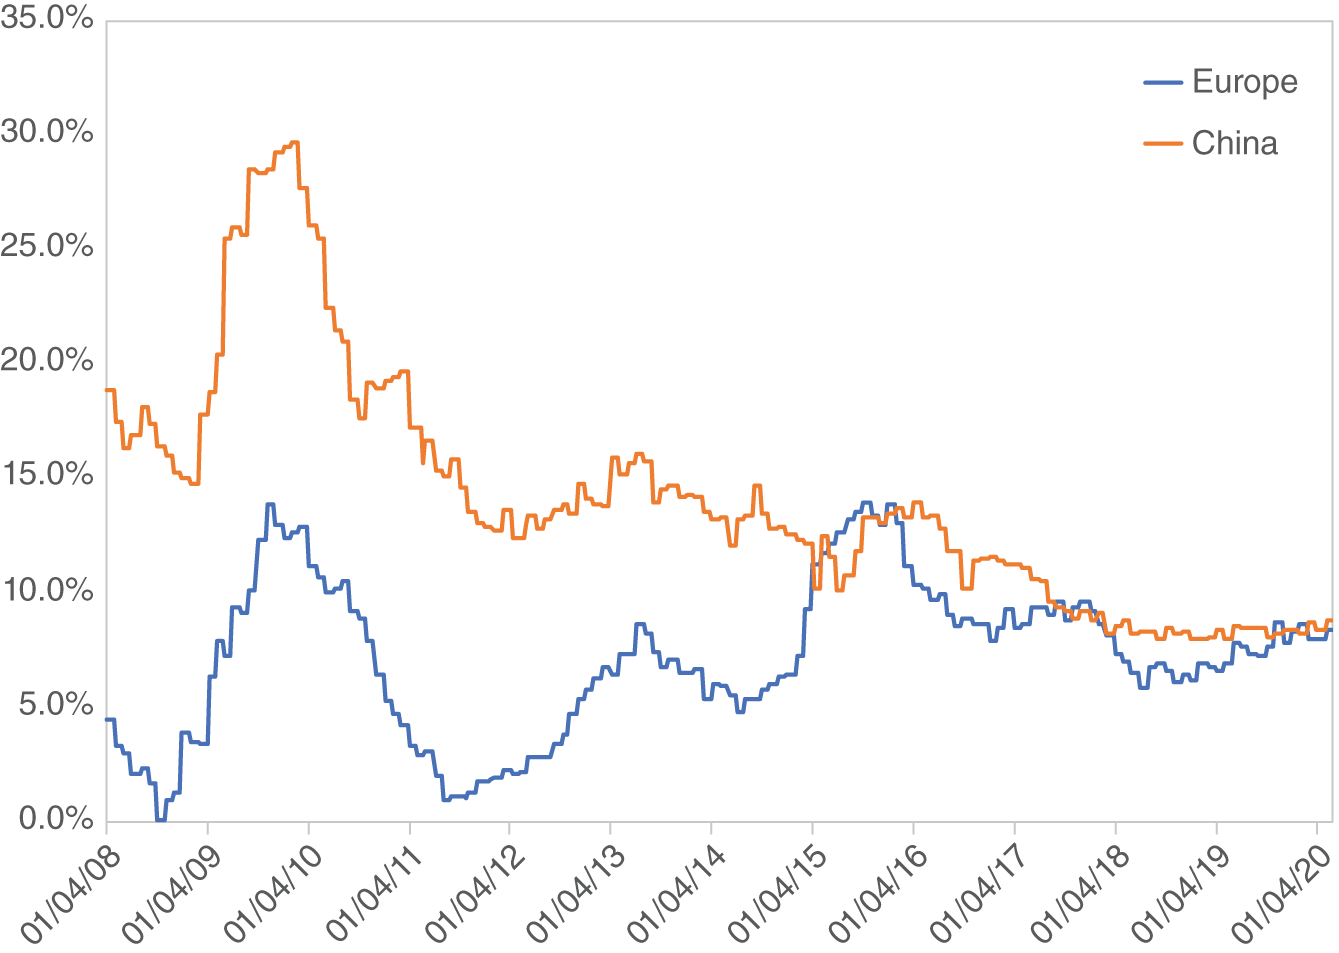
Figure 6.3 Year-Over-Year Money Supply Growth, Europe and China
Peak Conditions
For many years it seemed like there was a contest among observers to see who could be the first to call an end to the multiyear bull market. Of course, they were early and wrong. Watching them be consistently wrong prompted us to look into stock market peaks to see if they had some commonality.
It appears to us that the Fed is the culprit. Seeing a heated economy and rising inflation the Fed tightens monetary policy, which drives the economy into recession. Perhaps the Fed goes too far by mistake or perhaps the Fed thinks it is worth a recession to fight inflation. In either case investors observe the tightening and sell stocks.
In 2015, we looked back at the stock market peak conditions preceding the last four recessions and their bear markets. At the time, we determined a market peak was not in sight because the conditions of rapid economic growth and inflation that would prompt the Fed to tighten were not occurring.
That paper was distributed April 1, 2015, and proved to be correct. Although many observers were calling for an end to the bull market, peak conditions were just not in sight.
Neutral Monetary Policy
From 1926 through 1981, before the multi-decade run of disinflation and declining interest rates, the average yield on Treasury Bills equaled inflation, a very sensible relationship. T-Bills are backed by the full faith and credit of the US Government and are therefore considered to be risk free. You know exactly what your return will be, which means no risk or uncertainty. An investor who does not take risk should not gain on inflation but should just hold even. So, it was very sensible that over many decades the average yield on T-Bills equaled the inflation rate.
Applying this risk-return relationship, when the yield on T-Bills equals the inflation rate, we would label monetary policy as neutral, neither tight nor easy. In that setting, risk-free investors are holding even with inflation. During fall 2018, inflation was being measured in the 2% range, yet the Fed raised its Federal Funds target to near 2.50% and T-Bills fell in line. As the Fed was hinting at more rate increases in 2019, investors sold stocks and headed for the exits during fall 2018. The Fed had been saying it was “data driven” but instead was hinting that it was predetermined to take Federal Funds to 3% or greater in 2019. Just because of historic average or what the Fed might have thought was normal, there was no need to take T-Bills to 3% or more when we were in a low inflation environment. Fortunately, the Fed backed off and stated the Federal Funds target rate would remain constant in 2019. July 2019, the Fed lowered the Federal Funds target range to 2.00% to 2.25%, still a bit above inflation but closer to neutral. With two more rate cuts in September and October it finally returned to a neutral policy with T-Bill just about in line with inflation.
M1 Not Rates
This bull market was so unloved that we saw many analysts skip over it and worry about the next recession. They reasoned that with interest rates so low, reducing the Federal Funds rate would not stimulate the economy. They suggested the Fed would be powerless during the next recession. For example, from the Wall Street Journal on December 9, 2019, an article titled “Fed's Tools for Bad Times Grow Dull” states, “It isn't news that the Federal Reserve has less room to counteract a recession by cutting its benchmark interest. In the past three down turns, the central bank has cut rates by at least 5 percentage points. The Fed couldn't do that now because the rate is in a range between 1.50% and 1.75% and unlikely to rise soon.”
About a month later, there was a similar line of reasoning expressed in Bloomberg News from the article titled “Fed Officials Subtly Shift Inflation Strategy Amid Review” on January 28, 2020, by Christopher Condon. “Yet there is a dark side to low inflation, one that could prove painful if the economy takes a sharp downturn. Low inflation and low growth together mean interest rates are also low, and that robs the Fed of ammunition it may need to fight off a recession. At the moment, the Fed's benchmark rate sits close to 1.5%. Since World War II the Fed has reacted to recessions by lowering rates, on average, by about 5 percentage points. In other words, the Fed is likely to hit zero before it can provide sufficient fuel for a rebound.”
Built into that reasoning is the popular belief that it is the level of interest rates that affects the economy. Simply stated, raising the Federal Funds rate slows the economy and lowering the rate stimulates the economy. That line of reasoning is popular because when the Fed performs monetary policy all observers see is the interest rate change, and the one-on-one relationship between rates and the economy is intuitive.
We disagree and believe it is the resulting change in the rate of growth of the money supply, not the change in the Federal Funds rate that affects the economy. Even with low interest rates the Fed has three tools that can be effective to increase the money supply and stimulate the economy. Two inject reserves into banks and all three allow banks to make more loans, which grows M1. First, the Fed can lower the Fed Funds target and perform Open Market Operations. It buys T-Bills from banks and pays for them by adding to the bank's reserves. Then banks can make more loans. Second, the Fed can lower the rate on the Discount Window. Day-to-day, banks borrow reserves from each other, which does not increase reserves over the entire banking system, but when the Fed lowers the rate at the Discount Window, banks borrow reserves from the Fed, which injects reserves into the system. Again, more reserves means more loans because there is a fixed ratio of loans per dollar of reserves on each bank's balance sheet. Third, the Fed can lower the Reserve Requirement. Immediately banks can put more loans on the books per dollar of reserves that they hold. All three tools result in more loans, which creates money; more money, M1, more economic growth. It isn't the change in interest rates that promotes growth, it is the increase in the money supply, and the Fed has the ability to do that even in a low interest rate environment. We saw that in 2020, to be covered in a later chapter.
Summary
The Fed attempted to ease and stimulate monetary and economic growth in August 2007 but the banking system was frozen. With banks unable to make loans, the money supply didn't grow for almost an extra year and a half, which made the recession very severe. Finally, by early 2009, banks made loans, the money supply grew, and the economy recovered. Rather than keeping its foot on the monetary gas pedal, the Fed backed off, presumably due to inflation concerns, only to stimulate again a year later. In addition, the ECB also backed off its stimulative monetary policy, so Europe became a drag on global growth. China was on a path of slower monetary growth. The result of monetary policies in the United States, Europe, and China was an imperfect economic recovery in the United States of two steps forward, one step back, which invited occasional predictions of a double-dip recession. Such an economic setting did not serve as an invitation for investors to buy stocks. On the contrary, it kept investors away.
Can we grade the Fed for its behavior during the recession and bull market? Some feared it eased too much and would cause inflation. They were wrong, so their grade doesn't count. On the contrary, the only fault we find is that the Fed was overly concerned about inflation early in the bull market and backed off its monetary stimulus before the economy could move from recovery to expansion. Then again in 2018, fearing the imaginary inflation monster it raised the Federal Funds rate and drained reserves. So, how about a B? And by the way, the government doesn't print (create) money (M1).
- Initial (2007) monetary ease didn't work because the banking system was frozen.
- After unlocking the banking system money supply grew, stocks rallied, and the economy recovered.
- Fed and ECB feared inflation and quit easing too soon.
- Inflation and GDP were not heated enough to require tightening.
- It's M1 not interest rates.