Chapter 13
Human Behavior
This chapter is going to offer a hypothesis that investors make decisions based on just one variable and that they overestimate the relationship between that variable and the stock market. First, however, let's have one more reminder just how unloved the bull market was.
Short Sellers
Behaviors of short sellers provide a nice summary of how “unloved” the bull market was and how many investors were wrong. To sell short, investors can borrow stock they do not own and sell the shares. If the stock price drops, the investor can buy back the shares (cover) and keep the difference between the selling price and the repurchase price. If the price goes higher, the short seller loses money.
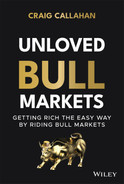
Stock exchanges keep track of shares that have been sold short and not repurchased, called short interest. An index computes total short interest on the NYSE, NASDAQ, and AMEX and divides that total by the total float. Float are shares that are outstanding and eligible to be traded. The index reveals what percent of shares outstanding and tradeable have been sold short and not repurchased. It is shown in Figure 13.1 (black) along with the S&P 1500 Index (gray) from December 31, 2008, through November 15, 2019.
At the far left is heavy short selling relative to float in early 2009, before the bottom, at the bottom, and even the first few months of the rally. Apparently, these investors did not believe the rally was sustainable and “for real.” But looking back, it was, and those short sellers probably sustained significant losses. Points 1, 2, 3, and 4 show surges in short selling and all reach their peaks at the bottom of market dips. Points 1 and 2 were the severe market drops in 2010 and 2011 due to the European debt crisis rounds one and two. Points 3 and 4 were lesser dips in May 2012 and October 2014. In all four cases, the market drops appeared to be opportunities to sell short for investors with a bearish (negative) mindset. They apparently thought the declines in stock prices would continue, but they didn't. The market turned around, moved higher, and the short positions probably suffered losses.
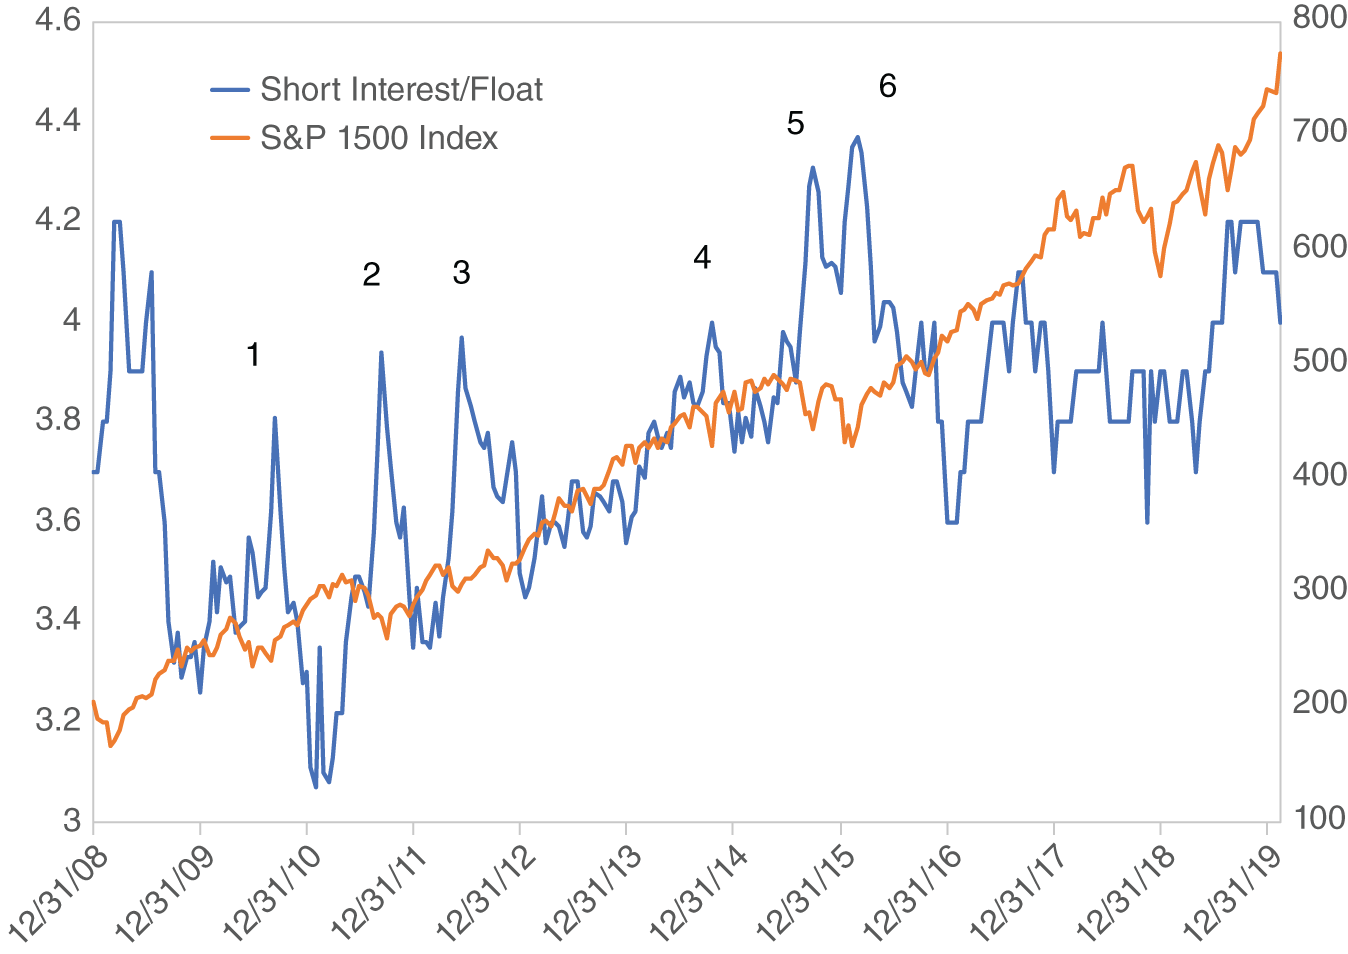
Figure 13.1 Short Interest/Float and S&P 1500 Index, 1/2009–2/2020
The actions of short sellers epitomize the bull market. Once it got going, people kept calling for, and predicting, its end. From 2010 through 2015, short sellers increased their activity right along with rising stock prices. Rather than embracing the bull market as it rolled along, they increased their bets against it. Based on the investor sentiment shown previously, plenty of investors thought the market should be going down, but it wasn't. Those bears must have thought prices were irrationally high or that bull markets must have time limitations. Looking back, these two intuitions were wrong.
Short interest, as a percent of float, hit twin peaks in September 2015 and February 2016, again at the bottom of short-term market dips, Points 5 and 6. From there, the S&P 1500 went to successive all-time highs over the next four years. You might think that would be enough to teach the bearish short sellers a lesson and they might throw in the towel, but no. From 2016 to 2018 the short interest/float index briefly dropped below 3.8% of float a few times, but otherwise remained fairly lofty in the 3.8% to 4% level.
Particularly interesting is the short selling after the low December 24, 2018. In Chapter 9, we described the sharp sell-off of late 2018 as a “volatility event,” the third one of this multiyear bull market. As the market marched to new all-time highs in 2019, short selling increased into the market advance. By fall 2019, the short interest/float index was back to levels seen in early 2009. Rather than embracing the bull market in 2019, speculators able to sell short were fighting it. As we know now, the market peaked out February 19, 2020, and the short sellers got bailed out by a virus and pandemic. It is difficult to believe they were selling short in 2019 based on predictions of the consequences of the virus in 2020.
Human Behavior–Economic Forecasting
Why were investors so wrong? Why didn't they recognize a bull market? We have a theory about intuitive-based forecasting.
The stock market is an excellent place for observing human behavior. From that, we have developed a theory about handling cause and effect, but first a little background on economic forecasting. If an economist thinks there is a relationship such that x can predict y, she can run a linear regression. Say she is working with monthly data. She can put in all the observations for x and y each month and an equation will be generated. That equation allows the economist to input a value for x and it will compute what y is expected to be. In Figure 13.2, the straight line represents the linear regression equation. The gray dots represent actual observations. As is normal for economic relationships, the dots are not right on the line. As made up here, the actual observations lie fairly close to the line, which would result in a high-correlation coefficient near the maximum possible of 1.00, meaning a strong relationship between x and y.
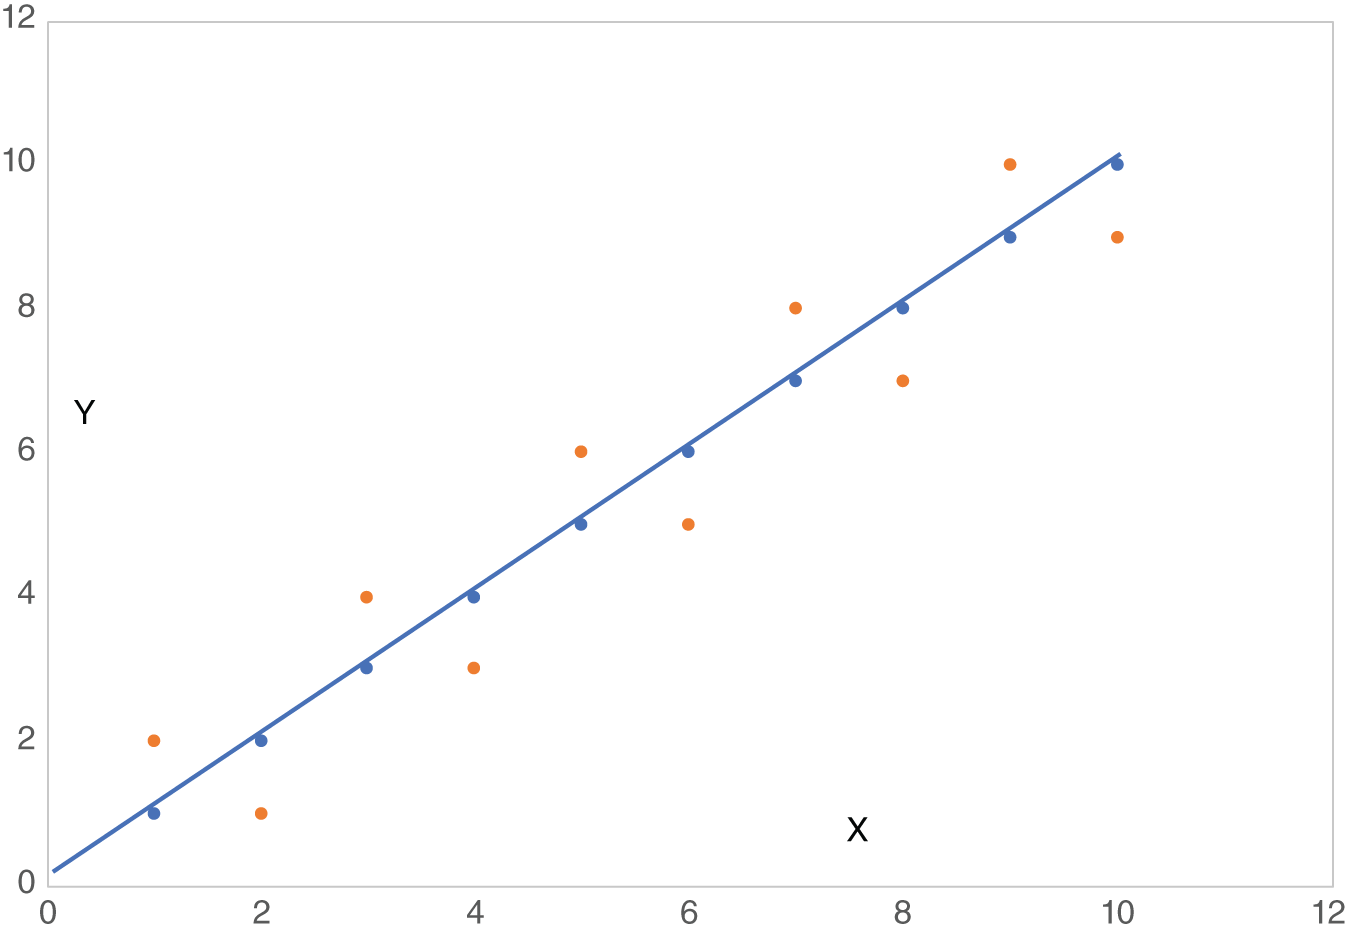
Figure 13.2 Hypothetical Linear Regression, High Correlation
Figure 13.3 shows the same line but with actual observations much further from the line, more like real-world relationships with a lower correlation coefficient. The lower the correlation coefficient, the less accurate the predictions from the equation. Now back to human behavior and our theory. Many investors and portfolio managers do not run econometric models. They rely on intuition. We believe humans overestimate correlation coefficients. They think the relationship between x and y is much stronger than it really is. In other words, if they would run linear regressions, they would find out that x is not as good at predicting y as they thought.
It is normal in economic forecasting to not have single variable models. For example, if an economist is developing a model to forecast inflation, the final model would require perhaps 10 to 20 inputs such as the price of oil, commodity prices in general, wages, capacity utilization, the value of the US dollar, etc. As a result of testing, each input variable would be weighted by its importance. The problem is, computer models can handle multiple variable inputs, but human intuition can't. Humans think one variable causes one result, x causes, or predicts, y. They just can't handle p, q, r, s, t, u, v, w, and x all together predict y. It appears using single variable intuitive economic forecasting caused investors to not love the multiyear bull market. For example, they thought lingering unemployment (x) would cause sluggish consumer spending (y), whereas consumer spending is a function of many more variables than just unemployment. They thought above-average growth in the money supply (x) would cause inflation (y), but again, inflation is a function of many variables. In actuality, more things than just x have to line up to move y.

Figure 13.3 Hypothetical Regression, Lower Correlation
The first two parts to our theory of intuitive forecasting are that the relationship being analyzed is not as strong as believed and the outcome being predicted is a function of a lot more than just one variable. The theory has a third leg. We believe intuitive-based forecasting overestimates the sensitivity of changes in y to changes in x. In statistics it is called the slope of the linear regression equation. Figure 13.4 shows two lines that could have been generated from linear regression of x on y. Line A indicates that small changes in x will result in large changes in y. We think intuitive-based forecasters believe they are dealing with A when an actual statistical test of the relationship would show something more like B. In other words, y is not as sensitive to changes in x as they think.
In Chapter 10, we addressed that during the multiyear bull market there were frequent claims of caution or warnings to get out of stocks based on the P/E ratio of the S&P 500 Index. They were saying that because the P/E was higher than normal, stock prices would either drop or at least could not go higher. As we now know, they were wrong and our three-legged theory explains why. They thought (1) P/E had a much higher correlation coefficient to future prices than it does; (2) future stock prices are a function of a lot more (variables) than just the P/E ratio; and finally, as we showed with our regression in Chapter 10, (3) the slope of the relationship between P/E and future prices is more flat than those prognosticators thought.

Figure 13.4 Slopes and Sensitivity
In Chapter 3, we showed how a journalist was wrong predicting a problem for bank profits because the yield curve flattened. All three human biases are at work in this example. The correlation between the shape of the yield curve and bank profits is probably not as high as she thought. There are many variables that determine bank profits. And the slope of the relationship between the shape of the yield curve and bank profits is not as steep as she believed.
In Chapter 7, we showed how some observers didn't think unemployment was dropping fast enough. They reasoned it would inhibit consumer spending. From there they reasoned the potential deficient consumer spending would be bad for stocks. Again, these are all three decision-making problems. Unemployment probably has a lower correlation with future consumer spending then they thought. Consumer spending is a function of many more variables than just unemployment. And the slope between unemployment and future consumer spending is probably much flatter than they thought. If we make the jump from unemployment to stock prices the links get even worse.
The end of Chapter 1 referenced three books that for various reasons predicted a bad stock market and proved to be wrong. They all based their predictions on a single variable and overestimated the strength of the relationship between that variable and the economy. Early in the bull market, the first book predicted a decade of slow economic growth and deflation based on deleveraging (debt reduction). The second book, about midway through the eleven-year bull market, predicted the economy would fall off a cliff and warned of a terrible stock market. The third book predicted a severe reversal to the stock market based primarily on global debt. Although all three books could serve as examples of the problem with single-variable forecasting, let's just take the middle one. From innovation to dynamic lifestyles, to changing regulations and taxes, there are probably many more things that influence the economy than just demographics. Then jumping from the economic outlook to the stock market, there are many more variables that influence the stock market than just the economy, such as but not limited to, Federal Reserve monetary policy, fiscal policy, and new product developments.
From inflation to unemployment, from housing starts to consumer spending, people took one variable and overestimated its ability to influence some other variable. We believe their intuitive single-variable forecasting models with three flaws kept them out of the great bull market.
Want to Relive It?
When I was a psychology major at The Ohio State University in the early 1970s, I took a class called “Psychology of Aging.” The first day the professor cited a research study. Elderly people were asked if they would want to go back and relive life, in other words, do it all over again. The overwhelming response was “no.” To a twenty-one-year-old looking forward to living life, that response was shocking. It just didn't make sense but was worthy of remembering.
This bull market gained 530% in two weeks less than eleven years. Seems fun and easy. Would we want to go back and relive it and do it again? Heck no! It wasn't fun. Just like the old folks in the psychology survey, we have “been there and done that.” It was like playing golf with all eighteen holes going in the same direction into a three-club wind. We fought through fears of inflation, deflation, double-dip recession, unemployment, and the rapid theme reversals. Viewing the glass as half full and the day as partly sunny was rewarding, just not always easy. The wall of worry that bull markets always climb just seemed taller this time. Hopefully, reading this book is an easy way for you to relive the bull market and learn how to recognize the next one.
Final Quiz
Who made the most money during this eleven-year bull market?
- Bearish skeptic
- Investor looking for alternative investments
- Someone hiding in CDs
- Pollyanna who bought and held stocks
The correct answer is D, Pollyanna.
Pollyanna would not have worried about inflation, deflation, double-dip recession, or unemployment. She would have thought the low interest rates were rational and normal. She would have believed in America and believed in the economy, despite its imperfect recovery, and favored cyclical, economically sensitive sectors. She would have believed financials would recover from being the epicenter of the financial crisis and prosper. Pollyanna, on her way to exceptional returns, would have tolerated, accepted, and ignored volatility. At social gatherings or at work, she would not have listened to others talk about the stock market, because they likely would have been bearish and generally unpleasant to be around. Way to go Pollyanna! Enjoy the rewards.
- Short sellers didn't believe in the bull market and had bad timing.
- There were problems with single variable forecasting.
- A doesn't cause B as much as you think it does.
- Pollyanna beat the bearish skeptic.