
Chapter 7
Unemployment
One of the biggest concerns that kept investors on the sidelines, missing the bull market, was that they did not think unemployment was improving fast enough. Stock market television focused in on every Friday's release of the jobs report as though it was extremely important for investing. Here is an example in the Wall Street Journal on June 30, 2010. Kevin Mahn, portfolio manager at Hennion & Walsh's SmartGrowth Funds, said the ADP report didn't bode well for the government's report or for consumer spending. “With an unemployment rate near 10% … we're not going to see consumers spending when they're out of work or worried about their job situation. That's where my concern lies and that's where consumer confidence is now starting to read that as well.”
The concern about unemployment was based on the belief that consumer spending was a function of employment. Some economist reasoned that if unemployment didn't drop quickly, the consumer would not spend.
Believing the focus on unemployment was wrong and contributing to investors missing out on the bull market we wrote a report in July 2010 titled “Unemployment Statistics Don't Tell You How to Invest.”
Figure 7.2 is an updated version of the graph shown in the 2010 paper through the end of 1989 and 2016 for the two recessions. During the first four years of recovery, unemployment improved a bit faster in the 1980s. Then, for the next year and a half, unemployment was about the same for each time period. After five and a half years into recovery, unemployment dropped below 5% for the recent expansion, whereas that level proved to be a barrier in the 1980s. In either case investors weren't buying unemployment. They were buying stocks and stock prices were moving higher. Based on the relationship between unemployment and stock prices the last time unemployment was greater than 10% (1981) we had a road map for stock prices following 2009.
In the 2010 paper we showed a table of returns for the S&P 500 Index for one, two, three, four, and five years out after the bottom in 1982 and hinted that with similar unemployment situations, the 2009 recovery stock market could follow a similar path. Table 7.3 is an updated version, and indeed the market marched higher both times while many investors worried needlessly about unemployment.

Figure 7.2 Unemployment Rate, 1982 and 2008 Recessions
Table 7.3 S&P 500 Returns Off Two Market Bottoms
| 8/21/82 (%) | 3/9/09 (%) | |
|---|---|---|
| 1 Year | 66.1 | 72.3 |
| 2 Years | 77.4 | 103.4 |
| 3 Years | 110.3 | 115.8 |
| 4 Years | 183.1 | 149.7 |
| 5 Years | 299.1 | 208.8 |
| 6 Years | 227.0 | 248.9 |
| 7 Years | 344.9 | 241.1 |
| 8 Years | 347.8 | 314.2 |
| 9 Years | 436.2 | 397.7 |
| 10 Years | 495.0 | 399.7 |
| 11 Years | 558.0 | 410.2 |
Spending Leads Employment
The primary premise behind the concern about unemployment was the belief that employment was the key to consumer spending, as seen in the quote in the opening paragraph of this chapter. In other words, many investors believed that jobs caused (lead to) spending; jobs go up, spending follows and goes up. Jobs go down, spending follows and goes down. For many investors the relationship of jobs causing spending had intuitive appeal. Unfortunately, it was wrong, so their reasoning was misguided.
We have examined personal consumption, nondurables, and unemployment back to 1966 and found no relationship to where unemployment leads spending. We just cannot find any empirical support for the notion that changes in jobs cause changes in spending. Just the opposite: we find slight support for the notion that spending leads or causes jobs. The last recession shows an example of spending leading jobs. Figure 7.3 shows personal consumption and unemployment during the last recession. Personal consumption hit its low June 30, 2009, point A. Unemployment hit its high six months later, December 31, 2009, point B. People started spending more, then six months later jobs increased (unemployment dropped). Jobs followed spending; spending didn't follow jobs.
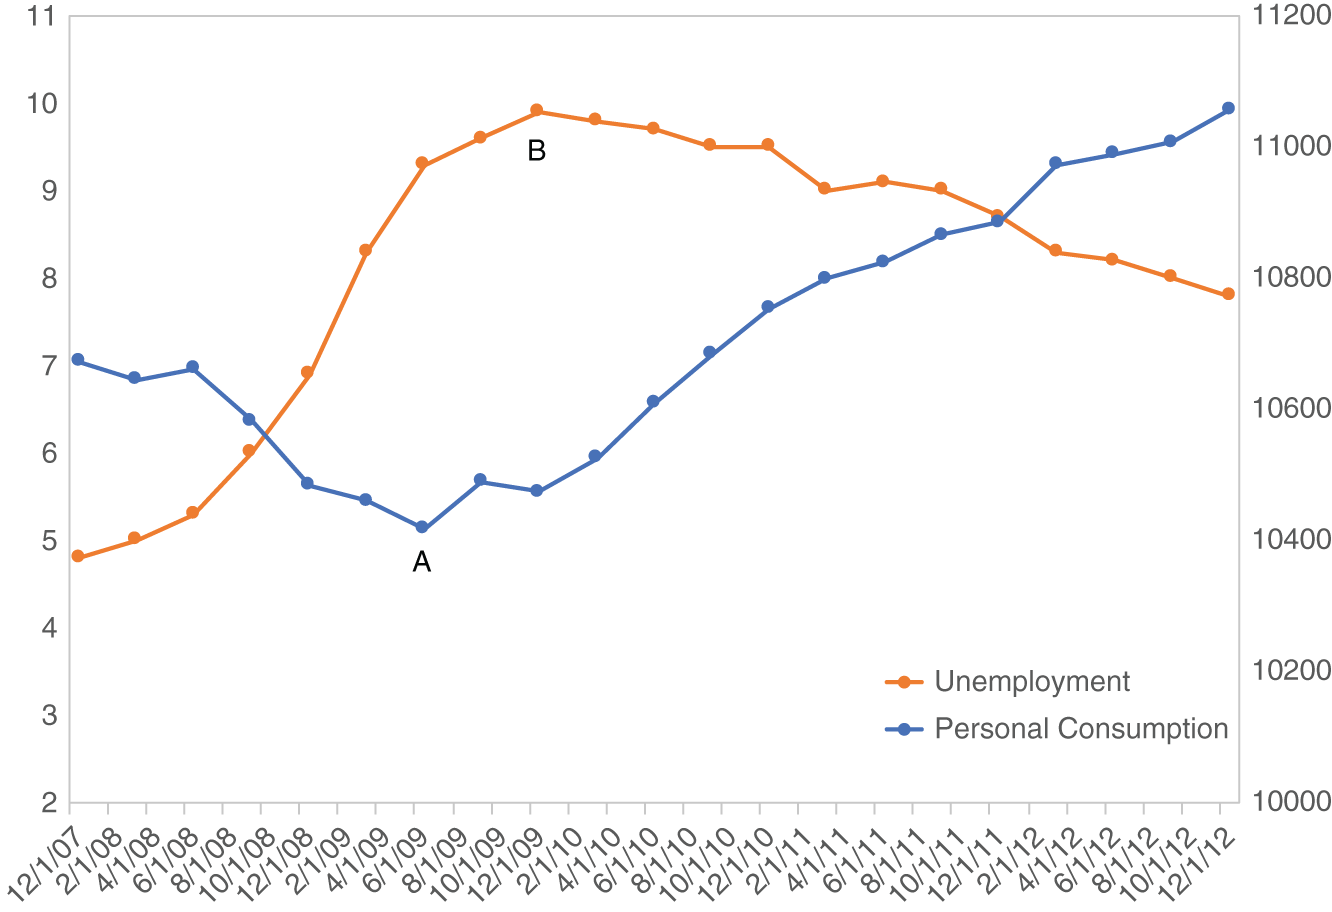
Figure 7.3 Personal Consumption and Unemployment, 12/31/07–12/31/12
In the 2020 recession, personal consumption and unemployment turned together. Personal consumption did not lead as in 2009, but again there was no relationship to where unemployment improved and then personal consumption followed. That is consistent with the concept that employment data are not predictors of future consumption behavior.
Unfortunately, many investors didn't fully participate in the great bull market because they thought unemployment was remaining too high. They reasoned that with stubbornly high unemployment, consumer spending would dwindle, but their concerns were misguided because there is no leading relationship between unemployment and consumer spending.
Phillips Curve
When unemployment did get down to the 5% range, inflation fears emerged, because some investors thought there might be upward pressure on wages. Here is a report we wrote in 2015 making the case that we could have low unemployment and low inflation.
The case for low unemployment and low inflation coexisting made in that report in 2015 proved correct. Unemployment continued to decline from 5.4% in April 2015 to 3.5% in February 2020. Inflation remained low and stock indexes climbed to all-time highs in 2018, 2019, and early 2020.
Summary
Early in the bull market some investors didn't think unemployment was dropping or improving quickly enough. Then later in the bull market they worried that low unemployment would cause inflation. Both fears proved wrong and probably kept some investors from participating in the bull market. Requiring greatly improving unemployment as a necessary condition for investing in stocks did not prove productive. For one, employment does not lead spending. Two, improvement in unemployment was just as sluggish following the 1981 recession and the stock market rallied nicely back then. Low unemployment and low inflation could coexist because we were on a very good Phillips curve.
- Unemployment is one of the biggest concerns among investors.
- Following the recessions of 1982 and 2009, the stock market rallied despite sluggish improvement in unemployment.
- There is no leading relationship between jobs and spending.
- Being on a friendly Phillips Curve, low inflation and low unemployment can coexist.