Chapter 1
“Unloved” Bull Markets
Along with many other observers, Tom Keene of Bloomberg Surveillance Radio called the multiyear bull market, from March 2009 to February 2020, “unloved.” We agree and believe that, for a variety of reasons, many investors chose not to participate in the market and missed out on a terrific opportunity to increase wealth. In previous bull markets, investors gained confidence and faith as the market advanced. Not this one. Unlike in previous bull markets, investors neither gained confidence nor faith in the workings of the market. If anything, the advance only encouraged the opposite: skepticism and doubt.
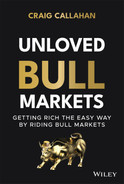
The Investment Company Institute (ICI) reports mutual fund data in its annual Investment Company Fact Book regarding annual inflows, outflows, and net flows for equity mutual funds beginning in 1984. Figure 1.1 shows annual net flows, which is inflows (sales) minus outflows (redemptions) in millions of dollars in gray scaled on the right. The S&P 500 Index is in black with quarterly observations scaled on the left.
Although the bull market in the early 1980s began in August 1982, equity fund flow data begin in 1984. Nevertheless, we see increasing positive flows in 1984, 1985, 1986, and 1987 as the S&P 500 moved higher. The market advance attracted investors, as they apparently gained confidence. There were net outflows in 1988 as investors moved away from equities after the market crash of October 1987. As it happens investors were captivated by the crash in their rearview mirrors and couldn't bear to face the bull market ahead.
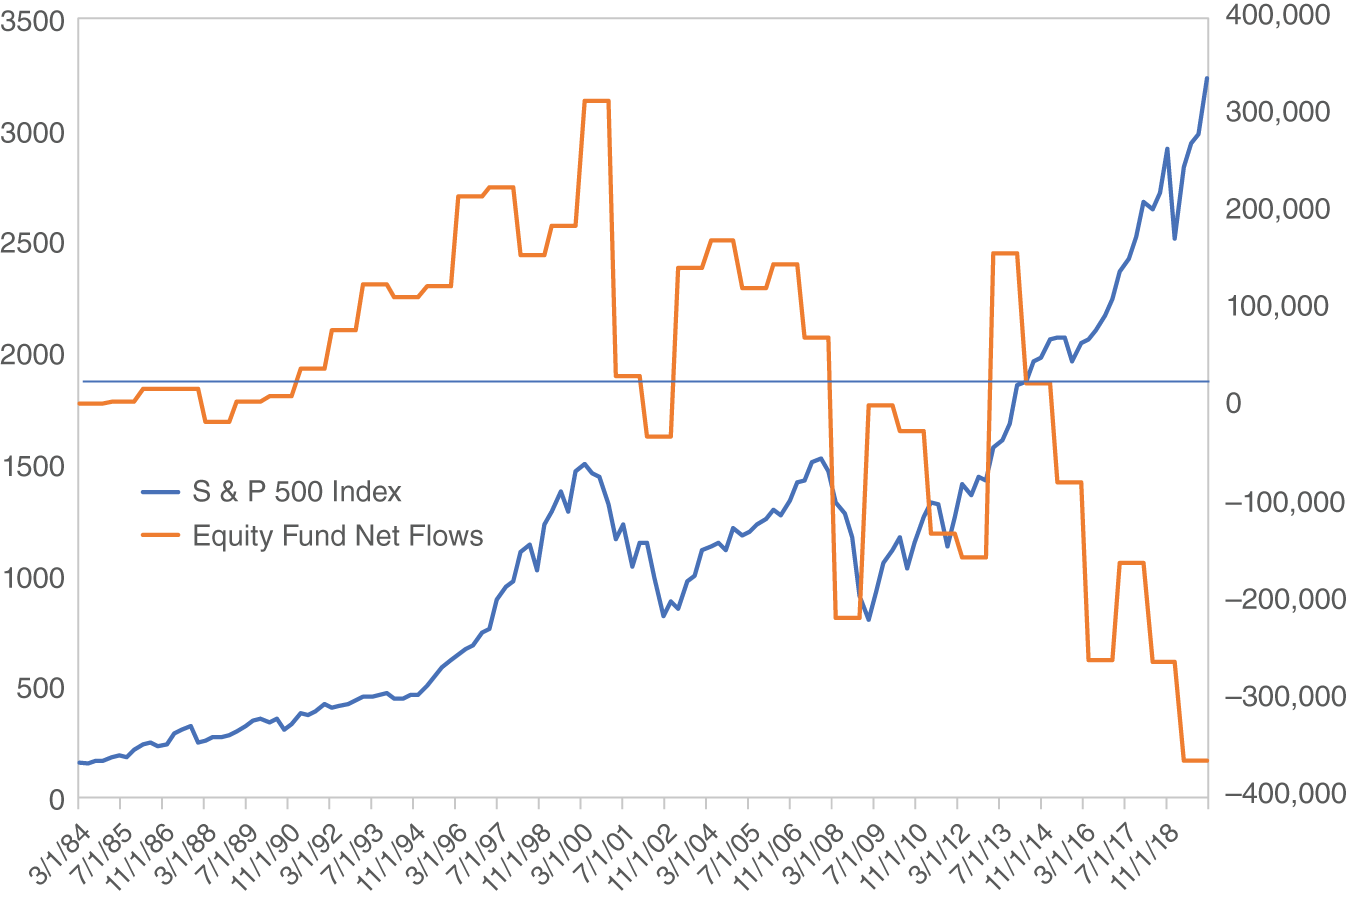
Figure 1.1 Equity Fund Net Flows and S&P 500 Index, 1984–2019
As the next bull market started, equity mutual fund net flows turned positive and grew accordingly with the market advance. The graph shows how the rising market enticed investors to buy equity mutual funds. In the end of that bull market, net flows hit their peak concurrent with the high of the S&P 500 Index. During the market decline following the “tech bubble” of early 2000, investors greatly reduced their investing into equity mutual funds. As the market advanced off the September 2002 low, investors sent net positive flows into equity mutual funds, not to the extent seen in the late 1990s but still enough to reflect confidence and optimism for equities.
Compared to the previous bull markets post 1987 and 2002, what makes this recent bull market “unloved”? The surge off the market low in early 2009 barely got net flows positive, but 2010, 2011, and 2012 saw a race for the exits even though the market moved higher. Unable to see the multiyear bull market ahead of them, the only emotions investors were capable of was simply, “Get me out of here!” Only one year, 2013, saw significant net positive flows, but after that brief period of confidence in equities, investors reverted to a negative view, especially in 2016, 2017, and 2018. These net redemptions were clearly early as the S&P 500 hit an all-time high February 2020 and those who redeemed along the way did not participate.
Outflows continued as the market moved higher in 2019, as reported in the Wall Street Journal December 9, 2019, in a front page article with the title “Individual Investors Bail on Stocks.” “The S&P 500 is having its best run in six years, but individual investors are fleeing stock funds at the fastest pace in decades.” It continued, “Investors have pulled $135.5 billion from U.S. stock-focused mutual funds and exchange traded funds so far this year, the biggest withdrawals on record, according to data provider Refinitiv Lipper, which tracked the data going back to 1992.”
Table 1.1 shows the average annual net flows into equity mutual funds for four bull markets. It was positive for the previous three bull markets but negative for the most recent one. The market was moving higher but investors were fleeing equities, unusual, but explained by investor sentiment in the next section.
Table 1.1 Average Annual Net Flows (in $ Millions)
| 1984–1987 | 12,649 |
| 1988–1999 | 106,520 |
| 2003–2007 | 132,040 |
| 2009–2019 | −112,279 |
Investor Sentiment
The America Association of Individual Investors (AAII) conducts a weekly investment sentiment survey of its members. It asks, “Are you bullish, neutral, or bearish?,” meaning, does the respondent think the stock market is going higher, sideways, or lower? The survey began July 1987. Figure 1.2 shows a rolling four-week average of the percent bullish divided by the percent bearish from July 1987 through February 2020. The middle line is the average for the entire time period, right near 1.50%, meaning typically three bulls for every two bears. The other two lines are one standard deviation above and below average. Before focusing on the recent bull market, some general observations are noteworthy. This group can really be wrong sometimes. The two arrows above highlight some extremes like the excessive bullishness precrash 1987 and at the tech bubble peak of early 2000. Those were terrible times to be bullish. The four arrows at the bottom represent great buying opportunities when the market went higher but investors were extremely (incorrectly) bearish: 1990, 1998, 2003, and 2009.

Figure 1.2 AAII Bull/Bear Ratio, Four-Week Average
For the eleven-year bull market from 2009 through 2020, the bull/bear ratio is generally below average. There are a few quick bursts of optimism, when the bull/bear ratio got one standard deviation above the long-term average, but the optimism is nowhere near the magnitude or duration of those that occurred in previous bull markets. This group was mostly wrong the entire way up, frequently posting bull/bear ratios one standard deviation below the historic average.
Table 1.2 shows the average bull/bear reading during four bull markets based on the weeks when the bull market began and ended. Perhaps the bull market of December 1987 through February 1994 was “unloved” also because its average bull/bear ratio was similarly low as the recent bull market. In Chapter 2 we make the case that the sharp market drop in October 2008 was a “crash” and similar to the crash of October 1987. Perhaps severe sudden drops in the market affect investors’ sentiment for the subsequent bull market. Maybe crashes inflict some psychological damage. In any case, investors were much more bullish during the bull markets of the late 1990s and early 2000s. In summary, during this recent bull market, investors usually, and incorrectly, thought the market was going to go lower. We can only presume that they did not fully participate in the bountiful returns. That would seem to qualify as “unloved.”
As evidence that the bull market was “unloved” we saw investors pulling money from equity mutual funds unlike during previous bull markets. Investor sentiment explained that behavior because investors had a more negative view of the market than in the previous two bull markets. This doubt and skepticism were not limited to the individual investor. Some institutional investors, acting as fiduciaries and often presumed to be more sophisticated, demonstrated the same lack of love for equities.
Table 1.2 Average Weekly Bull/Bear Ratio (in %)
| 12/1987–2/1994 | 125.0 |
| 12/1994–3/2000 | 188.3 |
| 9/2002–10/2007 | 174.5 |
| 3/2009–2/2020 | 126.3 |
Public Funds Pension Plans and Endowments
Public Funds are pension plans for state and local governments and professionals like firefighters and police. Employees are elected to a board that manages the plan, usually with the advice of a pension consultant. Public Funds Data, a website, provides data on more than six thousand of these plans nationwide. Figure 1.3 shows equities as a percent of assets for those plans from 2001 through 2020. During the bull market from 2003 to 2007 the plans held about 60% of their assets in equities, but after the bear market of 2008, the percentage dropped to near 50% and gradually drifted lower as the stock market moved higher. By tracking equity asset percentage, we can measure the confidence institutional investors had in the market. If they had believed in a continuing strong stock market, they could have increased the equity exposure back up to 60%, but they did not. In fact, equity exposure trended lower during the eleven-year bull market.

Figure 1.3 Public Funds, Equities as a Percent of Assets
It appears the decreased equity exposure cost the pension plans returns for the benefit of their constituents. As public funds diversify among asset classes that historically have underperformed equities, such as bonds, some alternatives, and some real estate, it is normal for them to lag an all-equity index during a bull market. From 2003 through 2007, average annual return of public funds was 9.78%, lagging the S&P 500, which averaged 13.15% per year. From 2009 through 2019, the amount of lag expanded, probably due to the reduction of equity exposure. Plan annual return was only 4.47% versus the S&P 500 Index of 15.26%.
Barron's covered institutional low-equity exposure in “The Case for Stocks,” by Andrew Bary, July 22, 2019. “Many big public pension funds like Calpers and endowments, which have big investments in alternative assets such as private equity and hedge funds, failed to beat the S&P 500 or even a 75%/25% mix of stocks and bonds the decade that ended June 2018. The Yale endowment, led by David Swensen, has just 3% of its portfolio in U.S. stocks and as a result has failed to participate fully in the huge market gains of the past ten years.”
An article by Barry Ritholtz on Bloomberg News, October 9, 2019, titled “Ivy League Endowments Make the Same Old Mistakes,” stated,
The latest university endowment return data dribbling out for the fiscal year ended June 30 is not pretty. Harvard's endowment gained 6.5%; while Yale's had an increase of just 5.7%; the University of Pennsylvania endowment gained 6.5%; Dartmouth yielded 7.5%. During the same time period, investors in the Standard & Poor's 500 Index had total returns, which includes dividends, of 10.4%; a portfolio of 60% stocks and 40% bonds returned 9.9%. This performance is consistent with the record of the past decade, with none of the Ivy endowments beating a 60–40 portfolio in the 2008–2018 period, though a couple did come close.
The article then continues, “The biggest contributors to the weak performance of the endowments were high exposure to hedge funds (2019 returns = 1.1%) and natural resources (2019 returns= −6.8%).”
An article in Barron's, October 14, 2019, with the title “Bull Market Beats Yale,” stated in its tag line, “U.S. university endowments, heavy in alternatives, again underperform stocks and bonds. Time for a change in the model.” The author, Nicholas Jasinski then pointed out, “The S&P 500 has produced annualized returns of 14.7% in that [ten-year] span, and a stock/bond mix has posted 11.4% gains a year—but the average return of 149 colleges and universities analyzed by Cambridge Associates was 8.6%.”
The eleven-year bull market had so much to offer, yet individual investors and institutional investors alike didn't fully participate. Occasionally articles appear talking about public funds being underfunded relative to their future pension obligations. It seems the first place to look is their asset allocation decision and reduced exposure to stocks. As for college endowments, perhaps it is easier to ask alumni for more money than it is to recognize and participate in a bull market.
For both public funds and endowments their use of “alternatives” is puzzling. One feature of alternatives, like some hedge funds, is their attempt to be low in correlation with the stock market. Low correlation is a diversification tool to reduce overall portfolio volatility, but why should public funds and endowments care about volatility? It would seem that they have an investment time horizon of twenty to thirty years. We have argued, in an article coauthored with Tom Howard, that volatility is not the correct definition of risk. We suggested underperforming an investor's retirement goal is risk. With the growth of alternative investments, we have often asked the question, “Who needs an alternative to making 530% in eleven years?”
Anecdotal Examples of Unloved
Investors or reporters would often ask, “Why did the stock market go up today?” Their tone clearly conveyed skepticism and the belief that the stock market should not be going higher. The simple, correct, but flippant answer would have been, “We are in a bull market, stock prices are supposed to go higher!” That answer would not have worked because people do not like being told they are wrong, and they did not realize a bull market was under way.
Even the terminology used to describe the market conveyed the unloved nature. The short-term dips of 5% to 10% were called corrections, which implied that the market was not supposed to be going higher and that it was correcting itself by going down. As we know now, the correct path was upward. The market was supposed to be going higher. In our research department, just to keep our sanity and our long-term view intact, we labeled those dips incorrections.
In previous bull markets, if the market was higher one day, there would be more buying the next day by momentum investors. It is often referred to as “fear of missing the boat” as it is pulling away from the dock. In a bull market it is usually a terrible feeling seeing the market move higher while holding cash. During this bull market, however, if the market was higher on a day the next day saw a sell-off thirty to sixty minutes into the trading day. It felt like investors, not realizing we were in a bull market, felt the advance the day before gave them a chance to get out. So to move higher two days in a row, buyers had to take out the weak jittery money.
One metric used by investors who use technical analysis is comparing the number of issues that advance each day to the number that decline. If over a recent period of, say, ten or thirty days a lot more issues are advancing than declining, there are two interpretations. One is that the advance has breadth and is sustainable. The other is that the market is “overbought” and will soon turn and go lower. Commentary during the bull market typically favored the negative view as the market was labeled “overbought.” It appears that the analyst's predetermined bearish bias influenced the interpretation of the data.
For the eleven-year bull market and especially for the new one that began March 2020, there is a new generation of investor. These new investors are very situational. They don't believe in the broad market, just special situations like the unique stories of Amazon or Tesla. In the early stages of the 2020 bull market, it was the “work from home” theme. How would investors behave if they didn't believe in the bull market but just invested or speculated in a stock they think is unique? They tend to be jittery and set very quick sell thresholds that we believe explains some of the volatility and rapid theme changes that occurred during the eleven-year bull market and the new 2020 bull market.
Confidence
Every week Barron's computes and publishes its Confidence Index. The editors define it as the ratio of the yield on high-grade bonds divided by the yield on intermediate-grade bonds. Think of it as measuring the confidence investors have in the financial system. Naturally investors need a higher yield on the riskier intermediate-grade bonds than they do on the higher rated bonds. If the two yields are very close, say high-grade is 95% of intermediate-grade, investors have confidence in the system and the ability of intermediate-grade companies to honor their payments. But if there is a wide yield gap, say the yield on higher-grade bonds is only 60% of the much higher yield on intermediate-grade bonds, investors would be showing little confidence in the financial system and intermediate-grade companies’ abilities to honor their payments.
Figure 1.4 shows the Confidence Index from December 29, 1978, through February 21, 2020. The straight line represents the average reading for three different time periods. It averaged 93.2 from December 29, 1978, through December 31, 1999. Then it dropped and averaged 83.5 from January 7, 2000, through December 31, 2008. From January 2, 2009, through February 21, 2020, covering the eleven-year bull market and a couple of months before it began, it averaged only 73.5. This recent bull market took place in a setting of low investor confidence in the financial system.

Figure 1.4 Barron's Confidence Index, 12/29/1978–2/21/2020
We contend an investor's confidence affects how he or she receives and processes news. If confidence is high, bad news might get dismissed or softened in its perception. If confidence is low, bad news is on the fast track to negative sensors. During this bull market, investors were viewing the glass as half empty. In this state, they were overly sensitive to mediocre and bad news, with good news or bullish indicators flying under their radar. It is almost as if they were screaming, “Don't tell me facts, I'm too scared to listen.”
Yields Suggest “Unloved”
Interest payments on 10-year Treasury notes are fixed over the life of the note. Dividends for companies in the S&P 500 Index have grown through the years. As seen in Figure 1.5 of year-end yields for the 10-year Treasury and the S&P 500 Index, the yield is usually higher for the 10-year Treasury. Investors are willing to accept a lower current yield on stocks because they expect the dividends to grow. Since 1962, the yield on the 10-year Treasury has exceeded the yield on the S&P 500, on average, by about 300 basis points.

Figure 1.5 Yields: S&P 500 and 10-Year Treasury 1962–2020
There have been six times when the yield on the S&P 500 Index has been greater than the yield on the 10-year Treasury: year-ends 1962, 2008, 2011, 2012, 2019, and 2020. Once the two were about equal: year-end 2015. What was going on these seven times to reverse a normal, rational yield relationship? News events at the time of a few of these could explain investor behavior. The Cuban Missile Crisis was October 1962. The financial crisis was October 2008. The European debt crisis round two was September 2011. Investors were obviously afraid of owning stocks and were clinging to the safety of Treasury notes. They sold stocks and bid up the price of the Treasury notes, which lowered their yield. Five times during this multiyear bull market, investors disliked stocks so much, we were offered a higher yield on the S&P 500 than on the 10-year Treasury, despite the potential for the S&P 500 to provide dividend growth and capital appreciation. We had not seen this desperate yield relationship for forty-six years, then it appeared five times just before and during this multiyear bull market.
When the yield on the S&P 500 is equal to or exceeding the yield on the 10-year Treasury it signals that stocks are cheap and bonds are expensive. It is telling us investors like bonds and dislike equities and has been a very good “buy” signal for equities. Table 1.3 shows the rates of return for the S&P 500 for one and two years after the seven times of unusual relative yields.
Table 1.3 Rates of Return for the S&P 500 (%)
| Year | One-Year | Two-Year |
|---|---|---|
| 1962 | 22.8 | 42.9 |
| 2008 | 26.5 | 45.5 |
| 2011 | 16.0 | 53.6 |
| 2012 | 34.6 | 53.0 |
| 2015 | 12.0 | 36.4 |
| 2019 | 18.3 | ??? |
| 2020 | ??? | ??? |
Other Assets
It might have been alright to miss out on the bull market in domestic equities if similar returns could have been earned in other types of assets, but that is not the case. Domestic equities were clearly the sweet spot of investing during the multiyear bull market. Figure 1.6 shows cumulative returns for 2009 through 2019 for the S&P 1500 Index, Gold, the Commodities Research Board (CRB) Index, three bond indexes, and the Consumer Price Index. Although the nonstock assets beat inflation, they trailed equities severely. The stock market was the place to be and missing out on the bull market was a big deal.

Figure 1.6 Cumulative Return 2009–2019
Does Rate of Return Matter?
You bet it does. From the low on March 9, 2009, to the peak on February 19, 2020, the S&P 500 Index gained at an annual rate of 18.3%. We will not use that for this example because it was above average and exceptional. Let's tone it down and use 10% per year, right near the historic average for equities. Figure 1.7 shows the growth of $1.00 over twenty years at 10% per year. It also shows the growth at 5% per year, a rate slightly above what the public fund pension plans earned during the bull market.
Of course, for the public funds the starting amount could easily be $1 billion, so after twenty years there is a $4 billion gap for each billion invested. Even after ten years the gap is almost $1 billion per billion invested. For an individual investor, if the starting amount is $100,000 the difference is over a $400,000 after twenty years. The same math applies to financial advisors for whom the primary determinant of the value of their practice is assets under management. The higher returns earned by the investors, the more the value of the practice grows. Rate of return and participating in bull markets matter because if the goal for retirement is to buy a residence in a tropical location or to travel, the seller of the residence or the travel agent doesn't take risk-adjusted returns. They take money. If the investor can tolerate a little volatility, the market can do the heavy lifting to get to retirement goals.
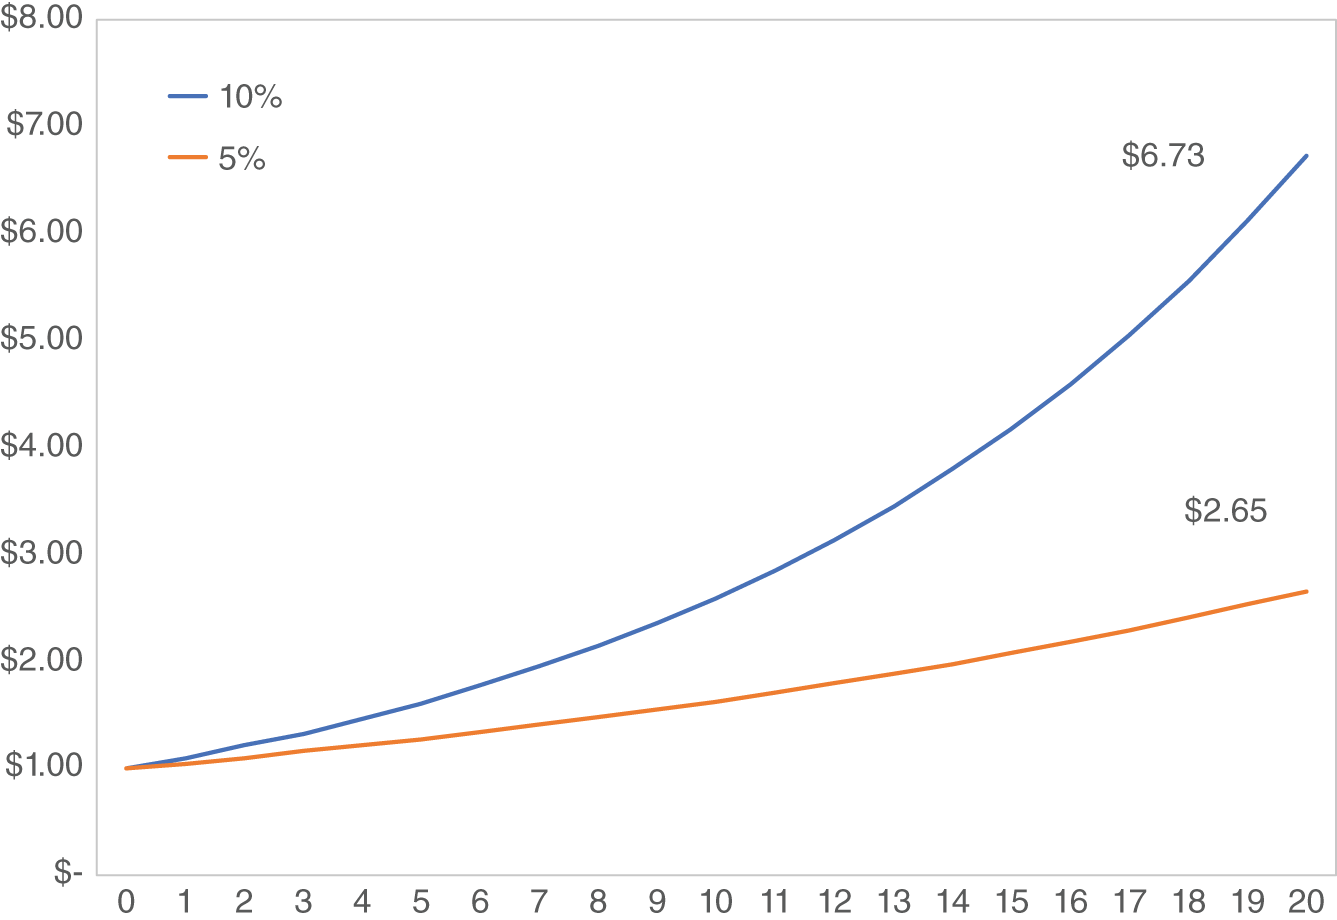
Figure 1.7 Compounding at 10% and 5%
A couple of years before the end of the eleven-year bull market, I was working out at my fitness center in Naples, Florida. A stock market channel was on most of the TVs and the market was up that day. One retired fellow joked to his buddies, “If the stock market keeps going up, I'll actually be able to afford my life style.”
Top Ten Reasons I Missed the Bull Market
Throughout this multiyear bull market we wrote papers addressing concerns such as unemployment, inflation, deflation, double-dip recession, rising interest rates and monetary policy, and so on that were keeping investors from being invested. These conditions will be addressed in more depth in later chapters. Our presentations were logical and full of data and statistics, but we suspect not successful in getting investors to overcome their fears. In 2015, we tried a different approach and poked fun at investors who were missing out on the bull market. We borrowed from David Letterman and his top-ten lists that he used on his “Late Night Show.” We could not limit the list to ten, so we called it “The Top 15 Reasons I Missed the Bull Market.” Here they are as written in 2015:
- 15. I didn't notice S&P 500 earnings have grown 107% from 2008.
- 14. After 2008, I changed my risk tolerance.
- 13. I am stuck in the 1970s and thought inflation would come back and interest rates would rise.
- 12. I was waiting for unemployment to get below 5%.
- 11. I bought gold instead of equities.
- 10. I didn't like the bailouts.
- 9. I don't understand the Federal Reserve and thought the government was “printing money.”
- 8. I forgot every economic recovery is different and I was waiting for housing to recover.
- 7. I heard Fed easing was like “pushing on a string.”
- 6. I saw a head and shoulders top-forming a few times.
- 5. I thought P/E ratios were too high.
- 4. I was told we are in a seventeen-year secular bear market.
- 3. I worried about deflation and Greek sovereign debt.
- 2. My accountant told me I didn't need huge capital gains.
And the number one reason I missed the bull market of the last six years is:
- 1. I really like earning nothing on CDs.
Some of these will be addressed in later chapters. Thanks, David!
Unloved? Why?
Figure 1.8 is the S&P 1500 Index from January 30, 2009 (about one month before the bottom) through the peak February 2020. Impressive, as even a cursory look boggles the mind. There were a few dips and pauses along the way but with 20/20 hindsight it appears it would have been easy to just buy and hold and go for the profitable ride. So why did investors net redeem out of equity mutual funds? Why was investor sentiment mostly below average? Why did public funds reduce their equity exposure as a percent of assets? What was happening that kept investors from embracing this bull market like they did previous bull markets?
Figure 1.8 S&P 1500 Index 1/30/09–2/19/20
Throughout the eleven years there was no shortage of skeptical, bearish commentary in the financial media and from advisory services and professional money managers. As for the books, one of the early ones, first published in 2010 and updated in 2012, predicted a decade of slow economic growth and deflation based on deleveraging. Regarding stocks, the author predicted falling P/E ratios, muted price appreciation, and recommended avoiding stocks related to big ticket consumer purchases, consumer lending, and homebuilding. He favored buying Treasury bonds, consumer staples, and North American energy. (Chapter 2 will confirm how wrong these predictions and recommendations were.) A second book in 2014 based its view on demographics and predicted the economy would fall off a cliff and that the stock market would be terrible from 2014 to 2019. The author warned that you needed to prepare for the worst downturn and crash of your lifetime beginning in early to mid-2014. A third book in 2018 labeled the bull market “fake” and claimed we could fake a bull market for just a short, limited amount of time. The author based the potential for a severe market reversal on global debt and Federal Reserve policy. Rather than fake, a 530% gain in eleven years and a 765% gain through August 2021 seems very real to an investor who participated. Did the books influence investors and contribute to their bearish sentiment or did investors’ predetermined bearish position simply make them receptive the gloom and doom theme? Maybe a little of both.
As for regular commentary, there were fears of higher inflation, deflation, double-dip recession, and rising interest rates at various times along the way. Early on many skeptics didn't like what they called “bailouts.” Some thought the easy monetary policy made the bull market phony, fabricated, and unsustainable. Some investors did not think the unemployment rate was dropping fast enough. Negative interest rates, new and puzzling for this generation, scared many investors away. Valuation seemed to be a problem for many because there were frequent claims that stocks were too expensive. Chapter by chapter, let's look into these situations and see if there was a lesson to be learned. After all, there will be more bull markets in the future, and we don't want to miss out on them.