4
Fast‐Switching Mode with CLEARInk Structure
Robert J. Fleming PhD
CTO CLEARink Displays, San Jose, CA, USA
4.1 Introduction
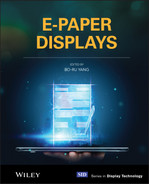
Ideally, reflective displays offer the same features as traditional emissive displays but with lower power usage, excellent outdoor readability, better viewing angle performance, and a paper‐like experience that reduces eye strain. Researchers for decades have been developing reflective display technologies to meet as many of these features as possible. Reflective displays modulate the light that impacts the surface of the display from the surrounding environment. One way to broadly categorize reflective display technologies is through the optical mechanism by which the display returns the ambient light to the user. This classification leads to three general categories of reflective displays, diffuse reflective, specular reflective, and retroreflective (Figure 4.1).
White paper is a Lambertian or diffuse reflector, meaning light that impacts the paper's surface is reflected uniformly in all directions. E Ink's (E Ink Corporation/E Ink Holdings – Boston/Taiwan) electrophoretic display technology is also a diffuse reflector and can exhibit a paper‐like viewing experience (Figure 4.1a. In a clear fluid, the E Ink technology utilizes negatively charged white particles and positively charged black particles. [1]. The light is modulated by applying an electric field and preferentially moving either the white particles or the black particles to the surface to selectively reflect or absorb the ambient light impinging the front surface of the display [1]. The E Ink technology can provide a very nice paper‐like viewing experience (as seen in the Amazon Kindle), but the limited reflected brightness brings challenges we will discuss below in the section about color [2].
Specular reflection is when modulated light returns at the same angle as the light source, Figure 4.1b. Multiple display technologies can be classified as “specular reflective” type displays, and examples are reflective LCD [3], electro‐wetting type, MEMs type [4, 5], and phase‐change type [6]. These types of displays generally employ a metallic reflector. What is important to note about specular reflective‐type displays is that light is not returned uniformly in all directions but preferentially at the same angle as the incoming light source. This results in “optical gain” meaning, more light can be returned at certain lighting and viewing directions than the Lambertian type. However, there are disadvantage, the optical gain peak can be very close to the glare angle (reflection off the front surface, which can be particularly problematic in direct sunlight), and viewing angle performance can be significantly compromised. In the retro‐reflective type display [7, 8] (Figure 4.1c), light is preferentially returned to its source by a principle referred to as retroreflection, to be discussed in detail below. Retroreflective displays also result in optical gain but the opposite direction as specular reflective‐type displays; this can be advantageous because the optical gain peak is in the opposite direction as the glare peak.
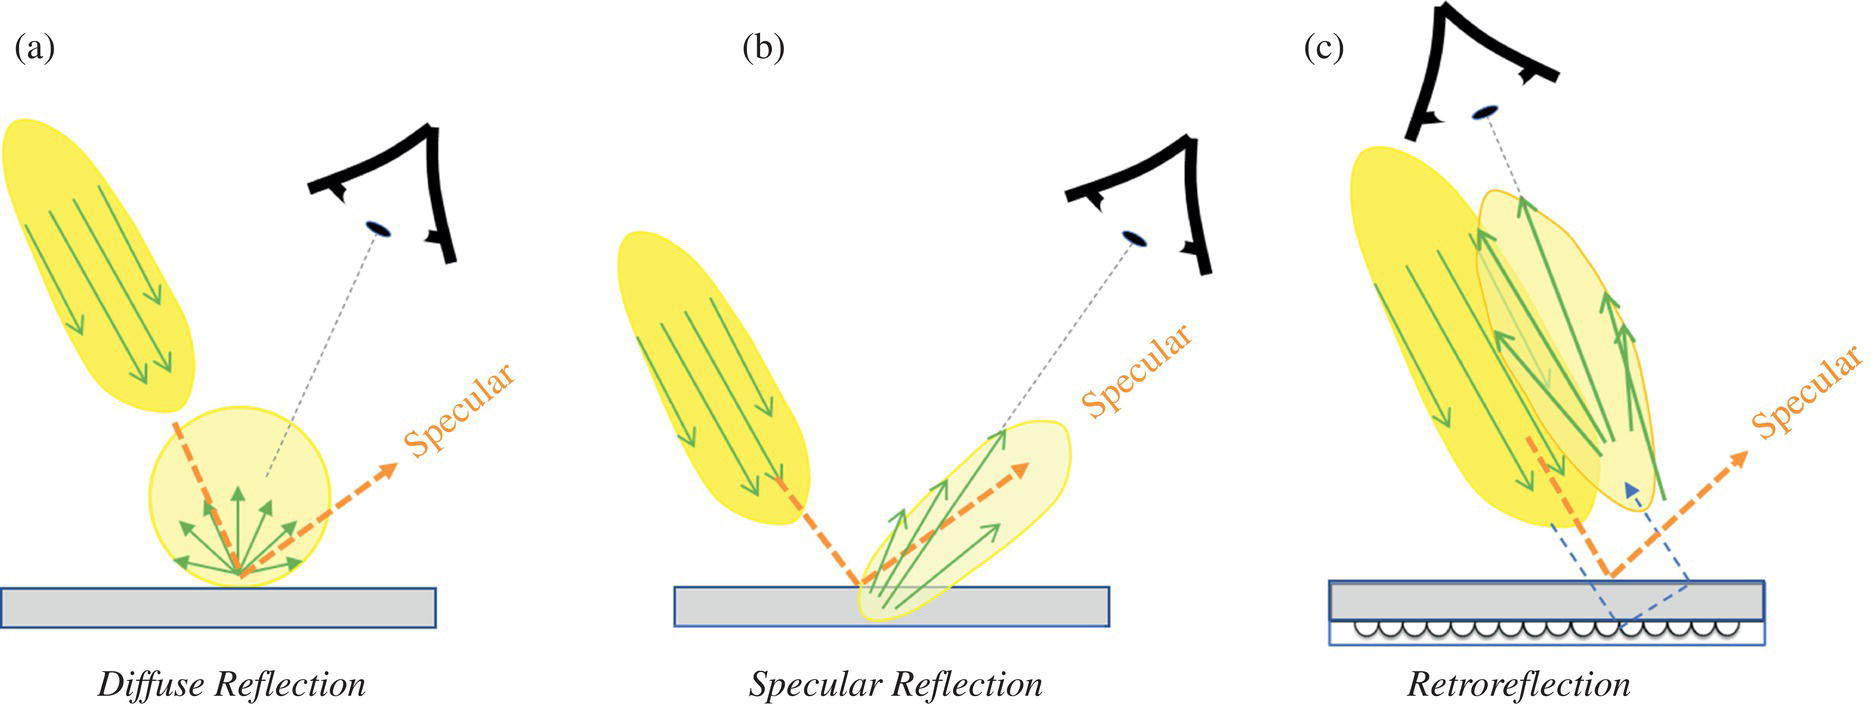
Figure 4.1 Types of reflective displays, (a) diffuse reflective, (b) specular reflective, and (c) retroreflective. The incoming light is shown coming in from the top left for all cases for reference. The direction of light returned by the display is shown by the light‐yellow bubble. The ideal viewing condition is shown by the location of the eye cross‐section.
The core of the CLEARink Displays' technology is based on two fundamental concepts in optics. The first is the phenomenon known as Total Internal Reflection (TIR) [9, 10], the second is a clever use of geometrical optics known as retroreflection.
When a light ray impacts the surface of a substantially uniform medium, the light ray is refracted (transmitted) and/or reflected (given the optical structure is much larger than the wavelength of interest) [9]. In the 1920s it was discovered (likely by observation, hence the nickname “cat's eyes”) that glass spheres, when attached to information signs, improved their visibility at night. In the 1930s the 3M Corporation developed the first glass bead type retroreflectors used in traffic signs [11]. Examples of two types of simple retroreflectors are shown in Figure 4.2. These simple optical engines return a light ray substantially back to its source, i.e., retroreflected. This is a highly advantageous property for viewing traffic signs at night because the light from the car's headlights hits the surface of the traffic sign and is preferentially returned to the eyes of the car's driver. Even in 2020, 3M has substantial businesses, offering more than 30 products based on retroreflection. Examples of applications are traffic signage, personal safety (worn on the person for visibility), commercial graphics, highway pavement markings, etc.

Figure 4.2 Two types of simple retroreflectors, (a) spherical glass bead type, (b) prism type. In (a) a light ray enters a high refractive index glass sphere with a curved metalized reflector placed at the focal point behind the glass sphere. In (b) a light ray enters the prism of high refractive index and reflects at the low refractive index boundaries (white triangle region).
![Schematic illustration of description of Snell's law from rays (a)–(d) emitting from a light source (blue dot) in high refractive index medium n1 and impacting the surface of lower refractive index medium n2 with adapted from [9].](https://imgdetail.ebookreading.net/2023/10/9781119745587/9781119745587__9781119745587__files__images__c04f003.jpg)
Figure 4.3 Description of Snell's law from rays (a)–(d) emitting from a light source (blue dot) in high refractive index medium n1 and impacting the surface of lower refractive index medium n2 with adapted from [9].
Retroreflectors developed by 3M can return more than 60% of the light to its source [12]. In a display application, particularly of the reflective display type, it would be very beneficial if a significant fraction of the available light could be preferentially re‐directed to the viewer's eyes. This was the original idea behind the CLEARink Display approach to making a reflective display brighter [13]. However, there was a problem, how could a retroreflector be selectively “turned off” to make a digitally addressable display? The answer to this question lies within nuanced features of what is known as TIR.
When light passes from a high refractive index medium to a lower and the boundary between the two media is sharp (substantially discontinuous), the speed of light increases, and the light ray is refracted (changes angle). Snell's Law conveniently describes the relationship between the refractive indices of the two media and their angles of refraction. Snell’s law is commonly written in the form n1sinQ1 = n2sinQ2 [9]. Figure 4.3 below shows light rays; (a), (b), (c), and (d) emanating from a point in a high refractive index medium, n1, and impacting a low refractive index medium, n2. Because n1 is larger than n2, Snell's law requires that rays (a) and (b) bend or refract away from the normal. A critical angle of incidence is reached when the angle of refraction reaches 90°. This is designated at Qc. The critical angle is critical for two reasons; (i) because all incident angles Q1 > Qc undergo TIR (i.e., the light ray is reflected) as shown by ray (d), and (ii) because many interesting phenomena happen at and very near the critical angle (this will be discussed in more detail below).
But how can light traveling through a high refractive index medium impact a surface of low refractive index at an angle greater than the critical angle and not undergo TIR? How can TIR be inhibited or “frustrated”? A closer investigation of phenomena near the critical angle reveals very complex behavior. Returning to Figure 4.3, a complete description would show the rays as plane waves in the form of Ei = E0i exp [i(ki· r‐ ωi t)]. When the transmitted and reflected waves are derived using the Fresnel Equations, a surface wave propagates along the plane between the two media [14]. This surface wave is known as the evanescent wave. It decays rapidly in the direction of the low index medium, the rate of decay is determined by the wavelength of light, refractive indices of the two media, and the angle of incidence. What is most important to note is that this surface wave does penetrate the low index medium, making it possible for energy to be transferred across a gap in what is known as frustrated total internal reflection (fTIR) [14]. The above description is based on the assumption of a system as idealized boundaries and infinite plane waves, whereas natural systems are much more complicated. In natural systems, the boundary between two interfaces is not perfectly sharp, “boundaries” are made of materials comprising molecules and atoms. The real interface between the low and high index materials is a medium with different optical properties than either layer. Consequently, the critical angle in most natural systems is far from perfectly sharp [10]. However, with a proper fundamental understanding of the material and interfacial properties, the critical angle can be “engineered” to be sharp or broad depending on the desired result of the particular system.
4.2 CLEARink Display Optics
The original concept for a retroreflective type display was first developed by the University of British Columbia, Professor Lorne Whitehead. The principles of TIR and retroreflection were well known because of his previous work with 3M on Brightness Enhancement Films for liquid crystalline displays and prismatic type retroreflectors for traffic safety signs. Combining these observations, knowledge, and experience, he theorized that by selectively frustrating the TIR of a retroreflector, a “retro‐reflective type” reflective display could be made. He filed a patent on this invention in 1997 [13]. Coincidentally, 1997 was the same year the E Ink Corporation was spun out of the MIT Media Lab.
The original invention for a retroreflective type display was to frustrate TIR in a prismatic type retroreflector by selectively contacting the surface undergoing reflection with a silicone rubber filled with light‐absorbing particles [13]; thereby “frustrating” or inhibiting TIR. In this case, the low refractive index medium would be air. Light modulation were by the physical application of force to contact the filled silicone rubber to the reflecting surface. The next iteration of the original invention was to suspend charged absorptive particles in a low refractive index fluid. By applying an electrostatic force, the particles could be moved, by electrophoresis, into and away from the reflecting surface [15]. High reflectivity with good contrast ratios was achieved using the prism type retroreflectors, but the angular performance remained poor.
The next iteration on the retroreflective type display was to employ hemispherical shaped micro‐lenses in an array. This incarnation became the basis for the modern CLEARink type display. This invention by Professor Lorne Whitehead developed from his observation of hemispherical water droplets on a transparent polyethylene bag one wet Vancouver day. Prof. Whitehead and then Ph.D. student Dr. Michele Mossman, were working on the prismatic retroreflective type display and together built the first prototype demonstrating this display concept. The micro‐lens array approach dramatically improved the angular performance. However, at angles near the retroreflection peak, the reflected brightness was lower than what could be achieved with prism‐type retroreflectors. Monte Carlo ray‐trace simulations of different light paths entering a single hemispherical microstructured lens (Figure 4.4) yielded several insights on the optics of lens‐type retroreflective display. The first insight was that the light was not truly retroreflected. The light rays rarely returned directly to the source. Instead, the retroreflected light returned broadly back to the source. As a result, it is more accurate to classify the CLEARink type display as a semi‐retroreflective display. The semi‐retroreflective properties of the optical structures result in a paper‐like viewing experience with good angular performance. The second major insight was that light entering the center portion of the lens impacts the back surface of the lens at an angle less than the critical angle, Qc, and therefore does not reflect but passes straight through; these paths can be observed in Figure 4.4. The light passing through the lens at angles less than the critical angle became referred to as “the dark pupil” effect. The dark pupil effect was initially a major obstacle to achieving high brightness..
The semi‐retroreflective properties of the microlens array provide a significant advantage over current reflective display technologies. When using a reflective display, the light source is generally fixed over the viewer, shining down on display. A diffuse white surface appears white when viewed from straight on, at an angle, and moved around the display. However, the white appearance is reduced to gray when colored filters are added because of the loss in brightness. The apparent brightness can be regained by introducing optical gain. The disadvantage of semi‐specular gain is that the gain is lost if the angle of the display is changed. The semi‐retro‐reflective gain approach works well for many display angles, as shown in Figure 4.5. The dotted oval in Figure 4.5 represents the semi‐retroreflection region of high optical gain, which changes very little from Figure 4.5a,b as the sample is rotated. The viewing brightness is similar between Figure 4.5a,b. Detailed analysis on viewing angle performance will be provided in the following sections.

Figure 4.4 Monte Carlo simulation of 10 light rays entering a hemisphere type lens structure.

Figure 4.5 Simple diagram showing optical gain of a semi‐retroreflective display at tilt angles (a) perpendicular to the viewer, and (b) 45° tilt away from the viewer.
CLEARink Displays was spun out of the University of British Columbia in 2012 by the co‐founders, Professor Lorne Whitehead, the original inventor, and Frank Christiaens. A small team in Vancouver, Canada, was formed to continue the development of the CLEARink technology. In parallel, Merck KGaA developed electrophoretic ink systems [16, 17], and in 2012 CLEARink began testing Merck electrophoretic ink formulations. The first active‐matrix prototype using a Merck developed single‐particle ink and a CLEARink hemisphere microstructured array demonstrating fTIR switching was reported in 2015 [18]. Then in 2015, the CLEARink Displays headquarters was moved to Silicon Valley, first in Sunnyvale, then to Fremont, California. In 2016 a materials development R&D lab, cleanroom, microreplication lab, and display fabrication developmental processes were brought online. In 2017 CLEARink entered a materials development agreement with Merck KGaA to commercialize the CLEARink Display technology. In May 2017, the small CLEARink team led by Dr. Robert Fleming, CTO, exhibited its prototype displays at the Society for Information Displays annual DisplayWeek trade show and won the Best in Show Award. The company won several other awards, including the IDTechEx award (Figure 4.6).

Figure 4.6 CLEARink Displays' Dr. Robert Fleming, CTO, and Dr. Joel Pollack, Board Member, accepting the 2017 IDTechEx award.
Source: Photo courtesy of Sri Peruvemba.
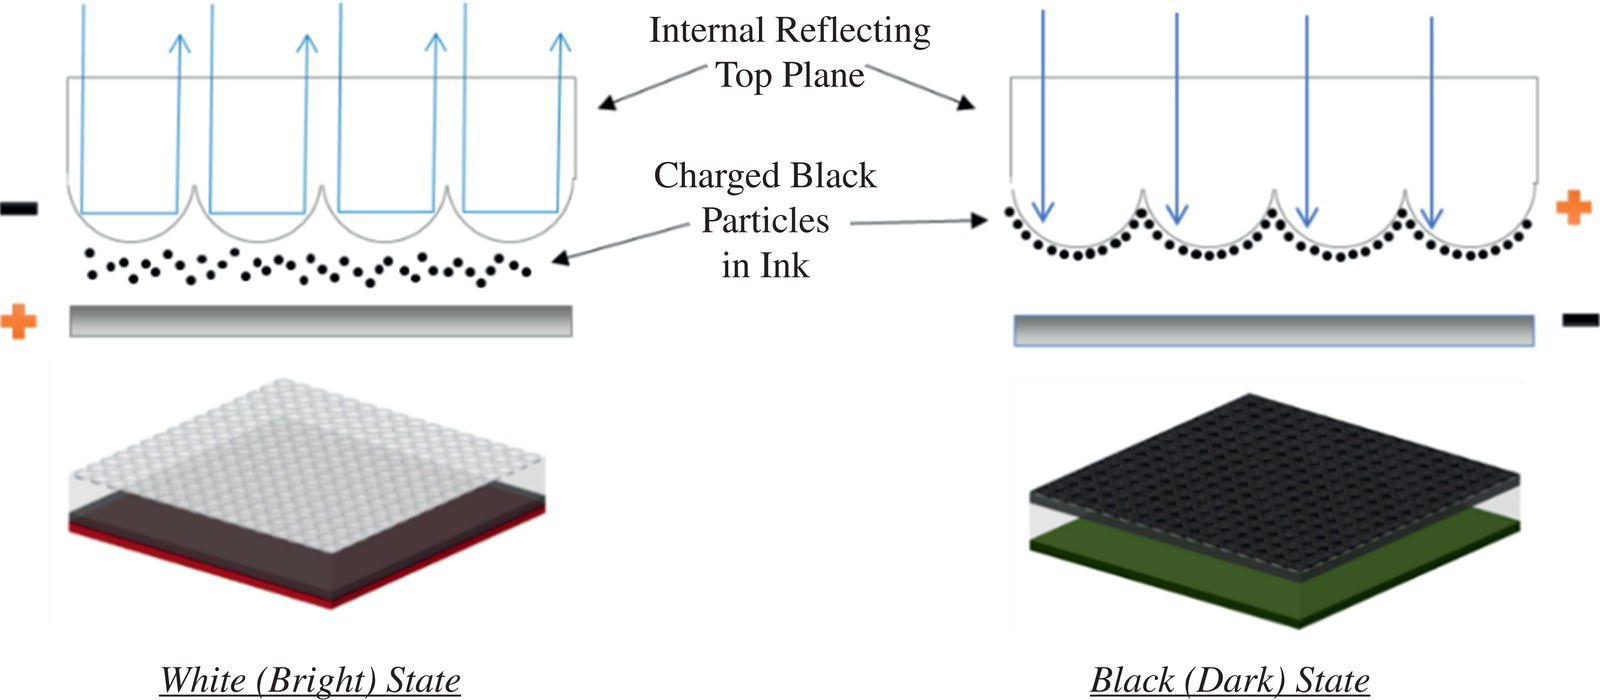
Figure 4.7 General description of semi‐retroreflective display using sub‐micron black particles to frustrate total internal reflection.
The first reported display brightness by CLEARink, using a hemisphere microstructured array with a refractive index of approximately 1.6 and a non‐aqueous colloidal dispersion ink system, gave a reflected brightness of 63% relative to a Lambertian white standard [8, 18]. The hemisphere microstructure is the CLEARink Gen 1 lens design. Monte Carlo ray‐trace simulations, found that the resulting optical gain could be modified by changing the shape of the lens (Figure 4.7).
The shape of the lens modifies the light path through the lens, the number of bounces inside the lens before the light is returned, and the overall angular distribution of light returned. Lenses could be designed to return a very narrow angular distribution of light but with higher brightness or broader angular distributions with reflected brightness approaching that of a Lambertian reflector. CLEARink began experimenting with different lens designs, first in ray‐trace simulations, then in real fabricated microstructured lens array prototypes. CLEARink is currently on its third‐generation microlens array design. The first‐generation design lens was a 20 um diameter hemisphere. The second‐generation design was a 20 um diameter round, non‐hemispherical design exhibited at the 2017 Society for Information Displays annual DisplayWeek trade show and won CLEARink the Best in Show Award. The third‐generation lens design is significantly smaller than the Gen 2 lens and is non‐hemispherical. The Gen 3 design was debuted in the 2019 Society for Information Displays annual DisplayWeek trade show and won CLEARink the “People's Choice Award..” In the following sections on optical performance, the different lens designs will be referred to as Gen 1, Gen 2, and Gen 3.
There are nearly an infinite number of lenses that could be designed and built. The difficult problem was efficiently narrowing down the infinite possibilities to potential lens designs that would give the overall best user experience in a functioning display. To meet this objective, CLEARink first developed a simple ring light test for measuring reflected brightness. This test was an attempt to mimic the user experience [8]. Then CLEARink conducted laser light and collimated white light goniometer measurements to map the reflected light [8, 19] finally designs were validated with real‐life user conditions [].
To optimize the best lens design, CLEARink needed to develop a brightness measurement test that best represented the use case of the intended consumer. If we assume the display is a portable device being held or sitting on a table, the viewer would be looking approximately normal to the surface of the display. Then we assume the ambient light is semi‐diffuse/semi‐directional, shining down from behind the viewer's head. As a result, the viewer's head would be blocking approximately ±5° of the light impinging the surface of the display. The results of these assumptions became the foundation of the test, which CLEARink refers to as the “5° to 30° Ring Light Test” [8]. The resulting measured reflected brightness became referenced as the “5–30 brightness..” Figure 4.8 below shows the test setup. The sample is placed at a controlled distance from an annular Lambertian light source with a viewing port through its center. The sample is illuminated with rays at angles ranging from 5° to 30° to the sample's normal. The reflection from the sample is measured through the central hole with a calibrated Topcon BM9 luminance meter equipped with a 2° acceptance angle optic. Specular reflection is masked by the ±5° angular selective tube. Light intensity is normalized to a 98% reflective Lambertian white standard from Labsphere: SRS‐99‐020. If the sample is more reflective than the standard in the direction of the detector (due to optical gain), then the relative reflectivity may exceed 100%.
Figure 4.8 Description of the 5–30 reflected brightness test method.
Table 4.1 White and dark state reflectance measured using the 5° to 30° Ring Light Test referenced in Figure 4.8.
| Sample | Reflectance white state | Reflectance black state | Contrast |
|---|---|---|---|
| First generation CLEARink Monochrome | 60% | 4% | 1 : 15 |
| Second generation CLEARink Monochrome | 83% | 4.2% | 1 : 20 |
| Epaper 1.0 | 48% | 4% | 1 : 12 |
White state reflectance values are referenced to a 98% Lambertian white standard and dark state values are referenced to a 2% black standard. Contrast is calculated by dividing White/Black reflectance.
Using this 5–30 brightness test, we could compare first‐generation lens designs to second‐generation lens designs, and compare to a Lambertian type reflective display [8], The results are shown in Table 4.1. The Gen 2 lens design s significantly improves measured reflective brightness without sacrificing dark state, thereby improving both brightness and contrast ratio. This is a very significant result because it indicates frustration of TIR is not significantly impacted by the shape of the lens. The brightness improvement with the Gen 2 lens design was significant enough that a color reflective display using a printed color filter array (CFA) became possible [7, 8]. A detailed discussion on color will follow. These results were encouraging but lacked details on the complete viewing angle performance picture.

Figure 4.9 Conference room, office, or classroom use case study. Overhead semi‐diffuse, low glare office lighting measuring 580 lux.
The team also validated the 5–30 test by measuring the luminance of printer paper, the CLEARink Gen 2 type display, and an E Ink type display. They approximated a “standard office” type lighting condition and viewing condition to mimic a tablet or eReader type display. The test conditions are shown in Figure 4.9 below, and the results are in Table 4.2. Please note the dark state in the CLEARink display is very poor because, at this time, a diffuser not optimized for the CLEARink technology was used (resulting in high surface scatter comprising the dark state).
Table 4.2 Measured white state luminance and dark state luminance from standard printer paper, a CLEARink Gen 2 type display with an unoptimized diffuser and an E Ink type eReader.
| Test Conditions: Open Office, low glare, 580 lux | Display Brightness (nits), ±15 deg optimal viewing | ||
|---|---|---|---|
| Display | White state | Dark state | CR |
| White printer paper/Black print | 145 | 9.98 | 14.5 |
| CLEARink Monochrome w/Diffuser | 170 | 16 | 10.6 |
| eReader | 94 | 9 | 10.4 |
The luminance measurement at the location of the “viewer” as shown in Figure 4.9.
The results in Table 4.2 generally correlate with the results from the 5° to 30° Ring Light Test and further increased confidence in this test. The CLEARink Gen 2 brightness is almost 2× that of the Lambertian E Ink type display. The CLEARink display is also brighter than the standard printer paper, not a surprising result because printer paper does not reflect as much as the 98% white reflectance standard used as the reference in Table 4.1.
The 5° to 30° Ring Light Test is simple and reduces the brightness metric to a single value but clearly oversimplifies the total display performance. A goniometric test was devised to map the light returned across a wide range of discreet angles. A sample on a rotating stage was illuminated by a green laser that was fixed in place as shown in Figure 4.10a. The photodetector was fixed in the same plane as the sample but could be rotated independent of the rotation of the sample, also shown in Figure 4.10a. The angle of the sample to the laser is the incidence angle, 0° being where the sample is normal to the laser. The viewing angle is the angle of the detector to the sample, 0° being where the sample is normal to the detector (Figure 4.10b,c).
It can be observed from (Figure 4.10b) the optical gain at certain angles derived from TIR and semi‐retroreflection off the Gen 2 type microlens array. From 0° to 20° viewing and incidence angles, the reflection is almost a factor of 2 greater than the E Ink Lambertian reflection type display. The optical gain is still present up to 60° viewing and incidence angles when rotated together, maintaining the semi‐retroreflection viewing condition. When the incidence angle is opposite the viewing angle, the reflection drops off. Ergonomically, this may not be as bad as it appears because the viewing conditions where the reflection drops off the fastest is also the viewing condition near the glare peak. The glare peak is the reflection off the top surface of the display.
In addition to measuring bright state reflection of the displays, we also measured the dark state reflection. Using the same goniometric setup as described in Figure 4.10a, we measured the white state reflection and the dark state reflection and plotted the ratio of white state and dark state reflection versus incidence and viewing angle. A CLEARink Gen 2 lens type display was measured and compared to reflective LCD type Memory in Pixel (MIP) display (Figure 4.11). An E Ink type display was also measured but is not reported here. As observed from (Figure 4.10c), the performance was pretty uniform across a broad range of angles (except for the glare angle).
As would be expected from (Figure 4.10b), the CLEARink Display has very good contrast along the retroreflection direction to 80°. What is important to observe, and was not expected, is that the contrast ratio even well outside of the retroreflection conditions and does not fall to 1 as in the case of the reflective LCD. The black regions in Figure 4.11 are where the contrast ratio is less than two as measured using the green laser (but corresponds to where the displays lose contrast under direct white light viewing). This phenomenon was observed in live demos and images of viewing angle performance of the content on active matrix displays [7, 8] as shown in Figure 4.12 below. The results are shown in Figure 4.12b validate the superior optical performance of a semi‐retroreflective type display.
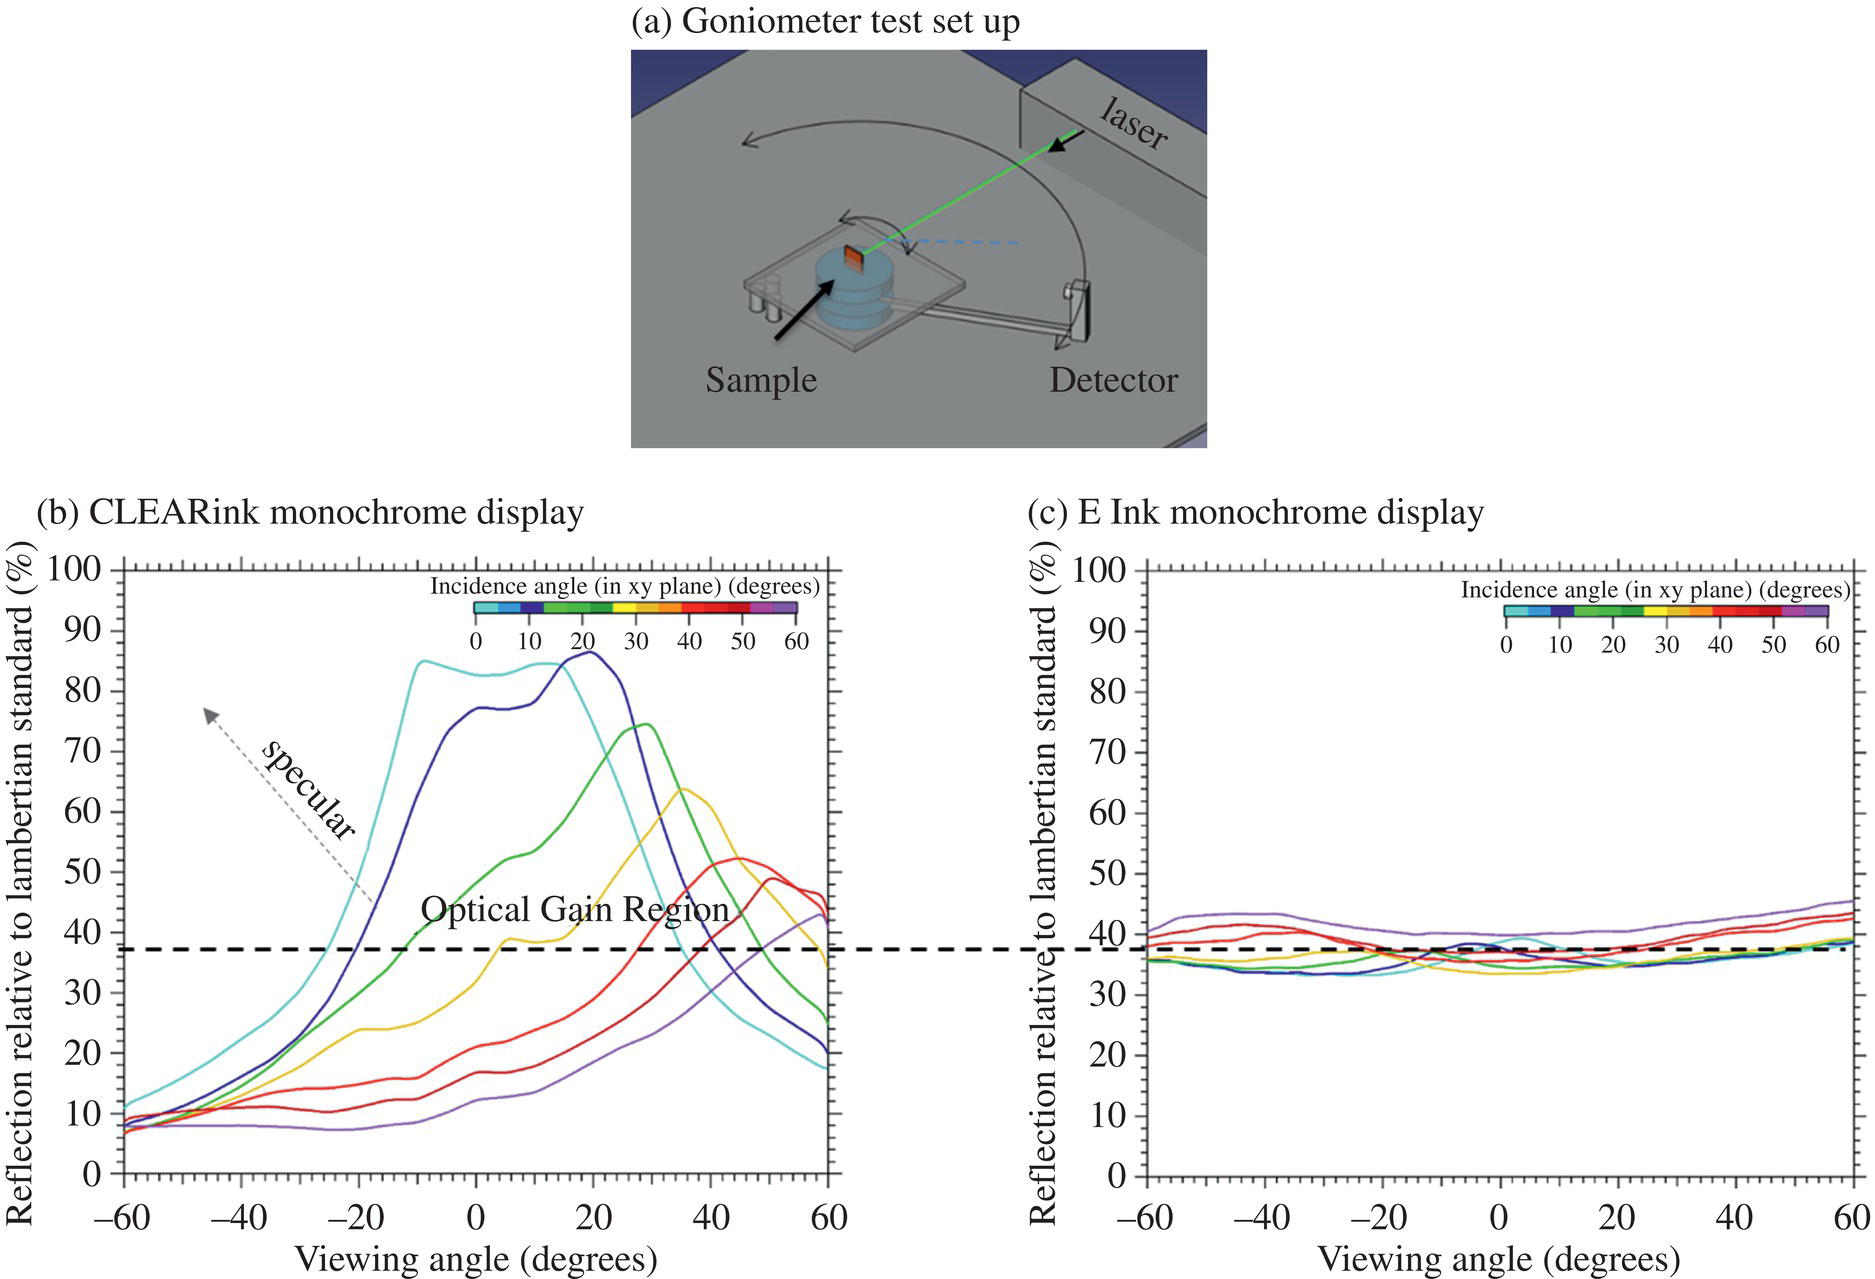
Figure 4.10 The goniometer measurement set up (a), the measured normalized reflection versus incidence angle and viewing angle of a Gen 2 type microlens array device (b). For reference an E Ink type Lambertian monochrome display (c).

Figure 4.11 Viewing and incidence angle performance study of a CLEARink Gen 2 lens type display as compared to a reflective LCD type display. The black regions in the charts are where the contrast ratio is less than two.

Figure 4.12 Display performance of a CLEARink semi‐retroreflective display versus a reflective LCD type display. Figure (a) shows the performance with an illumination angle of (0, 20) degrees and a viewing angle of (0, 0) degrees; (b) shows the performance with an illumination angle of (40, 20) degrees and a viewing angle of (−40, 0) degrees. Note in figure (b) the reflective LCD is on but looks off, CLEARink Displays.
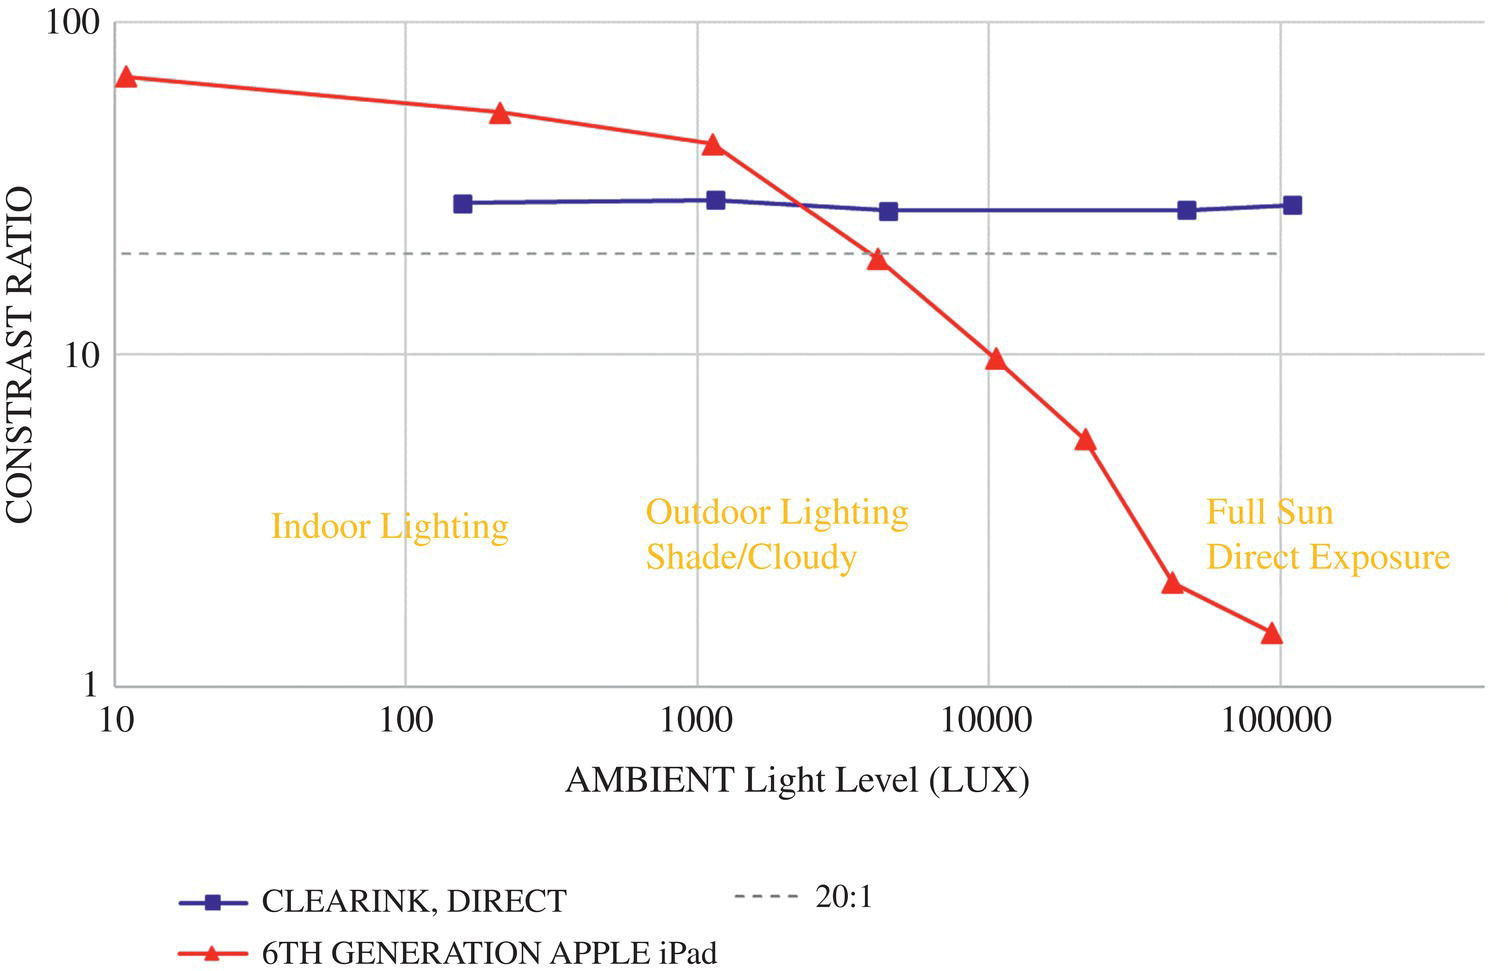
Figure 4.13 Measured contrast ratio of a CLEARink type display and an Apple iPad versus a broad range of ambient lighting conditions.
The ability to read and view content outdoors is one of the most compelling use cases for reflective displays. We conducted a study where we illuminated the surface of various displays with semi‐diffuse/semi‐collimated lighting and measured the white state and dark state display luminance under viewing conditions approximating the outdoor reading use case. The details of the test method and the effect on collimated versus diffuse light are reported elsewhere [8]. We tested a CLEARink Gen 3 type display and a 6th generation Apple iPad (FFS Technology “Retina” LCD) over a broad range of illuminance levels. We reported contrast ratio versus light level in Figure 4.13.
As would be expected—because we have all experienced this effect—the iPad has very good contrast in low ambient light levels, but under high ambient light, the contrast drops dramatically. This is typical for an emissive type display because the dark state is very low under low lighting conditions, so modest levels of the backlight are needed to produce extremely high contrast ratios. As the ambient light increases, the dark state brightness increases proportionally, so higher and higher backlight levels are required to maintain contrast. As the ambient light increases, the backlight must also increase, which translates to an increase in power consumption [7]. In contrast, the CLEARink display maintains the same contrast ratio overall measured lighting conditions. This is because the white state reflection increases with the increase in a dark state, maintaining contrast. Device designers need to take into consideration their use‐cases and the desired display performance in those uses cases as well as the resulting power demands [7].

Figure 4.14 The measured reflection normalized to a Lambertian white standard as described by the 5° to 30° Ring Light Test method plotted against the ratio of the refractive index of the lens (n1) to the electrophoretic fluid medium (n2) for three generations of CLEARink lens designs.
The CLEARink semi‐retroreflective display type that employs electrophoretic particles causing frustration of the TIR is a viable approach to a reflective display. CLEARink is on its third,‐generation lens design, but more optical gain is achievable. As discussed above, a higher optical gain can be achieved by modifying the shape of the lens. Still, the optical gain can also be increased by decreasing the critical angle of TIR resulting in a larger number of rays entering the microstructure that is reflected. As the refractive index of the lens (Figure 4.3, n1) increases and the refractive index of the electrophoretic particle medium decreases (Figure 4.3, n2), the reflection will increase (based on principles outlined in Figure 4.3). In Figure 4.14 below, we show what is possible in the future as the lens's refractive index increases and the fluid's refractive index decreases (expressed as the ratio n1/n2). The data in Figure 4.14 covers a range of lens refractive indices and electrophoretic medium. With proper lens design, material selection, and replication quality, displays with a reflection of greater than 100% are very achievable.
4.3 CLEARink Reflective Color Displays
The CLEARink Displays' approach to color is very simple in principle. The microstructured lens array is replicated directly onto a conventional CFA used in an emissive LC‐type display. To produce the desired color in an image, the particles are driven away from the lenses to allow TIR through the desired color sub‐pixel, for example, the green sub‐pixel in Figure 4.15. In the neighboring sub‐pixels, the particles are driven toward the lenses to frustrate TIR and not allow light to reflect through the other color sub‐pixels. When designing a CFA, the saturation of the colors is decreased in half to account for light traveling twice through the CFA layer, Figure 4.15. Conventional CFAs for emissive liquid crystal displays are typical of the RGB type, meaning all colors are derived from combinations of red, green, and blue subpixels. The color subpixels can take many shapes, sizes, and patterns; occasionally, a clear subpixel can be added to increase luminance. Adding a clear or “white” subpixel (not shown in Figure 4.15) can be beneficial to increase the luminance or “whiteness” of the display and give a more paper‐like viewing experience.
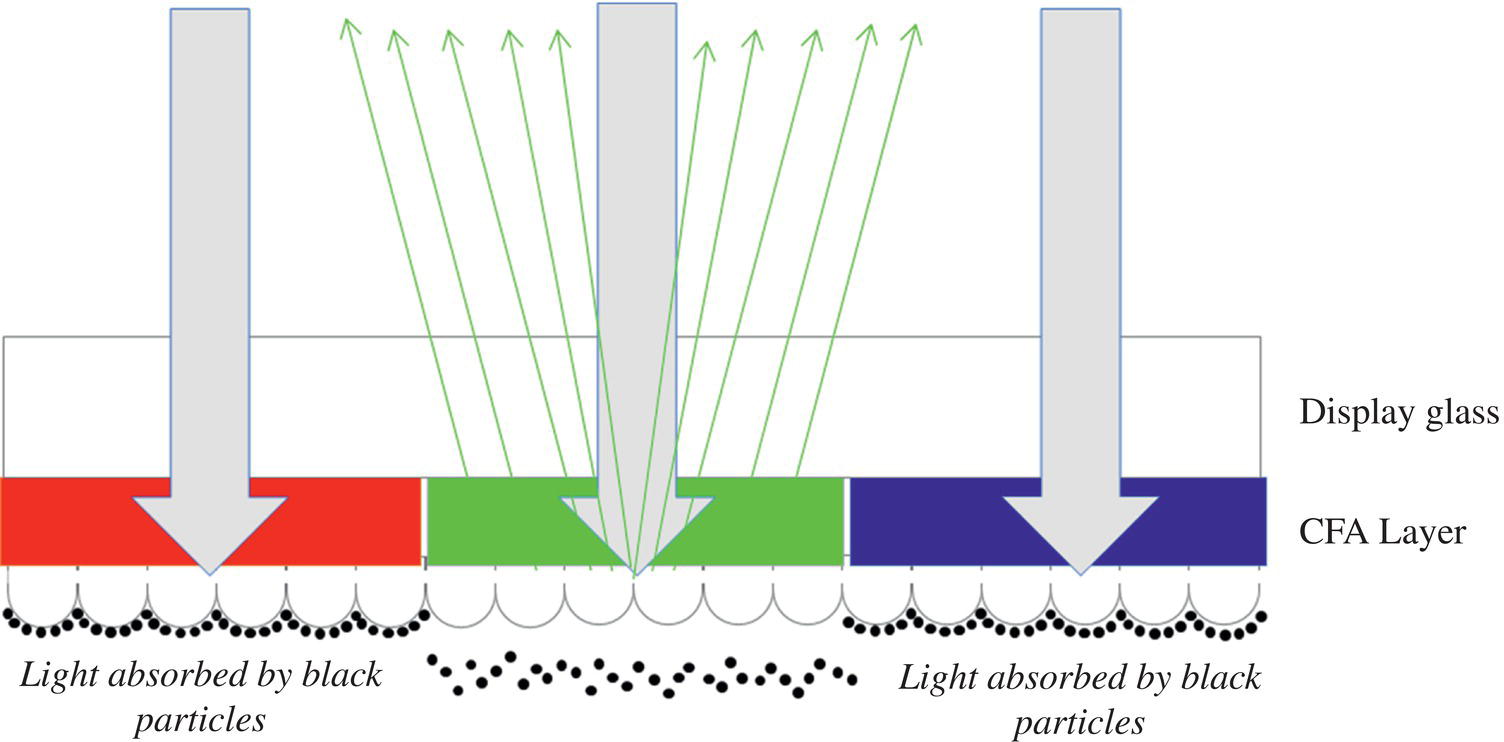
Figure 4.15 A general depiction of how color is generated using the CLEARink type display with a conventional RGB type color filter array.
The first CLEARink color demo was exhibited at SID Display Week in 2017 (Figure 4.16). This demo had a diagonal of 6 in., color resolution of 106 ppi, and a contrast ratio of about 8 : 1. This demo used Gen 2 type optical structures replicated directly onto an RGBW quad CFA design, as shown in Figure 4.17a,b. The quad layout was chosen because it matched the TFT available at the time. The decision was to use an RGBW design. After all, the goal was to achieve a paper‐like experience and high reflected brightness. The demo is shown in Figure 4.16 below and has a brightness of 40% as referenced to a Lambertian white standard (5° to 30° Ring Light Test described previously).

Figure 4.16 Picture of CLEARink demo shown at the Society for Information Displays Display Week in 2017.
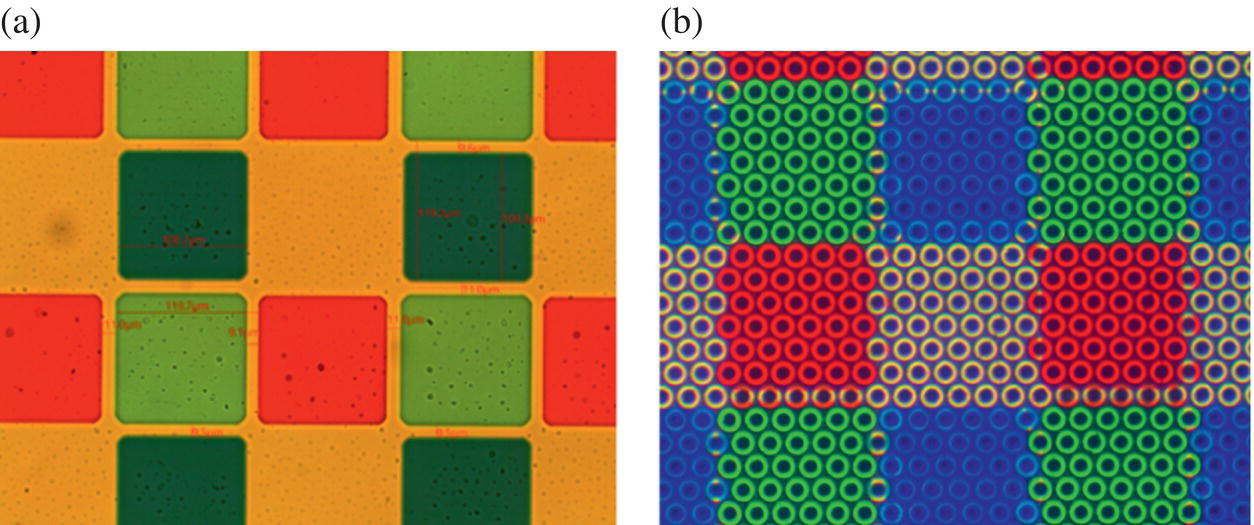
Figure 4.17 Optical micrographs of 2017 SID demo; (a) color filter array, and (b) Gen 2 type optical structures microreplicated onto the CFA.
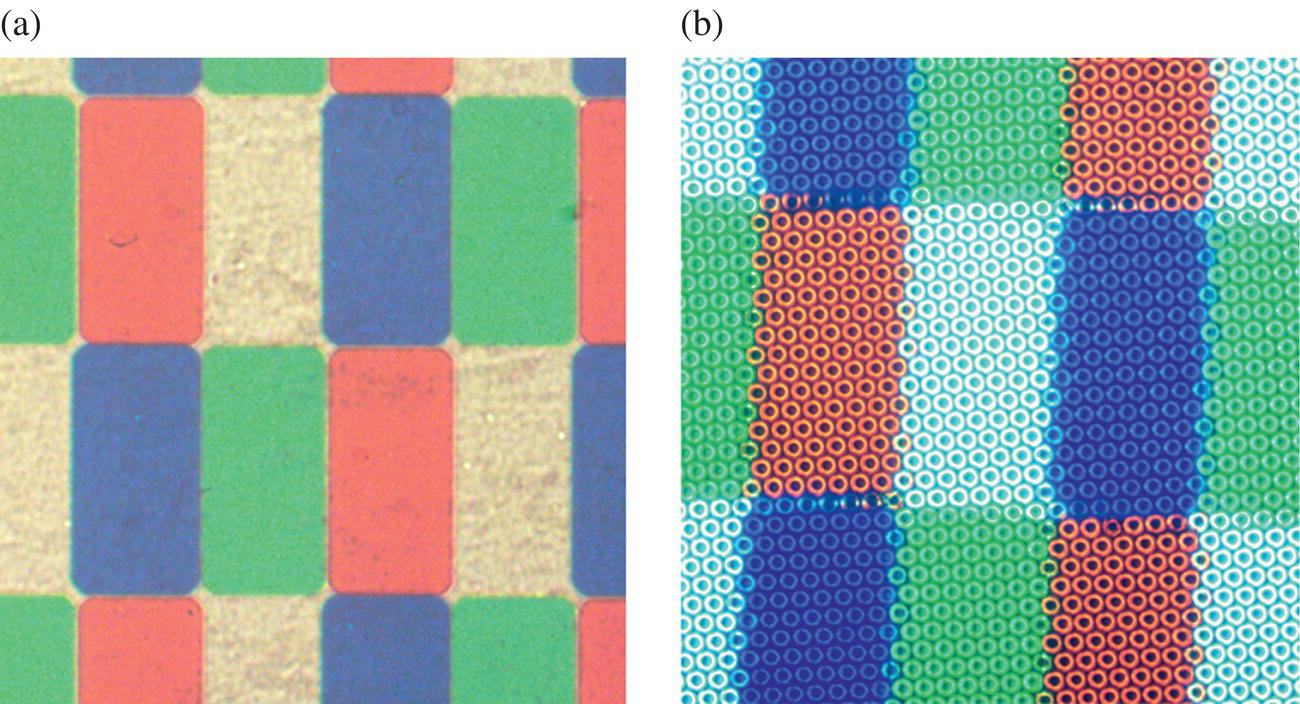
Figure 4.18 Optical micrographs of; (a) color filter array, and (b) Gen 3 type optical structures microreplicated onto the CFA.
The resolution in the 2017 demos was low, so the sub‐pixel size was relatively large compared to the diameter of the lenses, as can be observed in Figure 4.17b. Some color mixing from lenses bordering the sub‐pixels can be observed in Figure 4.17b, but a color gamut in the 10–15% range was achieved, as measured by %NTSC 1931 [8]. What is very important to note was that the reflected brightness was relatively high at around 40% (by the 5° to 30° Ring Light Test method), the combination of respectable color gamut, good white states, and high brightness resulted in a very nice paper‐like display with full color and video capability.
Commercial products likely require higher resolution than 106 ppi, and a higher color gamut would be preferred. Going to higher resolution shrinks the pixel size. Since each microlens in the CLEARink display acts as an individual light source, it is critical to maintain the highest fill factor possible. For this reason, the decision was made to go with a PenTile™ L6W design [7, 20], and smaller microlenses were developed. The PenTile design (Figure 4.18a) has two sub‐pixels per pixel and gives a 50% fill facto compared to a traditional RGB stripe with only 33%. This higher fill factor equates to higher brightness and larger sub‐pixels for the equivalent effective resolution. Perhaps even more important than the improved CFA design, the Gen 3 optical structures were developed, and reduced the lens diameter. CFA and lens design improvements greatly improved the sub‐pixel brightness and minimized optical cross‐talk while doubling the resolution from the 2017 RGBW quad design. However, some optical cross‐talk could still be observed, as shown in Figure 4.18b.
The PenTile CFA design and the Gen 3 optical structures were exhibited at the 2019 Society for Information Displays Display Week. Figure 4.19 show pictures of the demos exhibiting different content. The demos in Figure 4.19 had a 9.7″ diagonal and a resolution of 227 ppi. The color gamut was measured to be 19% NTSC xyY(1931), 17% sRGB u’v’ (CIE1976), and 35% reflection (5° to 30° Ring Light Test method).
The actual CFA used in the 2019 9.7″ demo had small spaces between the color subpixels. This resulted in a whiter, more paper‐like experience but compromised color gamut. The CFA shown in Figure 4.18a was built into a 1.3″ diagonal 202 ppi wearable demo and exhibited by CLEARink at SID Display Week 2018. The overall color gamut increased significantly; the color coordinates are shown in Figure 4.20. Red‐Green‐Blue color points were measured with an Ocean Optics Spectrophotometer, and the results are shown in sRGB and NTSC color spaces. In addition to changes in the CFA design, improvements were made in driving the subpixels, resulting in higher sub‐pixel contrast. These improvements lead to a 30.7% NTSC xyY(1931) 29.5% sRGB u’v’ (CIE1976) color gamut.
Improvements in color performance are certainly obtainable. Implementing higher brightness optical structures (Figure 4.14), improvements in CFA design, and improving the sub‐pixel contrast ratio will enhance the color gamut to 50% NTSC. The next step in CFA design is to include a black matrix between sub‐pixel colors. These improvements will minimize further color “cross‐talk” between sub‐pixels and help with the sub‐pixel contrast ratio but will reduce overall brightness depending on the resolution and width of the black matrix material. Further improvements in the sub‐pixel contrast ratio can be made by improving the drive waveforms. This will be discussed in detail in the next section on device architecture and driving.
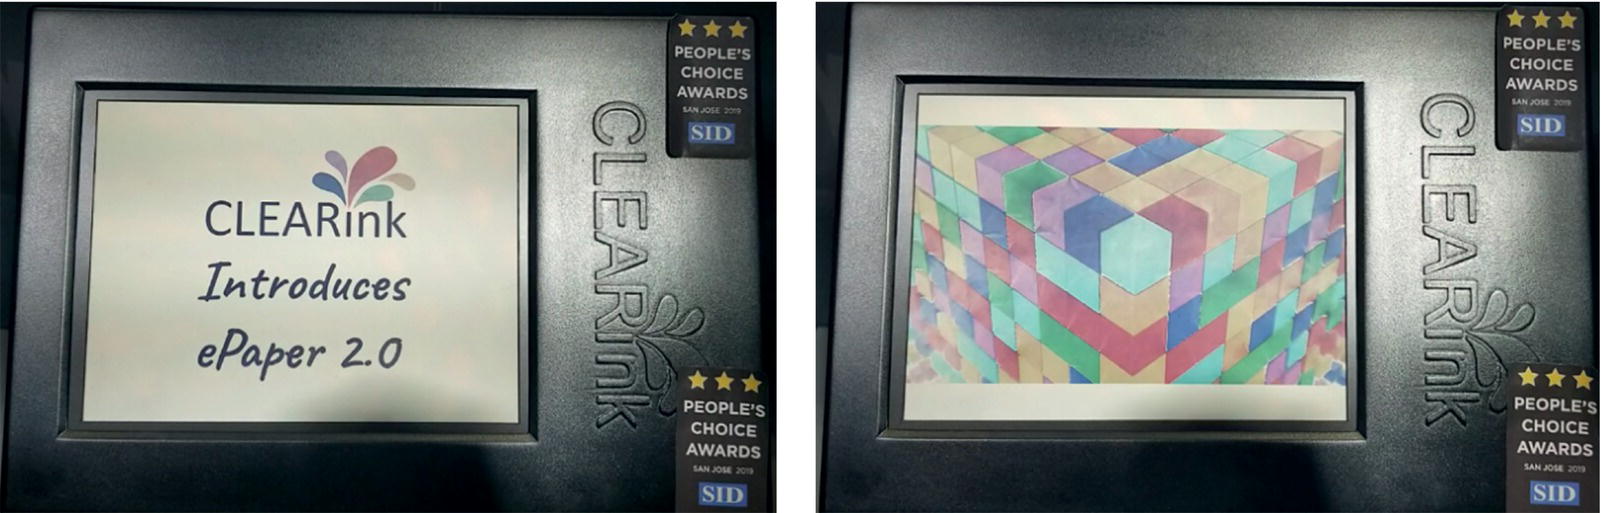
Figure 4.19 Pictures of CLEARink Display's demos exhibited at the 2019 Society for Information Displays Display Week Conference.

Figure 4.20 Red‐Green‐Blue color points measured with an Ocean Optics Spectrophotometer shown in sRGB u’v’ (CIE1976) and NTSC xyY(1931) color spaces.
4.4 Electrophoretic Displays with CLEARink Structure
Conventional electrophoretic displays as commercialized by E Ink employ positively charged black particles and negatively charged white particles in a clear fluid [1, 21, 22]. An electric field is applied across the particles using a transparent conductor on the front plane and a conductor on the backplane. Driving either the black or white particle to the front surface will depend on the direction of the applied electric field as shown in Figure 4.21 below. The white particles are on the size scale of a micron and have a high refractive index (typically TiO2); the small white particles being surrounded by a low refractive index fluid are highly light scattering in all directions, which gives a paper‐like white appearance. When driven to the front surface. The black particles are light adsorbing and provide a dark state. Combining white and dark particles in a low index fluid leads to good contrast and a paper‐like reading experience.
The concepts for an electrophoretic type display had been around for more than a decade [23] before EInk existed, but prototypes lacked stable driving and lifetimes. The key enabling advancements of the technology which allowed for commercialization were: (i) the ability to encapsulate the black and white particles, keeping them from migrating laterally; and (ii) the ability to charge the particles in such a way as to provide shelf‐life stability and stable driving over long periods [1]. Encapsulation techniques typically employed to contain the particles are microcapsules [1] or microcups® [24]. CLEARink uses standard photolithography processes to build “walls” around each sub‐pixel to confine the particles.
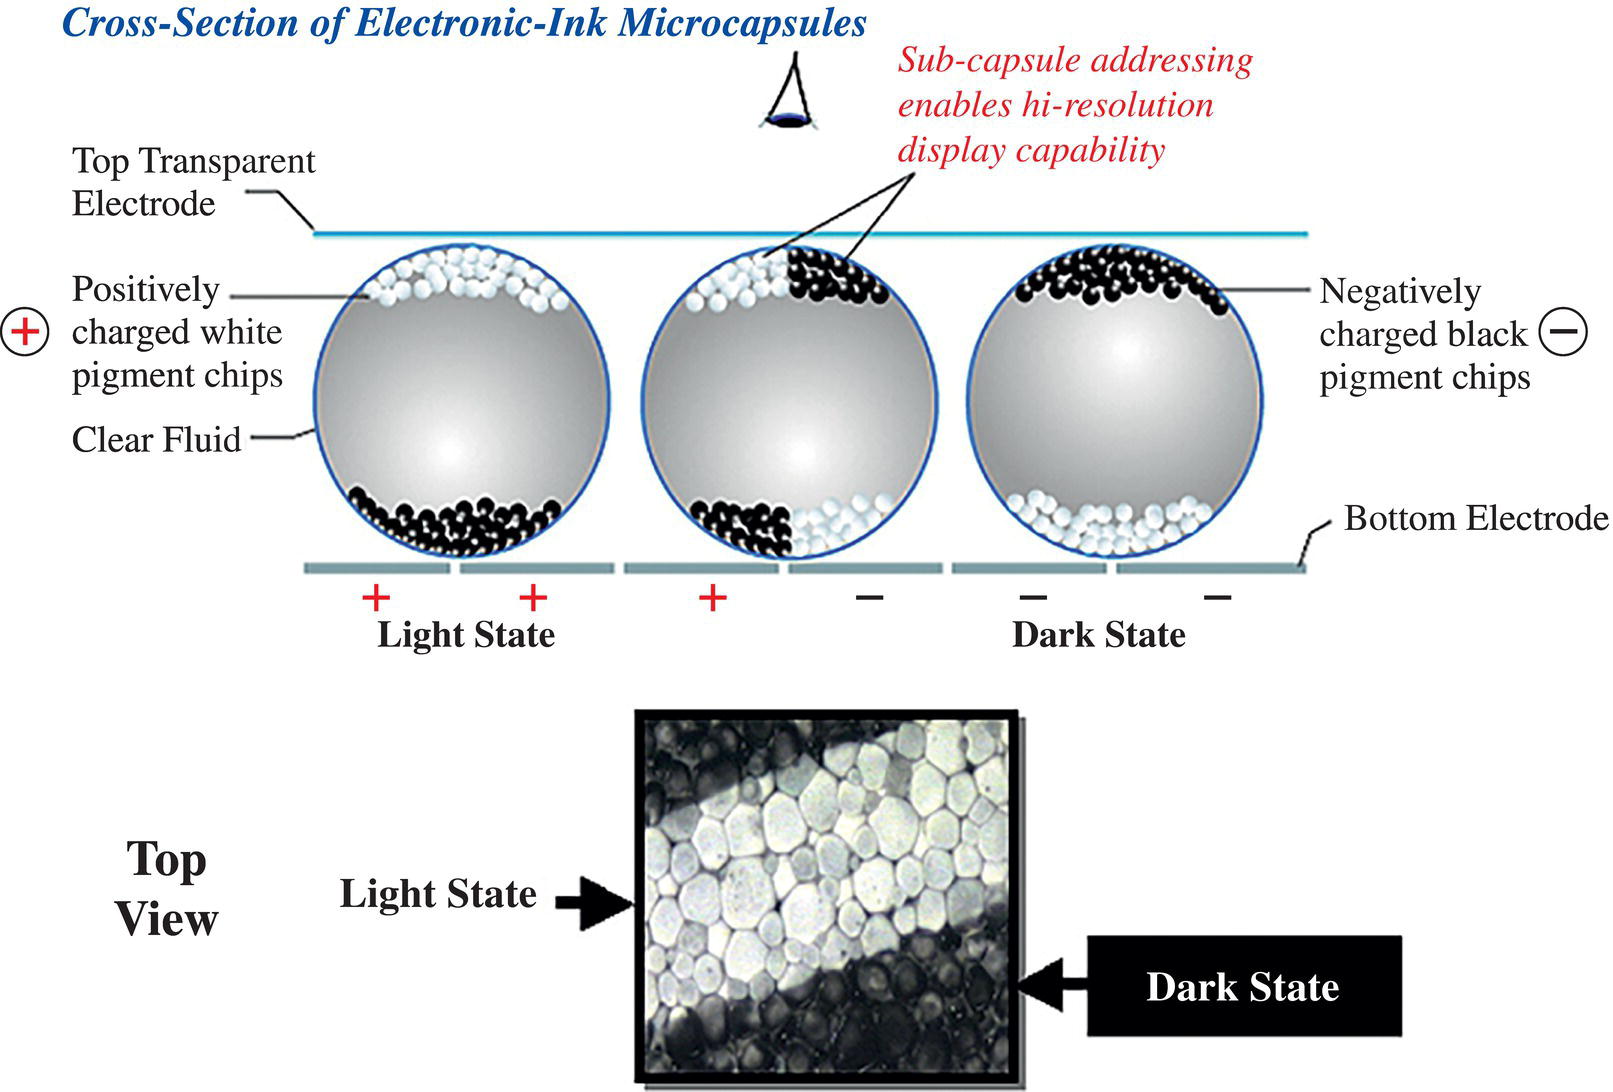
Figure 4.21 E Ink 2‐particle type display. The particles are encased in microcapsules and sandwiched between a transparent top conductor and a bottom electrode; an electric field is applied between the two conductors resulting in particle motion.
Early electrophoretic displays suffered poor grayscale control, ghosting, long reset flashes, and slow switching speeds. Drive waveform strategies and improvements have been published elsewhere [25–27] and will not be reviewed here. Over time steady improvements were made in all areas, but, as of this writing, no video‐capable electrophoretic display has been commercialized.
Conventional 2‐particle (black and white particles) electrophoretic displays are limited because of their slow switching speeds and high drive voltages required for switching. A charged particle's velocity or response time in a fluid is proportional to its electric charge and applied electric field. The response time is inversely proportional to the fluid viscosity and size of the particles (assuming constant particle charge) [28]. Typical EPDs are driven at ±15 V and take ~500 ms (gray to gray) to achieve the desired optical state (~250 ms black to white) [25]. Driving faster without compromising contrast would require significantly higher voltages resulting in high power consumption and more expensive hardware. The high drive voltages result from the relatively large electrode gap necessary for the encapsulation of the particles and the high viscosity sufficient fluid to impart bi‐stability.
The slow switching speeds are also because both the black particles and white particles have to travel 10's to a hundred microns in the distance to switch optical states to high contrast. For example, to achieve a dark state, a thick layer of black particles needs to be driven to the front surface. At the same time, the white particles need to be driven far enough away from the front surface not to influence the desired dark state. At a given velocity (or electric field), the particles' distance must travel is large, resulting in a longer optical response time. Grayscale is achieved by mixing black and white particles, and the proportion of each particle in the mix determines the gray level.
The CLEARink electrophoretic display technology operates with positively charged black particles in a low refractive index fluid [29, 30]. The white state is the natural resting state resulting from TIR when only the low refractive index fluid is in optical contact with the optical structures (Figure 4.22). The dark state is achieved by applying an electric field that moves the black particle to the surface of the optical structures, thereby frustrating TIR.
If you recall from the discussion above on TIR, surface waves propagate along the plane between the two media [14]. This surface wave is known as the evanescent wave. It decays rapidly in the direction of the low index medium, the rate of decay being determined by the wavelength of light, refractive indices of the two media, and the angle of incidence. The surface wave oscillates between the two media, and the electric field decreases by a factor of 1/e as it penetrates the low refractive index medium. The penetration depth for visible light can be calculated for our system to be on the order of 90–150 nm, depending on exact refractive indices and angles [9]. This method for using TIR and single‐particle type to achieve white and dark states is important to distinguish between conventional multi‐particle type electrophoretic displays. Using the CLEARink approach, the distance the particles need to travel to attain complete optical switching is in the range of 200–500 nm; approximately two orders of magnitude less than standard 2‐particle systems. This leads to a faster optical response for switching. Very low drive voltages can also be achieved because the black particles are contained in a low viscosity fluid. The distance the particles need to travel is very short, and the cell gaps can be minimal (~5 μm). Since optical states are constantly changing when showing video content, low drive voltages are critical to managing power consumption.
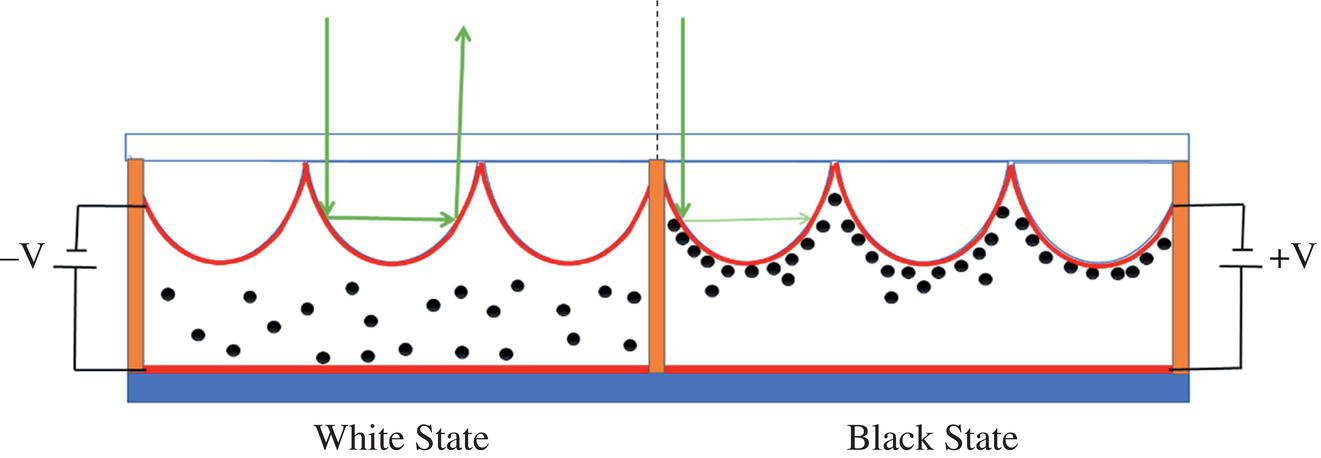
Figure 4.22 CLEARink type display device. A positive voltage is applied to the optical structures to drive the black particles to the surface of the lenses to frustrate TIR and achieve a dark state.
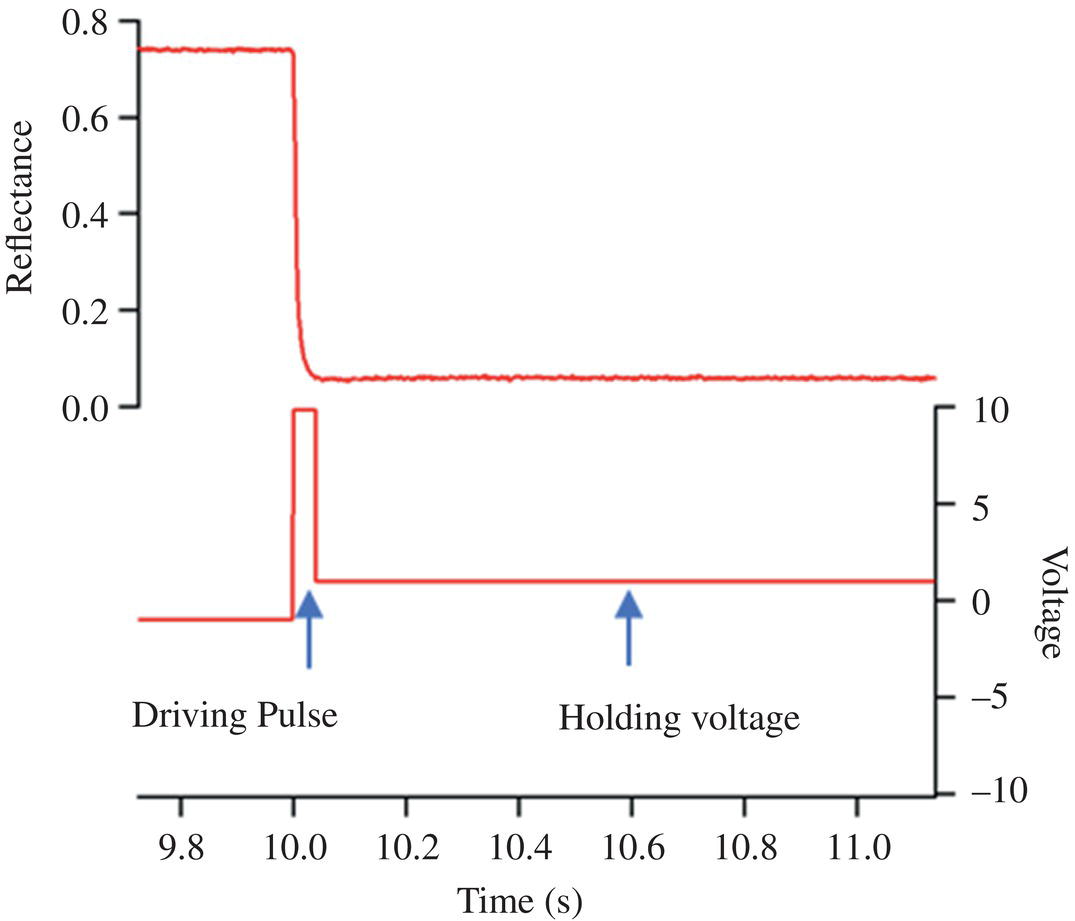
Figure 4.23 Example of a CLEARink waveform and resulting optical state.
The fTIR type display uses different voltage waveforms to drive the electrophoretic particles to the desired optical state than a standard multi‐particle type electrophoretic display. The standard 2‐particle type display uses only three voltages, + full voltage, − full voltage, and 0 V. A voltage waveform consisting of three stages controlling the three voltages and time, (i) erase the original image, (ii) activate the particles, and (iii) display a new image [25, 26]. The continuous variable to achieve targeted values for each stage is time (pulse width modulation),. All three stages can take hundreds of milliseconds: gray to gray level transitions take the longest [25]. Controlling voltages less than the full voltage is not useful because lower voltages would result in even slower switching speeds. The CLEARink, fTIR type display, employs waveforms that control both voltage and time. In simplest terms, to achieve the desired optical state, the basic waveform has two parts; the drive pulse and the hold pulse, as shown in Figure 4.23 below. The drive pulse is typically at full rated voltage for the physical stack and lasts for 20–50 milliseconds; the purpose of this section of the waveform is to accelerate the particles toward the desired optical state. The hold pulse is 50–90% lower in voltage than the drive pulse and lasts for milliseconds to 10 seconds, depending on how long the desired image is to be held. A reset pulse is required at the end of the hold pulse, which consists of a single “max voltage” pulse held for milliseconds to seconds depending on the previous optical state (the shorter the previous state the shorter the reset, thus allowing video rates). This approach to driving optical states provides for both high switching speeds and low power consumption. Figure 4.23 shows a drive pulse at 10 V, but more recent device stacks allow for high‐speed video content using less than 5 V [7]. The CLEARink system is not genuinely bi‐stable, meaning the image will not retain indefinitely without power. The only way to achieve bi‐stability in an electrophoretic display is to have the charged particles in a high viscosity fluid. To achieve fast switching speeds and low drive voltages, CLEARink chose to employ a low viscosity fluid. However, when showing static images, the refresh rates can be slowed to 30 Hz, and with the low hold voltages, the power consumption will still be low. CLEARinks device architecture includes two modes of operation, a low‐power ePaper mode where content and waveforms operate at lower voltages and slower speeds, and a video mode where the device runs at full voltages and speeds.
The CLEARink technology uses voltage control to achieve desired gray levels. The drive voltage and hold voltage can be tuned independently to achieve the desired gray level. Figure 4.24 below demonstrates 28 gray levels. With further waveform optimization, much higher gray levels can be achieved.
One of the major challenges in electrophoretic display‐type systems is controlling charges over time. The optical states are achieved by applying DC voltages over some length of time, but when the amount of white state images and dark state images over time do not add up to 0, accumulation of charges can occur. This is referred to as the “DC balancing” problem. Liquid crystalline displays solved this issue by inverting the field at a certain frequency. This works because the same gray level can be achieved with a +V or a −V. This is not the case for electrophoretic systems. If the system does not stay balanced, then charges accumulate, leading to visual artifacts such as “optical drift” or “ghosting..” These visual artifacts can often be controlled by applying reset pulses to balance out the accumulation of charges. Figure 4.25 below shows a CLEARink type display with four rows of gray levels (the top row is white, so the squares are not visible) being held for 10 seconds before being switched to 7 columns of gray levels (columns 1 and 5 being white). A residual ghost image can be seen in the full black to full white switch (bottom row of columns 1 and 5), demonstrating ghosting. This can be improved with resets and optimized hold voltages.
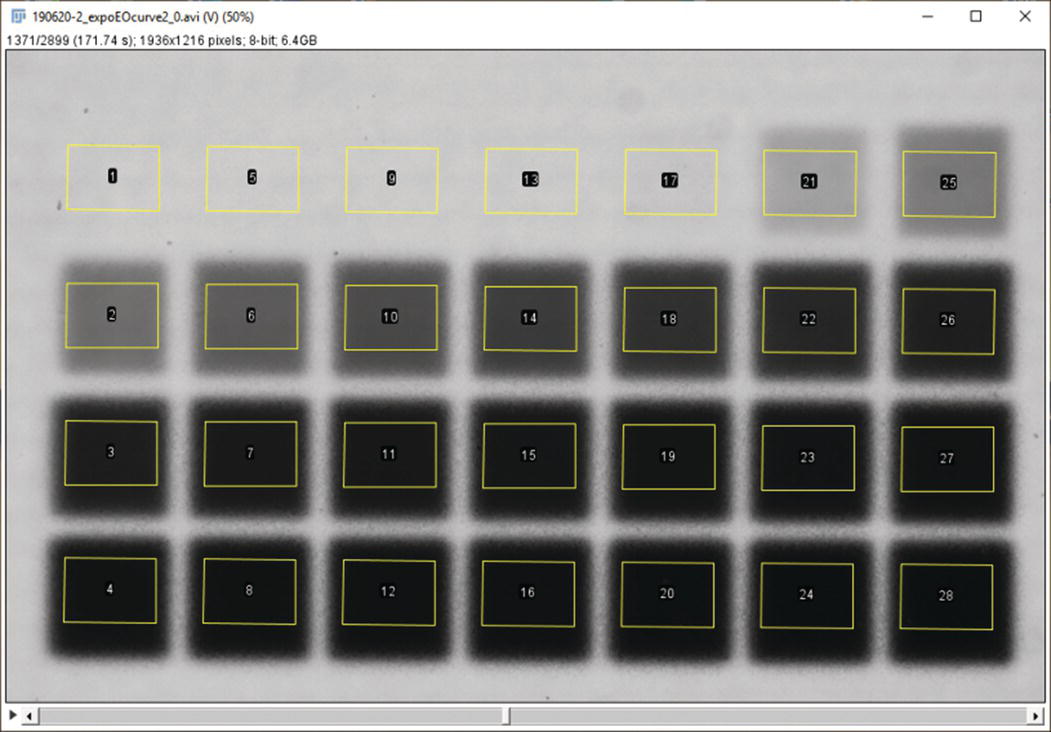
Figure 4.24 1 mm × 1 mm squares demonstrating 28 gray levels on a single active matrix device. The yellow boxes are the selected regions used for measuring reflected brightness.
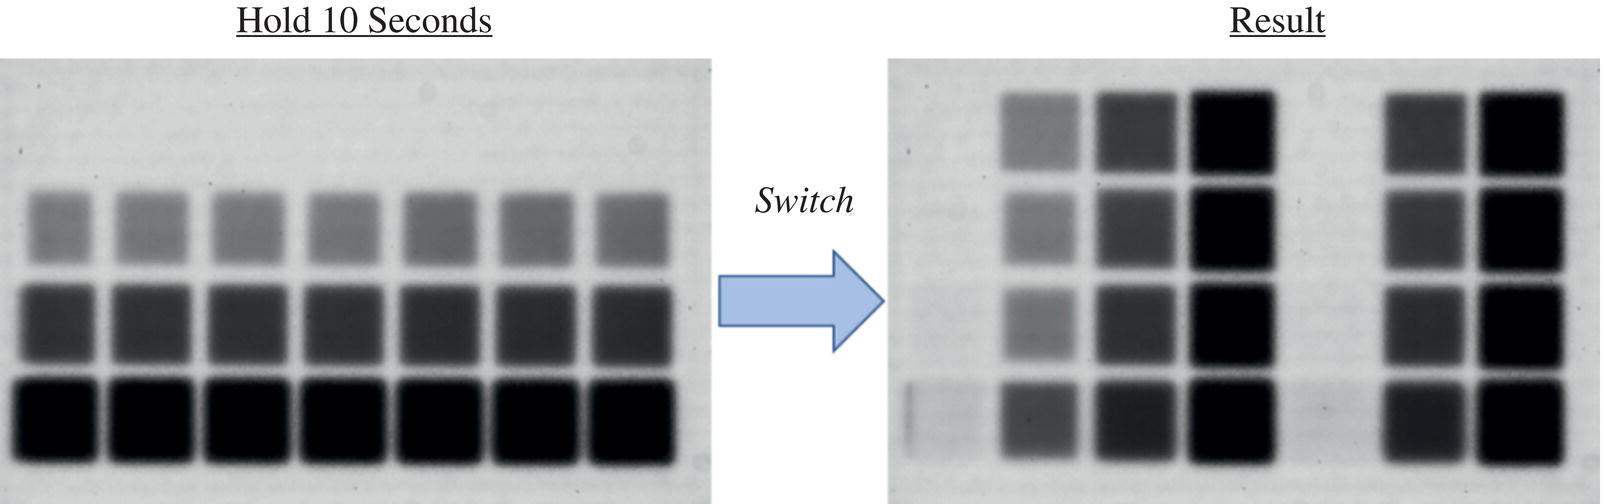
Figure 4.25 Left images shows four rows, each with a distinct gray level being held for 10 seconds. Right image shows 1 second after each row was switched to four different gray levels (three gray levels repeated).
Grayscale control is important at the millimeter scale, as shown above for monochrome displays., A color display must control the amount of light through each color sub‐pixel and achieve excellent grayscale control at the sub‐pixel level. CLEARink uses photolithography‐defined walls around each sub‐pixel (refer to Figure 4.22) to contain the particles inside said sub‐pixel with minimal electrical and optical coupling. Figure 4.26 below demonstrates individual sub‐pixels being driven to different gray levels. The surrounding sub‐pixels are held at a constant intermediate gray level. It is essential to note the good sub‐pixel fidelity, i.e., the lack of optical and electrical coupling to neighboring sub‐pixels.

Figure 4.26 An optical micrograph showing sub‐pixels driven to four different gray levels, the array is divided into quadrants by the dashed lines, each quadrant is a different gray level (G1–G4).
Driving full color is much more challenging than driving monochrome displays. High contrast has to be achieved at the sub‐pixel level. This means that when the desired color sub‐pixel is driven to full white, the neighboring sub‐pixels must be driven to a full dark without optical or electrical coupling. Figure 4.27 shows sub‐pixel level color switching. The color filter used in the device shown in Figure 4.27 does not have a black matrix between sub‐pixels. Also, there is a slight misalignment between the CFA sub‐pixels and the TFT sub‐pixels, resulting in slight light leakage, a common problem with hand‐built prototypes.
4.5 CLEARink Device Architecture
The control scheme for the CLEARink active matrix display is outlined in Figure 4.28 below. The input file from an SD card or HDMI is in sRGB and must be converted to RGBW format and sub‐pixel rendering. The Loo‐Up Tables (LUTs) give the voltage‐time sequence for the desired optical states. All of these operations are performed in an FPGA along with timing control. The output signal goes to source and gate drivers that scan the rows and columns of the thin film transistor backplane,, which supplies the target voltages across the electrophoretic ink.
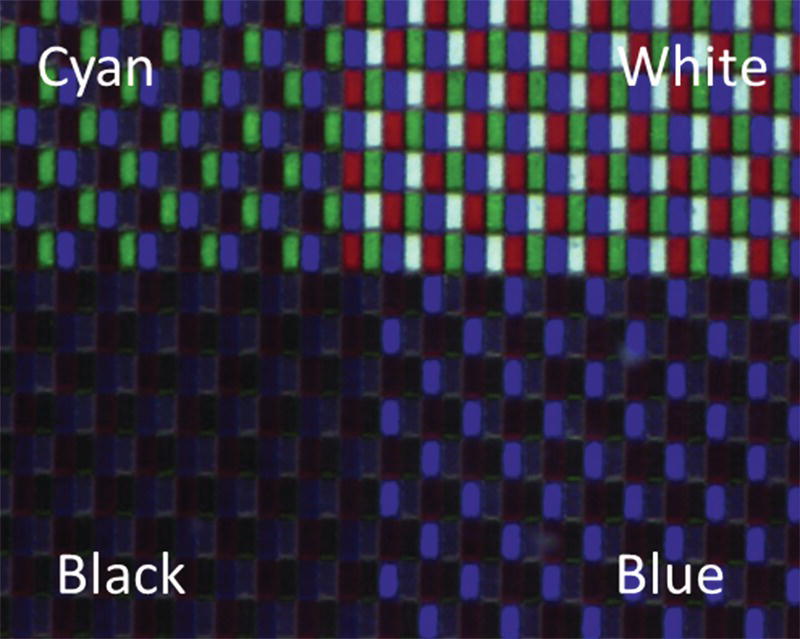
Figure 4.27 Optical micrographs of a full color device at the sub‐pixel level. The upper right quadrant denotes all pixels are in the white state, in the lower left all pixels are driven dark. The upper left the green and blue subpixels are beings driven white which would give a visual cyan color. In the lower right quadrant, the blue pixel is driven white, the surrounding sub‐pixels are driven dark.
The target waveforms are shown in Figure 4.23. The rendering algorithms were developed and optimized in computation and simulation software platforms and then programmed directly into FPGA hardware for the 9.7″ tablet demonstrator.
Estimating the power consumption of a CLEARink type display is more complex than a conventional monochrome E Ink eReader display for a number of reasons. A conventional eReader is image bistable, meaning it holds an image without added power, is monochrome, and does not show video content. A CLEARink display can offer video content, color, and stable images, but occasional refresh pulses are required. For these reasons, CLEARink developed two modes of operation “video mode” and “ePaper mode. EPaper mode operates at 30 Hz and slightly lower voltage, reducing power consumption. Video mode operates at 60 Hz and higher voltages to achieve an approximately 30 fps frame rate.
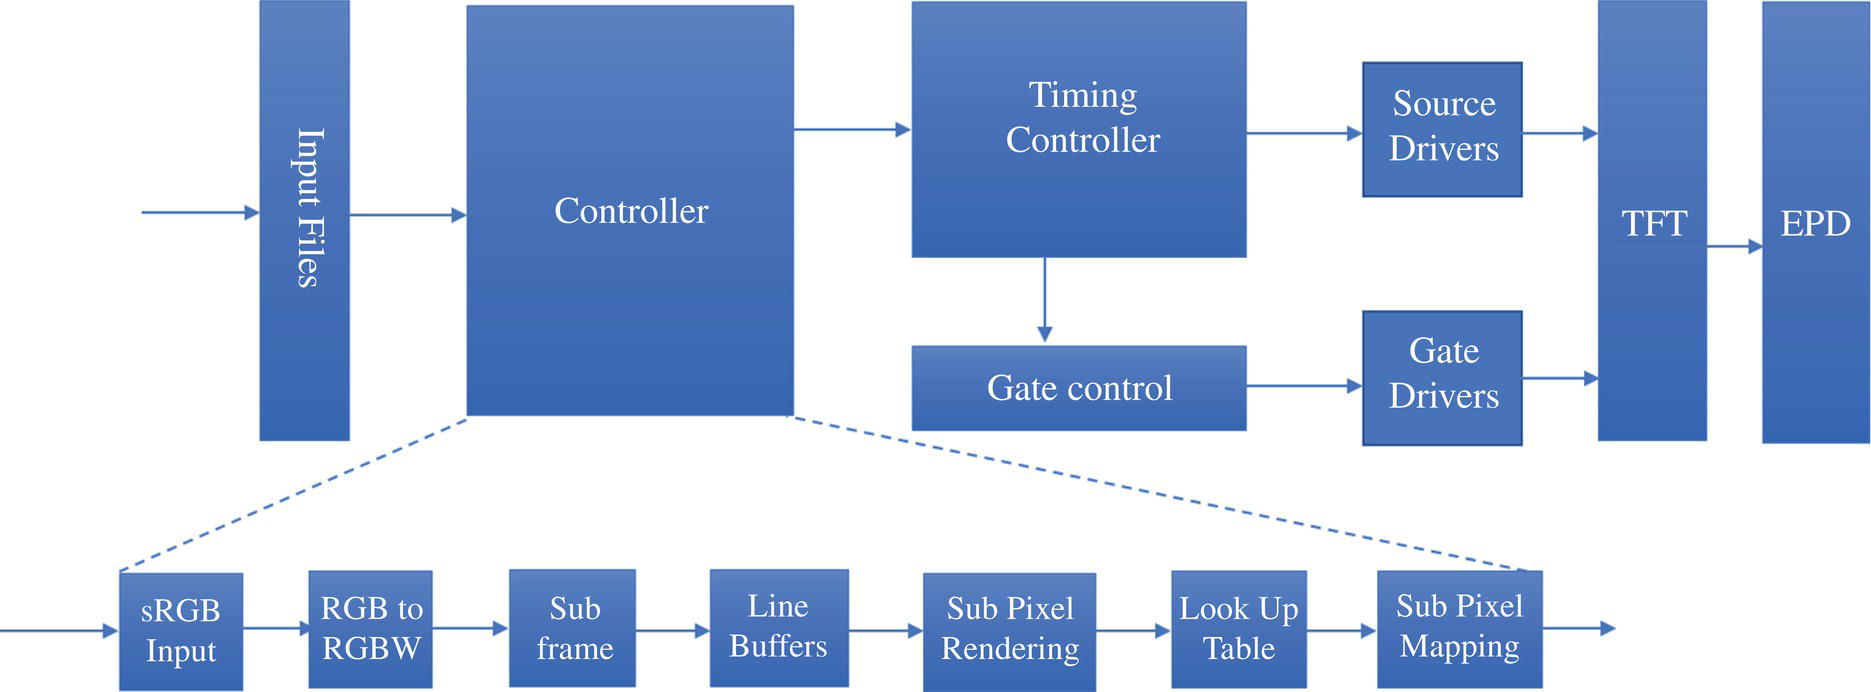
Figure 4.28 Controls scheme for CLEARink active matrix display.
The power consumption of an fTIR display, Ptotal, is estimated by
where Pdriver, PTFT, and Pink are the power consumption values associated with the display driver ICs, TFT backplane, and ink, respectively. Typical power consumption ranges are summarized in Table 4.3. In our model, we estimate the static driver IC power consumption to be in the range of 70–80 mW. The power consumption is dominated by the TFT panel's dynamic switching power, which can consume between 20 and 140 mW depending on the image update rates (0–100% switching). At 100% active switching fTIR displays draw less than 1/10th the power of traditional electrophoretic displays, which typically operate at 15 V. The ink power consumption is almost negligible at less than 2 mW. This results in a total panel power consumption ranging from 91–222 mW. ‐For example, for a 4400 mA‐hr Lithium ion battery and 80% power conversion efficiency, a battery life (display only) of 59–143 hours can be realized, enabling ePaper tablets that operate for weeks assuming a typical use case of 2 hours per day.
Display architectures are commonly optimized to their use cases. MIP reflective LCD is an example of optimizing an LCD architecture for low‐power applications such as wearables. The CLEARink architecture was designed to offer two modes of driving, ePaper mode and video mode, so that customers could prioritize the modes depending on application and use‐case. In ePaper mode, the CLEARink display runs lightly lower voltages at lower frame rates; in Video mode, the frame rates and voltages are higher. Table 4.4 below shows the different modes and resulting estimates on battery life. The assumed use case is two hours daily operation, no front light, and a 4400 mA‐hr battery.
Table 4.3 Power consumption estimates for a 9.7ʺ active matrix display.
| Parameter | Power [mW] |
|---|---|
| Pdriver | 70–80 |
| PTFT | 20–140 |
| Pink | 1–2 |
| Ptotal | 91–222 |
Table 4.4 Estimated battery life of an eReader using a CLEARink type display in ePaper mode and video mode.
| ePaper mode | Video mode | |
|---|---|---|
| % Active switching | 25 | 75 |
| Frame rate [Hz] | 30 | 60 |
| Voltage [V] | 1–3 | 2–4 |
| Power consumption [mW] | 101.9 | 231.7 |
| Battery life (display‐only) [days] | 63.9 | 28.1 |
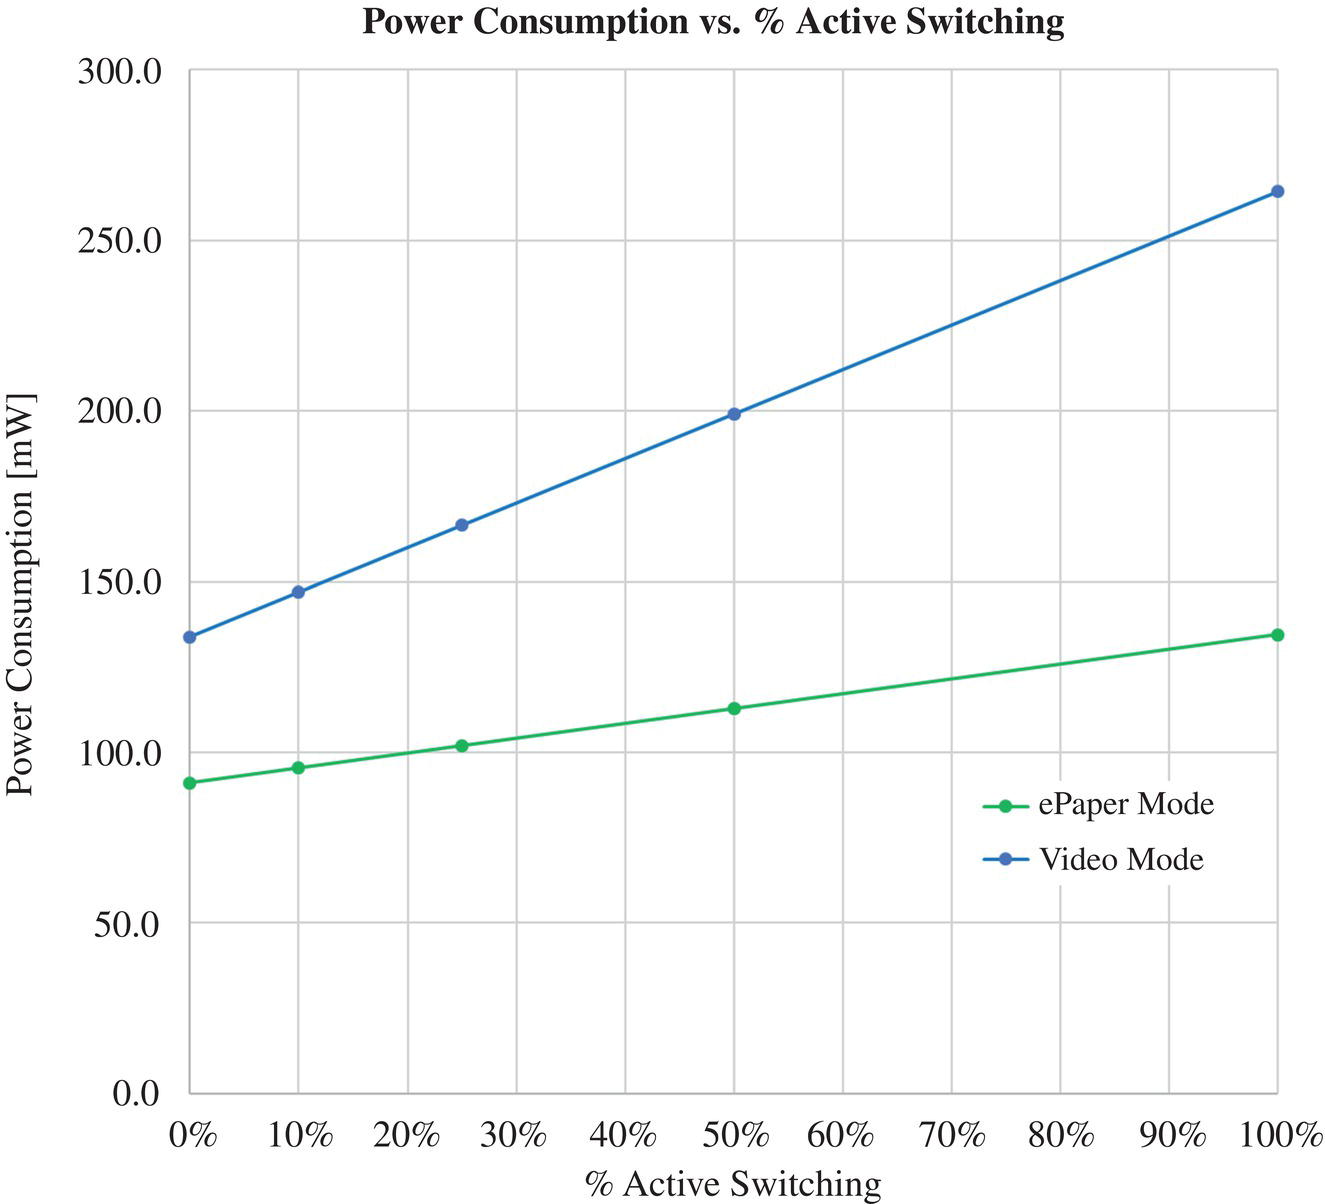
Figure 4.29 Power consumption on % active switching for video mode and for ePaper mode for a 9.7″ active matrix display.
Another important variable in overall power consumption is the total number of actively switching pixels. Given the goal of achieving a paper‐like display experience, it is preferred to have a white paper‐like background as a resting state, and content is actively switched from this state. In ePaper mode, to display the text, the actual percentage of the display actively switching would be quite low. In video mode, the % active switching would be high. Figure 4.29 shows the impact of power consumption on % active switching for Video mode and ePaper mode.
A front light is recommended if a brighter viewing experience is desired for indoor, low ambient light conditions. We estimate the power consumption contribution for a 9.7″ diagonal front light to range 83–109 mW for light conditions ranging 7–70 lux using typically preferred brightness levels determined by Rempel et al. [31]. CLEARink worked with a front light partner to develop a highly efficient directional frontlight leveraging the semi‐retroreflective optical structures. The basic principle is shown in Figure 4.30. Figure 4.31 shows the front light in operation on a CLEARink display.

Figure 4.30 Front light guide showing light being directed out of the light guide into the CLEARink optical structures.
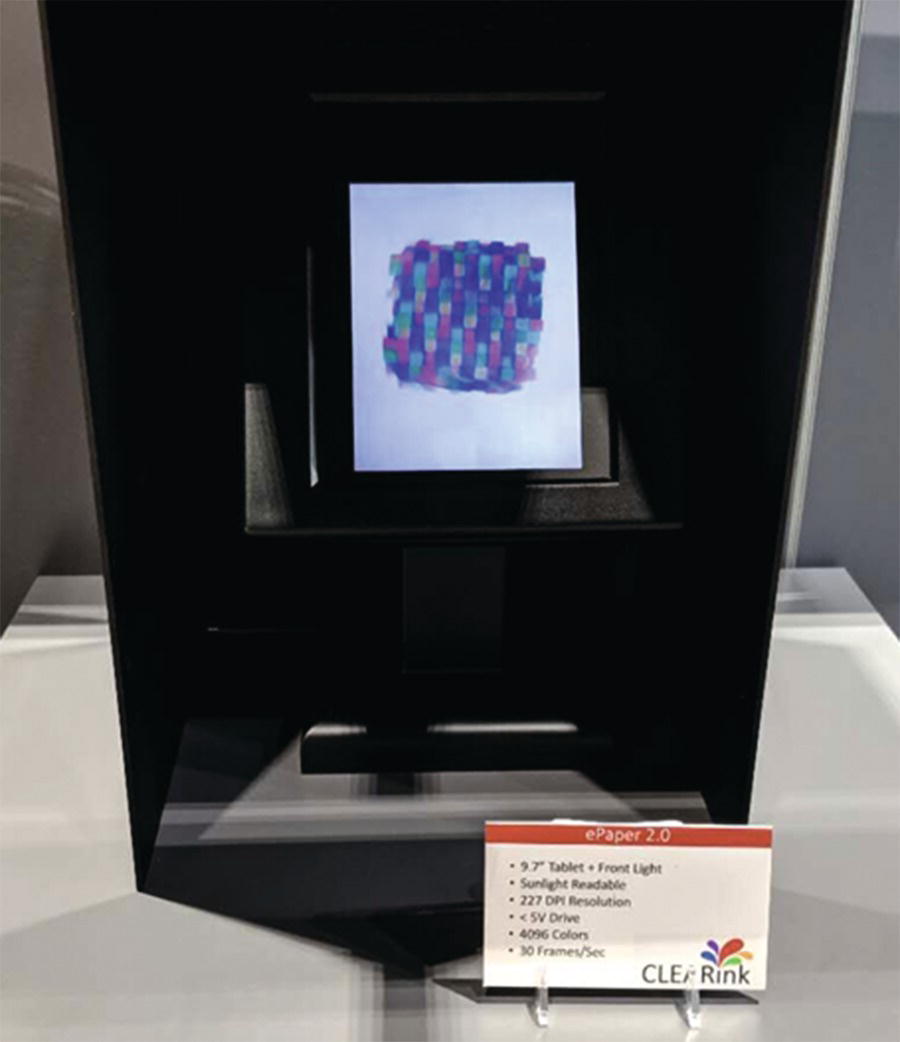
Figure 4.31 Picture of an image on a CLEARink display with a front light.
As ambient light conditions get brighter, emissive displays must increase the backlight power to increase the white state brightness to maintain image contrast. This increase in backlight power results in a considerable reduction in operation time between battery charges. The power savings of a CLEARink type display in outdoor, high ambient light viewing is very substantial has been reported elsewhere in detail [7].
4.6 Manufacturing and Supply Chain
The CLEARink technology was developed to “drop‐in” to existing LCD fabs. The rationale was that there is an excess of capacity on Gen 5 lines or smaller due to the migration to larger Gen lines in China, Taiwan, and Japan. With this strategy in mind, the technology was developed to be compatible with standard a‐Silicon backplanes, standard photolithography processes, and fill‐align‐seal with standard One Drop Fill (ODF) equipment. Existing LCD supply chain partners can fabricate the backplanes and CFAs, and the electrophoretic ink developed by Merck AG would be supplied to the qualified fab partners. The only significant deviation from standard LCD processes would be the micro‐replicated optics. The CFA would need to be supplied to the microreplicator, then supply back to the LCD fab.
4.6.1 Status of Technology and Future Projections
CLEARink Displays demonstrated their rapidly improving technology at SID Display Week in 2017, 2018, and 2019. Each year the small team (about 1/10th the size with approximately 1/10th the funding as its competition) showed dramatic improvements in color, resolution, stability, and controls architecture. The next major milestone was to complete the buildout of an engineering developer kit to offer to future customers for evaluation. 1.3″ active matrix development samples had been built and tested for six months showing good stability during driving and also good shelf stability. The next step is to run full reliability tests on the final device stack. CLEARink Displays changed ownership in April 2020, resulting in a shift in focus. As a result of this ownership change, the author cannot comment on the current status and future direction of the technology after March 2020.
The CLEARink display technology is in its infancy from a technological maturity point of view, compared to traditional EPD, OLED, and LCD technologies. If development resources continue to be deployed, display performance would continue to improve rapidly. Improvements in lens design, quality, and materials will lead to higher optical gain, which translates directly into brightness and color performance. Further optimization of the CFA will result in an improved color gamut. Ink, waveform, and device stack development will improve video speeds and reduce ghosting. Full‐stack architecture, material sets, and pixel sealing will need to be optimized to pass full reliability tests. A custom ASIC for the CLEARink architecture will need to be designed, built, and validated for the first commercial product. As of the completion of this chapter (July 2020), the market needs for low power, reflective display that is paper‐like yet offers rich color and video capability is yet to be fulfilled by any technology, but the author is aware of several companies and technologies that are chasing this dream.
Acknowledgments
I would like to acknowledge the generous support in the writing of this chapter from Dr. Michele Mossman, Dr. Thomas Johansson, Dr. Bavo Robben, Bram Sadlik, Sriram Peruvemba, Samantha Phenix, Dr. Julian Bigi, Dr. Peter Kazlas, Dr. Robert Holman, and the entire CLEARink R&D and Operations teams. I would also like to thank Professor Lorne Whitehead for his invention, continued dedication to the technology, and mentorship. Thank you to the entire CLEARink team. It was a joy working with you.
References
- 1 Comiskey, B., Albert, J.D., Yoshizawa, H. (1998). An electrophoretic ink for all‐printed reflective electronic displays. Nature 7 (394): 253–255.
- 2 Heikenfeld, J., Drzaic, P., Yeo, J.‐S. et al. (2011). Review paper: a critical review of the present and future prospects for electronic paper. J. Soc. Inf. Display 19 (2): 129–156.
- 3 Uchida, T., Katagishi, T., Onodera, M. et al. (1986). Reflective multicolor liquid‐crystal display. IEEE Trans. Electron Dev. 33 (8): 1207–1211.
- 4 Cummings, W. (2010). 63.1 The impact of materials and system design choices on reflective display quality for mobile device applications. SID Symposium Digest of Technical Papers 41(1):935–938.
- 5 Fiske, T. G. (2011). 64.2 MEMs‐based reflective display measurements in ambient use conditions. SID Symposium Digest of Technical Papers 42(1):954–956.
- 6 Castillo, S. G., Feng, L., Bachmann, T., et al. (2019). 57.4 Solid state reflective display (SRD®) with LTPS diode backplane. SID Symposium Digest of Technical Papers 50(1):807–810.
- 7 Fleming, R., Kazlas, P., Johansson, T., et al. (2019). 36.3 Tablet‐size eTIR display for low‐power ePaper applications with color video capability. SID Symposium Digest Technical Papers 50(1):505–508.
- 8 Fleming, R., Peruvemba, S., Holman, R., et al. (2018). 48.2 Electronic paper 2.0: frustrated eTIR as a path to color and video. SID Symposium Digest Technical Papers 49(1):630–632.
- 9 Pedrotti, F.L., Pedrotti, L.M., and Pedrotti, L.S. (1993). Geometrical optics. In: Introduction to Optics, vol. 38–39 (ed. R. Henderson), 419–420. New Jersey: Prentice Hall, Englewood Cliffs.
- 10 Whitehead, L.A. and Mossman, M.A. (2009). Reflections on total internal reflection. Opt. Photonics News 2: 28–34.
- 11 https://www.3m.com/3M/en_US/scotchlite‐reflective‐material‐us/industries‐active‐lifestyle/active‐lifestyle/how‐retroreflection‐works/
- 12 https://www.3m.com/3M/en_US/road‐safety‐us/resources/road‐transportation‐safety‐center‐blog/full‐story/~/road‐signs‐retroreflectivity/?storyid=328c8880‐941b‐4adc‐a9f9‐46a1cd79e637
- 13 Whitehead, L.A., Tiedje, J.T., and Coope, R. J. N. (1999). Method and apparatus for controllable frustration of total internal reflection United States Patent No. 5,999,307, 7 December.
- 14 Hecht, E. (1987). Optics, 2e, 95–113. San Francisco, CA, Editor Bruce Spatz: Addison Wesley.
- 15 Mossman, M. A., Rao, S.P., and Whitehead, L. A. (2002). P‐83 Grey scale control of TIR using electrophoresis of sub‐optical pigment particles. SID Symposium Digest Technical Papers 33(1):522–525.
- 16 Goulding, M., Farrand, L., Smith, A., et al. (2010). 40.1 Dyed polymeric microparticles for colour rendering in electrophoretic displays. SID Symposium Digest Technical Papers 41(1):564–567.
- 17 Goulding, M., Farrand, L., Smith, A., et al. (2012). High Performance Particle Materials and Fluids for Colour Filter Free, Colour Electrophoretic Displays. IDW/AD 245–248.
- 18 Goulding, M., Smith, N., Farrand, L., et al. (2015). 23.1 Colloidal dispersion materials for electrophoretic displays and beyond. SID Symposium Digest Technical Papers 46(1):326–329.
- 19 Fleming, R., Peruvemba, S., Sadlik, B., et al. (2019). EP2‐1 ePaper 2.0 (Full Color + Video) Enable by Retro‐Reflective eTIR Technoloy. Publisher: Society for Information Display, 25th International Display Workshops (IDW’18) Nagoya, Japan 3: 1252–1255.
- 20 Elliott, C. B. (2014). Image Reconstruction and Color Reproduction on Subpixelated Flat Panel Displays. PenTile Book 12–14 draft, May 2014.
- 21 Chen, Y., Au, J., Kazlas, P., et al. (2003). Flexible active‐matrix electronic ink display. Nature 5 (423): 136.
- 22 Albert, J.D., Comiskey, B., Jacobson, J.M., et al. (2003). Suspended particle displays and materials for making the same. U.S. Patent No. 6,515,649 B1.2003‐02‐04.
- 23 Ota, I., Ohnishi, J., and Yoshiyama, M. (1973). Electrophoretic image display (EPID) panel. Proc. IEEE 61 (7): 832–836.
- 24 Liang, R.C., Zang, H.M., Chung, J., et al. (2003). Microcup® electronic paper by roll‐to‐roll manufacturing processes. The Spect. 16 (2): 16–21.
- 25 Bai, P.F., Hayes, R.A., Jin, M.L., et al. (2014). Review of paper‐like display technologies. Prog. Electromagn. Res. 147: 96–116.
- 26 Kao, W.‐C. (2010). Electrophoretic display controller integrated with real‐time halftoning and partial region update. J. Disp. Technol. 6 (1): 36–44.
- 27 Shen, S., Gong, Y., Jin, M., et al. (2018). Improving electrophoretic particle motion control in electrophoretic displays by eliminating the fringing effect via driving waveform design. Micromach. 9 (143).
- 28 Kang, H.‐L., Kim, C.A., Lee, S.‐I., et al. (2016). Analysis of particle movement by dielectrophoretic force for reflective electronic display. J. Disp. Technol. 12 (7): 747–752.
- 29 Robben, B., Beunis, F., Neyts, K., et al. (2018). Electrodynamics of electronic paper based on total internal reflection. Phys. Rev. Appl. 10: 034041.
- 30 Robben, B., Strubbe, F., Beunis, F., et al. (2020). Polarity‐dependent adsorption of inverse micelles. Langmuir 36 (23): 6521–6530.
- 31 Rempel, A. G., Heidrich, W., Li, H., et al. (2009). Video Viewing Preferences for HDR Displays Under Varying Ambient Illumination. Proceedings of the 6th Symposium on Applied Perception in Graphics and Visualization, New York. 45–52.