5
Bistable Cholesteric Liquid Crystal Displays – Review and Writing Tablets
Clinton Braganza and Mauricio Echeverri
Kent Displays Inc., Portage Blvd, Kent, OH, USA
5.1 Introduction
Cholesteric liquid crystals (ChLC) were the beginning of this incredible phase of matter – discovered in the late nineteenth century. It was not till the late twentieth century that researchers at the Liquid Crystal Institute at Kent State University exploit their true applications and usefulness. Today, ChLCs are well suited for ePaper and more. They have multiyear bistability and do not require any polarizers or color filters to produce images [1]. ChLCs can be encapsulated for integration into flexible substrates (Figure 5.1a), are easily electrically driven (Figure 5.1b), and can also be optically addressed to create images [2].
In the last three decades, they have been developed into formidable display architectures from direct driven signage to large area passive matrix displays for signs, instrumentation, and more. They have been developed into flexible embodiments for electronic skins, eReaders, and, most recently, writing tablets (Figure 5.1c).
More fundamentally, they can be used to create full‐color images by either photo addressing, stacking layers, placing side‐by‐side ChLC tuned to primary colors or electrical tuning of each pixel. Displays made of ChLCs also lend themselves well to transparent modes. This permits the display to be used as a tracing paper or a form. The simplicity and ease of manufacturing and driving enable scale up in size and capacity.
ChLCs have been driven passively, actively, direct, and optically. They have been stacked, used glass substrates, plastic substrates, and even been formed on ultra‐flexible fabric materials. These materials have been the subject of research groups and commercialization activities worldwide. They continue to be the focus of many such applications today.
We describe fundamental modes of operation, their effectiveness, and their unique new capability in analog writing devices created via pressure‐induced flow alignment! The historical and scientific journey of ChLCs as described here is a true testament to the promise of this phase of matter that has been developed and exploited over the years!
5.2 Materials and Optical Properties
Cholesteric liquid crystals and Nematic liquid crystals administered with chiral dopants (Chiral Nematic) [3, 4] have a helical structure in which there is a slight twist along the helical axis of the liquid crystal director ![]() [5]. The pitch, Po is the distance for the director to rotate 2π, the period is Po/2 because
[5]. The pitch, Po is the distance for the director to rotate 2π, the period is Po/2 because ![]() and
and ![]() are equivalent.
are equivalent.

Figure 5.1 Examples of ChLC displays of different categories. (a) Glass based readers and signage, (b) flexible displays, (c) writing tablets.
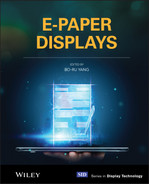
Suppose one were to place these materials between two transparent substrates. In that case, the helical axis can take on the following orientations, showing different textures, depending on the treatment of the surfaces adjacent to the liquid crystal. The helical axis orients perpendicular to the substrates with strong homogeneous alignment. This texture is called the Planar texture and is transparent [6]. When the surface alignment favors the molecules to anchor perpendicular to the substrate, the helical axis either lays parallel to the substrates, showing a fingerprint texture between crossed polarizers or randomly showing a weakly scattering Focal conic texture [7]. It is possible to control the substrate surfaces to make the Planar and Focal conic textures Bistable [8].
5.2.1 Optical Properties of Cholesteric Liquid Crystals
For light incident parallel to the helical axis of the Cholesteric liquid crystals in the Planar texture, there is a Bragg reflection whose wavelength λo is centered at 〈ne – no〉Po, where ne and no are the extraordinary and ordinary refractive index, respectively. The bandwidth Δλ of this reflection is (ne – no)Po [9]. The derivations of these equations are done by solving Maxwells equation for the propagation of the electric field vector through the helix [4] or those based on Bragg's reflection. The reflection is of the same handedness as the chirality of the liquid crystal, while the other handedness and wavelengths are transmitted [1]. With the Planar texture showing no defects and having typical birefringence of about 0.2, the reflectivity can be maximized by making the cell thickness at least 10 pitches. This color generation does not need polarizers, making this an ideal material for plastic substrates with birefringence. In the Focal conic texture, light is mostly forward scattered through the liquid crystal with some weak backscattering. This backscattering can be high in systems with a high polymer content. These two states, one providing color and another clear, can create stable images.
5.2.1.1 Color from Cholesteric Liquid Crystals
An absorbing layer can be placed behind these textures to further enhance the contrast of these images, with the Focal conic texture showing the color of the absorbing layer and the Planar texture showing the additive sum of the color of the liquid crystal Bragg reflection and absorber color. It is desired to place the absorbing layer as close as possible to the liquid crystal layer to limit any reduction in contrast from haze of the back substrate Figure 5.2.
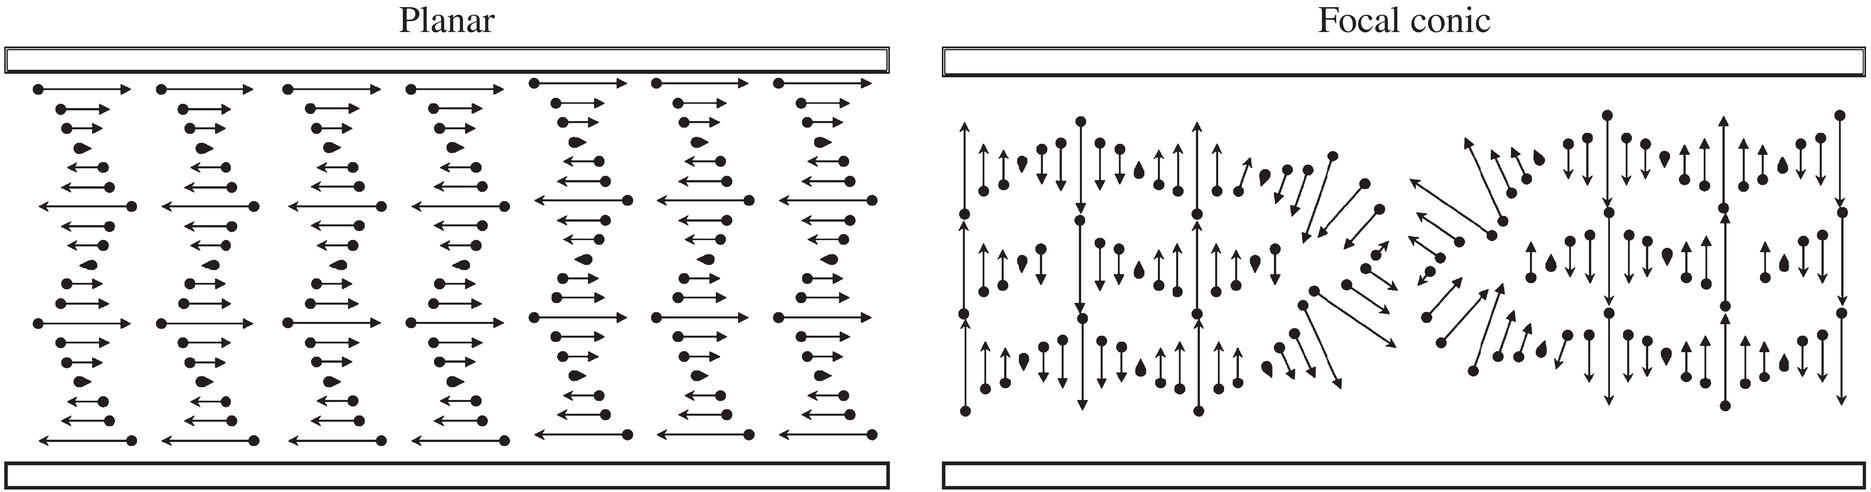
Figure 5.2 Illustrations of some structures of cholesteric liquid crystals.
The color reflected by the liquid crystal can be tuned by changing the pitch of the helix. The pitch can be modified by changing the concentration or the helical twisting power (HTP) of the chiral dopant according to the equation Po = c. HTP. The HTP is a parameter dependent on the chiral dopant, which imparts chirality and hence handedness to the doped liquid crystal. This can be achieved either in situ or ex‐situ. For example, the HTP can be temporarily changed using UV light to allow image creation, as in Figure 5.3 [2].
Recent work on color tuning application of an electrical field was shown using a new state of cholesteric liquid crystals, the Oblique heliconical structure [10]. Electrothermal color tuning has also been used for the same purpose [11]. A good review of the many methods developed to change the peak wavelength, including strain, humidity, and pH, is discussed elsewhere [12].
5.2.1.2 Optimizing Cholesteric Liquid Crystals for ePaper Applications
Although in ref. [11, 13] temperature is being used to tune the color; for most ePaper applications, the color needs to remain stable over a large temperature range (from at least 0 to 65 °C). Much work has been done to achieve this, including doping with left‐ and right‐hand chiral dopants [14] and using dopants showing an opposite change in HTP with temperature in the same mixture [15].
The peak wavelength λo has a significant dependence on the incident angle, blue shifting with increasing angles θ, [16] according to 〈ne – no〉Po cos θ. To reduce this undesirable dependence, an imperfect Planar texture is desired. This can be done by designing the surfaces in contact with the liquid crystal to form an imperfect Planar texture [17]. In surface stabilized cholesteric displays, the cell surfaces are treated with weak homogeneous or homeotropic alignment layers to stabilize the imperfect Planar helix. Under a microscope, the perfect Planar texture is reflective with very few defects, while the imperfect Planar texture shows multiple domains of bright spots about 5–50 μm in diameter [18]. An example of this reduction in the change in peak wavelength shift as the viewing angle can be very significant, as shown in Figure 5.4. The measurement was done in an integrating sphere to simulate diffuse illumination, mimicking reflective media usage's lighting conditions.

Figure 5.3 An optically addressed cholesteric liquid crystal display.
5.2.1.3 Optical and Mechanical Effects of Polymer Networks
In Polymer Stabilized Cholesteric Textures (PSCT) displays, a small amount of polymer is used to improve the bistability or performance of the system. Still, it also disrupts the Planar texture as depicted in Figure 5.5 while improving the viewing angle [8]. PSCTs are typically achieved using 0.5–10% of the polymer as long as the system remains in the liquid crystal phase. Higher polymer concentrations can generate structures where the polymer surrounds the liquid crystal‐like in microemulsions and Polymer Dispersed Liquid Crystals (PDLC) [19]. A PDLC made with ChLC is shown in Figure 5.6. In these systems, the viewing angle and reflectance depend on many factors, including the droplet size, uniformity, shape, encapsulation material, polymer wall thickness [20]. For example, tiny droplets will make the Focal conic texture backscatter too much light, lowering the contrast [21]. In addition to the change in reflectivity, the peak wavelength can also be affected by the encapsulation with the peak wavelength either red or blue shifting from its value in a surface stabilized system; the system in Figure 5.7 shows a redshift. With the proper choice of materials and encapsulating conditions,,. This change in reflectivity and wavelength can be controlled, as discussed later.

Figure 5.4 The change in peak wavelength of (a) a sample with nearly perfect Planar texture and (b) one with imperfect Planar texture.
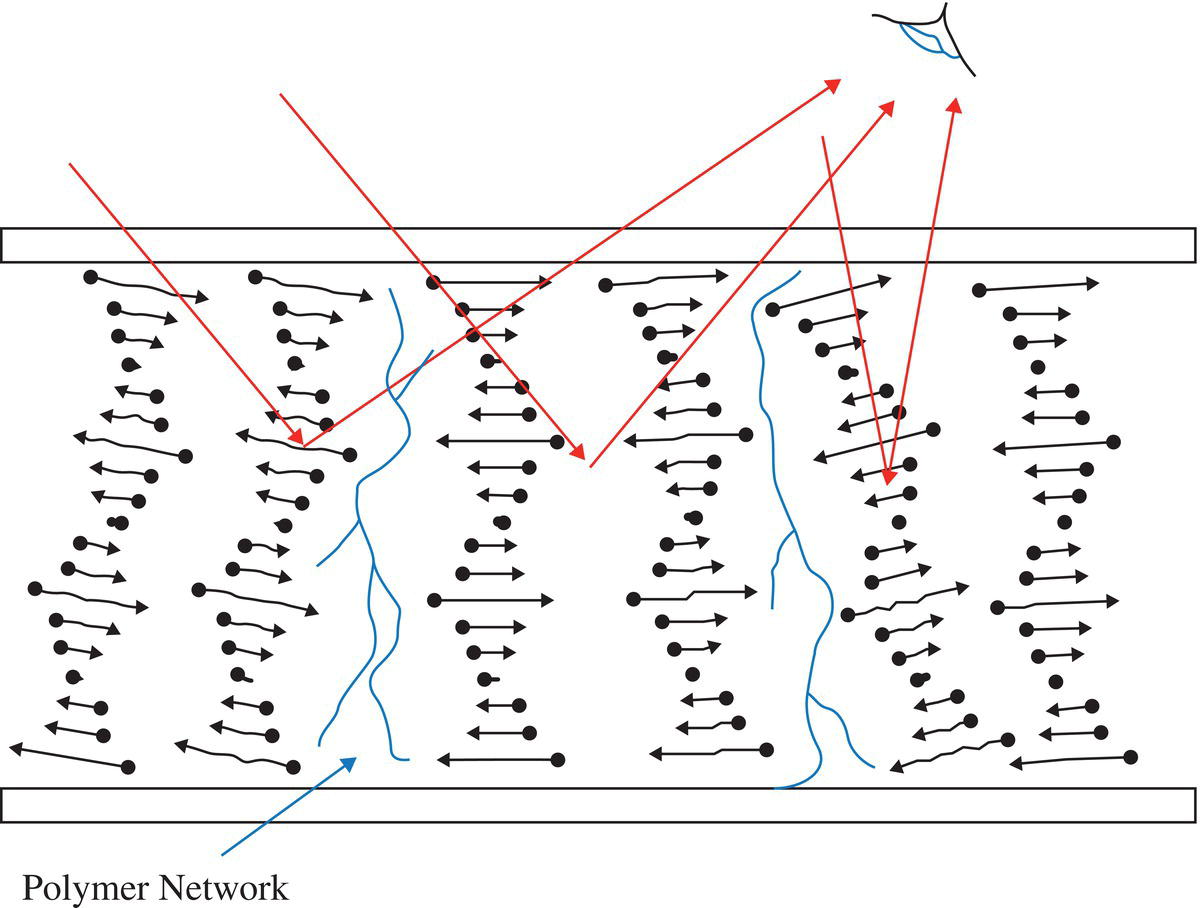
Figure 5.5 Illustration showing reflection from a cell with an imperfect Planar texture.
The extensive work on encapsulated ChLC paved the way to one of the most exciting applications of ChLC ePapers; flexible displays have tremendous advantages such as the possibility of continuous processing and the design of flexible, rugged, and lightweight devices. Encapsulating the ChLC in polymeric networks provides mechanical robustness and prevents liquid flow, allowing for a significant number of applications. The design of the polymeric networks from a structural perspective enables the improvement of mechanical properties such as adhesion and impact resistance. Figure 5.8 shows two different polymeric structures after their flexible substrates are removed. The failure mode indicates a cohesive fracture on the left since there is a remaining polymer on the substrate surface ( also present on the other substrate not shown here). The right‐hand side figure indicates an adhesive failure as the polymeric network layer detaches from the substrate surface [22].
Figure 5.9 is only one example of many flexible display prototypes developed over the years [23–25]. Different levels of resolution, drapability, color gamut, and ruggedness have been achieved. However, few of them are commercially available to writing this chapter.

Figure 5.6 Microscopic picture of a PDLC where one section is electrically switched to Planar and the adjacent area is in Focal conic.
Sometimes it is desirable to significantly broaden the reflection bandwidth, making the reflected color more achromatic, a feature ideal for black and white ePaper. This is achieved by using polymer networks to disrupt the Planar structure to a poly‐domain Planar Texture [26, 27]. One can also stack a yellow and blue cell on top of each other, attach a black absorber to allow color mixing to create a white Planar texture and a black Focal conic texture. It is also possible to create pitch gradients in the Planar state by using controlled photopolymerization of mixtures monomer and cholesteric liquid crystals [28–30]. The bandwidth has also been broadened using electrical fields [31].

Figure 5.7 Change in reflectivity and peak reflected wavelength of a cholesteric liquid crystal after encapsulation.

Figure 5.8 SEM micrographs of PDLC after substrates are removed and ChLC rinsed out.

Figure 5.9 Example of flexible and rugged display showcasing (a) high flexibility. (b) ruggedness so even after cutting the display is still functional.
To achieve even higher reflectivity, one can stack cells with left‐ and right‐handed cholesteric cells on top of each other to increase the reflectivity of the resultant cell to over 80%. It is preferred to use the larger domain size as the bottom layer in an encapsulated system.
In some cases, purer color is desired than can be achieved by controlling Δn, alignment layers, and encapsulation techniques. To compensate for the broadened bandgap and loss of color purity, reference [32] used color filters to absorb unwanted reflections at each of the color layers of a stacked RGB system to increase the gamut by 120%, as shown in Figure 5.10. Some groups use dyes in the liquid crystal layer for the same purpose.
5.3 Image Creation Using Cholesteric Liquid Crystals
5.3.1 Electrical Addressing
There are many ways to switch between cholesteric textures, including stabilizing the scattering Focal conic texture and switching it to a clear homeotropic state to make shutters and using very high pretilt, controlled cell gaps, and polarizers to make bistable displays. The more elegant and least complicated way to use them, without using polarizers, filters, complicated pretilts, or complicated manufacturing processes, is to use the cholesteric Planar texture reflecting in the visible region with both the Planar and Focal conic states being stable [24].

Figure 5.10 120% increase in color gamut and resultant color purity after application of cutoff filters (triangles).
In the presence of an electric field, cholesteric liquid crystals minimize free energy. For a material with Δε < 0, the helical axis will be parallel with the electric field, the opposite will be the case for Δε > 0. For this chapter, we will consider materials with Δε > 0.
Starting with a stabilized Planar texture, increasing fields destabilize the texture and either form oily streaks or Helfrich instability [33] to eventually form Focal conic texture after the field is turned off. The transition from Focal conic to homeotropic texture involves unwinding the helix as the liquid crystal molecules align parallel to the field. Complete unwinding occurs when the field is greater than ![]() , where K22 is the twist elastic constant of the liquid crystal and εo is the permittivity of vacuum. This transition is reversible.
, where K22 is the twist elastic constant of the liquid crystal and εo is the permittivity of vacuum. This transition is reversible.
To return to the Planar texture, one has to increase the field above Ec to unwind the helix to homeotropic texture. From the homeotropic texture, releasing the field quickly to below ![]() Of the field required to unwind, the liquid crystal transitions from a conic helical texture to a transient Planar texture before relaxing to Planar texture due to the shorter relaxation time of this transition. Releasing the field slowly from the homeotropic texture results in the Focal conic texture [17] through the nucleation of twist fingers [34]. A schematic of this is shown in Figure 5.11.
Of the field required to unwind, the liquid crystal transitions from a conic helical texture to a transient Planar texture before relaxing to Planar texture due to the shorter relaxation time of this transition. Releasing the field slowly from the homeotropic texture results in the Focal conic texture [17] through the nucleation of twist fingers [34]. A schematic of this is shown in Figure 5.11.
5.3.1.1 Driving Schemes
A representative electro‐optic response curve of a bistable cholesteric pixel is shown in Figure 5.12; there are two curves, one where measurements are taken with the pixel is reset to Planar texture and the other with the pixel reset the Focal conic texture. Each of the points on the curve is taken after the pixel has relaxed to its stable state, typically about 500 ms. With the pixel initially reset in the Planar texture before voltage pulse application, there is a threshold voltage, V1, before the pixel starts dimming. The region between V1 and V2 is where some domains remain in the Planar texture and others switch to the Focal conic texture. Between V2 and V3, the pixel is in the Focal conic texture, increasing reflectance after that as some domains unwind and switch to Planar until V4, where all the domains switch to Planar. With the reset pixel initially switched to the Focal conic texture, the curve stays dark until there is sufficient voltage > V3 to get some of the domains to Planar until V4, where they all switch to Planar. There is a difference at which the initially Planar and Focal conic pixels start grayscale and all switch to Planar due to the ease at of the Planar texture switching to homeotropic texture. This curve shifts to higher values as the voltage pulse width is decreased, eventually making it difficult to switch a Planar pixel to Focal conic [17, 24].

Figure 5.11 Schematic of the transitions among cholesteric textures. The intermediate textures have been omitted for simplicity.
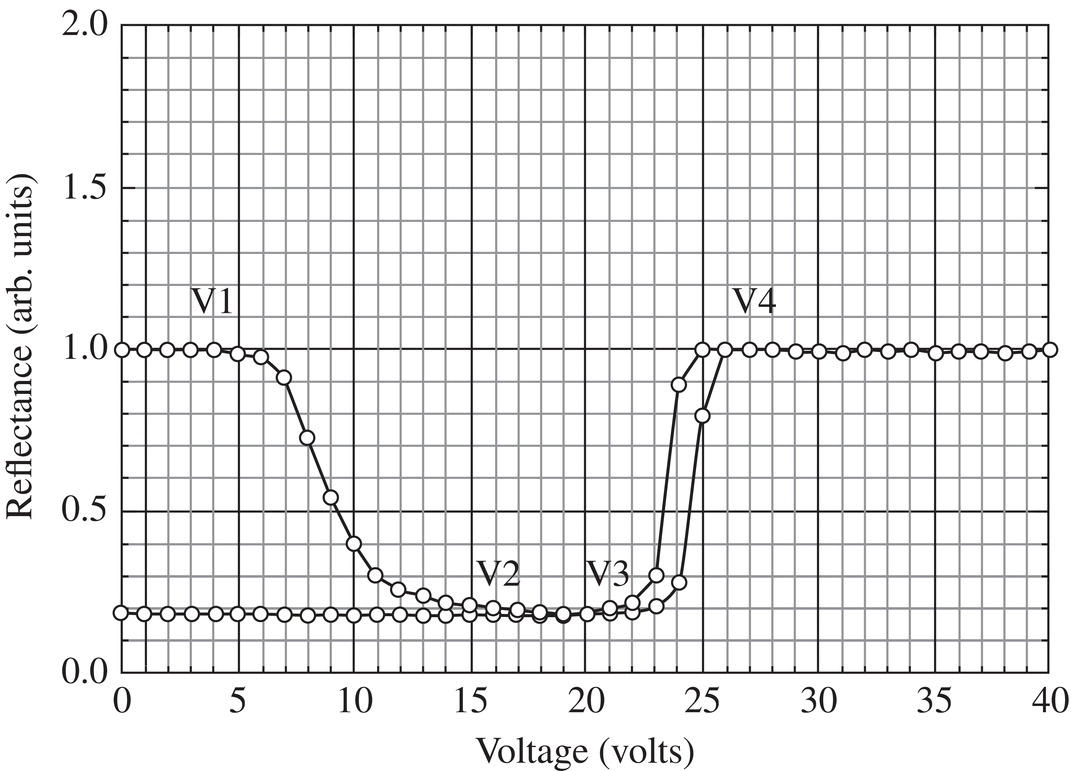
Figure 5.12 Representative response of a bistable cholesteric liquid crystal.
This curve allows for direct and grayscale addressing. A pixel can be driven to either a bright state by applying a voltage > V4 or a dark state by a voltage < V3. The grayscale values between V1 and V2 are reproducible and stable.
The threshold voltage V1 allows for Bistable cholesterics to be driven very simply using simple multiplexing without active matrix backplanes. This ability and ease to multiplex cholesteric displays make it very attractive to use flexible substrate, as the flexible active‐matrix backplanes are not readily available. In displays using the conventional drive scheme, Figure 5.13 shows one way that this is implemented [24, 35], where Vna = 0, Va=(V3 + V4)/2, ΔV = V4 − V3. There is no cross talk between pixels as long as (1/2)ΔV < V1. Grayscale is achieved by driving the columns between (1/2)ΔV and −(1/2)ΔV.
To speed up the slow addressing time of the conventional drive scheme, the dynamic drive scheme takes advantage of the fast homeotropic‐transient Planar transition and the hysteresis between the Focal conic and the Planar transition [36]. This drive scheme can provide an update rate of about one page per second. The cumulative drive scheme was developed to demonstrate video for smaller resolution displays and eliminate the black line observed when updating the previous two schemes. This scheme works on the cumulative effect of repeatedly driving the same pixel multiple times, with each pulse moving the domains to the desired state [37, 38]. In addition to multiplexing, active‐matrix backplanes are also used to drive the Cholesterics.
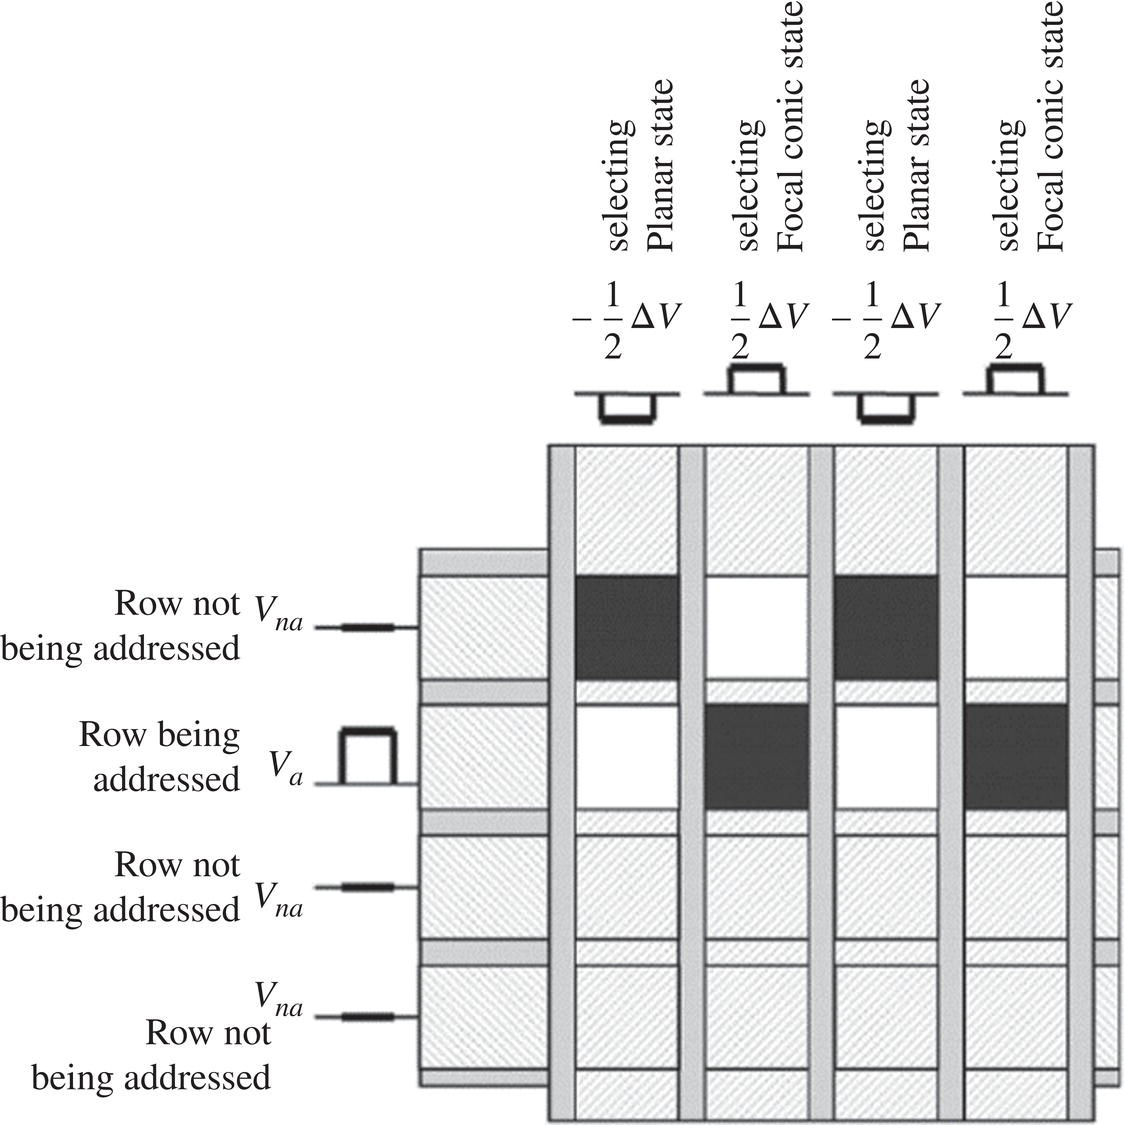
Figure 5.13 Conventional drive scheme.
5.3.2 Photo Addressing
The bistable image created in Figure 5.3 is done without patterning the conductive coatings. The image is made using a combination of UV irradiation and a one‐time electrical waveform to lock in the image. In this system, one of the chiral dopants can reduce its HTP through a trans‐cis isomerization upon UV irradiation. The result is a blue shift in wavelength as the other chiral dopants in the system are of opposite handedness and do not change with UV. Upon removing UV light, the dopant reverts to its higher HTP. To maintain an image created by, say, a mask, one can use the difference in the electro‐optic response shown in Figure 5.14. Applying a voltage in the shaded area will keep the unexposed area Planar and switch the exposed area to Focal conic, maintaining the image until one erases it all to the Planar texture.
5.3.3 Pressure Addressing
When a pixel of a bistable cholesteric liquid crystal is switched to the focal texture, localized pressure induces a volume change that generates flow in the film that causes it to reorient to the Planar texture. If the pitch is tuned to the visible range, the Planar texture will reflect visible light, and the Focal conic will show the color of the absorber behind it. In an unencapsulated system, this change can be uncontrolled. For example, a pencil‐pushing down on a 25cm2, 5 μm pixels will cause about a third of the pixel to change to the bright state. The next sections will discuss controlling and harnessing this change to create images of writing surfaces and tablets that use direct pressure to the liquid crystal layer.
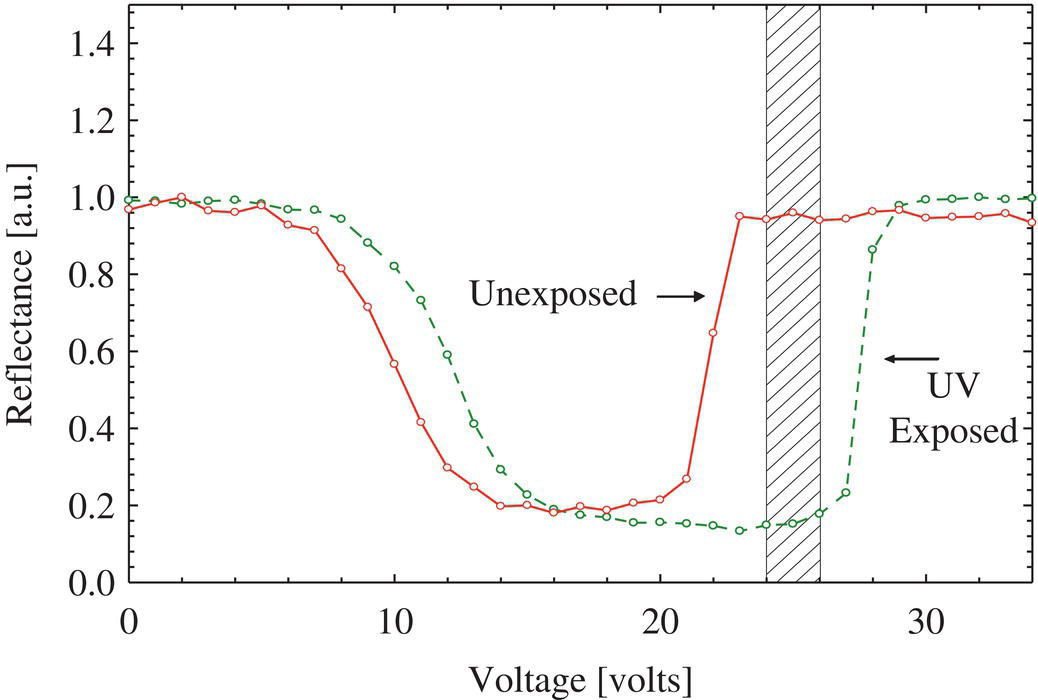
Figure 5.14 The electro optic response of the same displays that is initially reset to the Planar texture, before (solid line) and after (dashed line) UV exposure.
5.4 Applications
5.4.1 Displays for Reading
Black and white and monochrome Cholesteric displays using the technologies described above have been made on glass and plastic substrates. Full‐color displays were made by stacking panels of the primary colors on top of each other and placing RGB sub‐pixels on the same layer.
There are many methods of placing color into sub‐pixel. One can create polymer walls in the interpixel regions to prevent the cholesterics tuned to RGB from mixing and fillinging each color row in sequence in a pixelized vacuum filing process. In another method, a cholesteric liquid crystal tuned to red is filled into a panel with polymer walls separating the future subpixels. With the appropriate UV light dosage, the HTP of an irreversible tunable chiral dopant is changed so that the appropriate pixels are tuned to green and red using the masking technique as shown in Figure 5.15 [39, 40]. In yet another method, a photo tunable chiral dopant is combined with encapsulation to create polymer walls using a photomask during polymerization [41]. As seen in references [42, 43], work in this area continues.
5.4.2 Rugged Passive Driven Displays
Using encapsulation techniques, thin, flexible patterned PET substrates, and passive driving, a reliable display can be ‐ produced using roll to roll technique to make displays that are appropriate applications such as courtesy card and shelf labels where low power cost are key (Figure 5.16).

Figure 5.15 80 ppi ¼ VGA cholesteric reflective bistable display made using side by side RGB subpixels.
5.4.3 Electronic Skins
Cholesterics can be used to easily make color‐changing wraps or skins. The process of manufacturing encapsulated bistable cholesteric displays is roll‐to‐roll compatible, including the ability to laminate layers of cholesterics reflecting the primary colors and any other cut‐off filters that may be needed. A display made using this process is shown in Figure 5.17.
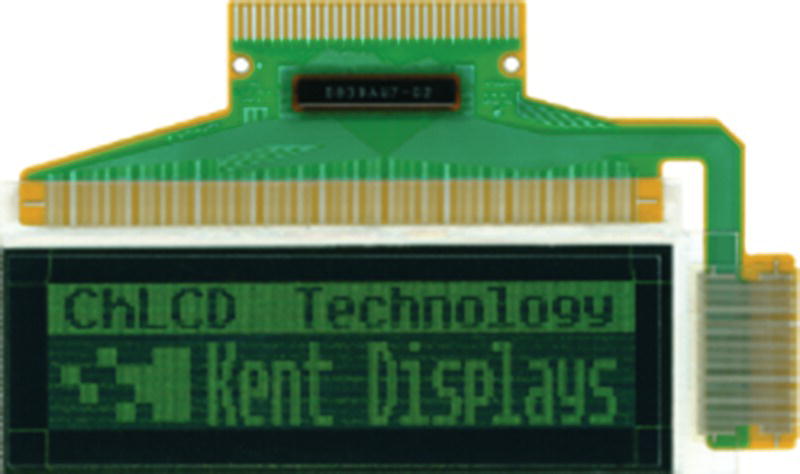
Figure 5.16 Rugged multiplexed encapsulated cholesteric displays made using plastic substrates.
5.5 Writing Tablets
ePaper technologies have transformed the user experience and interaction with electronics devices by appealing to the familiar reading experience that reflective displays offer. Cholesteric writing tablets complement this ecosystem by providing the experience of writing with pen on paper with the benefits of reusability, ruggedness, and low power associated with ChLC technology.
Unlike the encapsulated displays above, designed to prevent the flow of the ChLC, writing tablets take advantage of texture transitions obtained by the mechanically induced flow. They are their own category of ePaper that displays an image created by mechanical forces instead of individual pixel driving. There is no need for digitizers, force sensors, or special styli. Properties of the image created by pressure such as brightness, line width, contrast, and response to speed and pressure can be designed to target specific applications' needs. Handheld devices and medium to large size boards are just some of the examples of commercially available writing tablets.
5.5.1 Writing Tablet Structure
Figure 5.18 is a not‐to‐scale representation of the construction of a writing tablet panel. A polymer‐dispersed ChLC layer is sandwiched between two substrates. The front substrate must be flexible to transfer the writing pressure to the polymer dispersed ChLC layer. It also needs to be transmissive so that both, Planar, and Focal conic textures, are visible. The back substrate does not need to be flexible nor transmissive, it plays a role of supporting the conductive layer, and the polymer dispersed ChLC layer. If the back substrate is transmissive, a light‐absorbing layer might be needed to control the contrast between the written image and the rest of the device. The reflective and transmissive properties, and the color of the back substrate, and the light absorbing layers dictate the general appearance of the written image and the background.
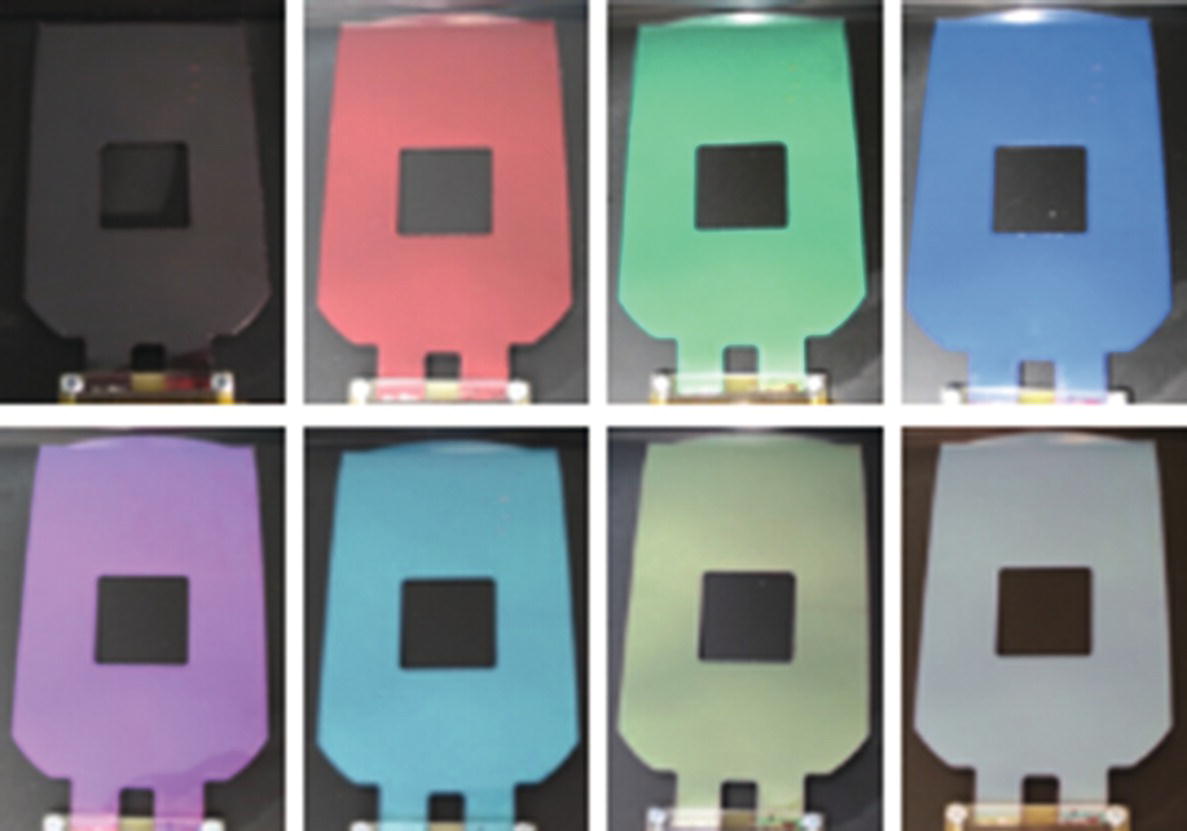
Figure 5.17 The some of the colors produced by a single pixel multilayer encapsulated cholesteric display made for applications where color change is desired. Note the hole though the display panel.
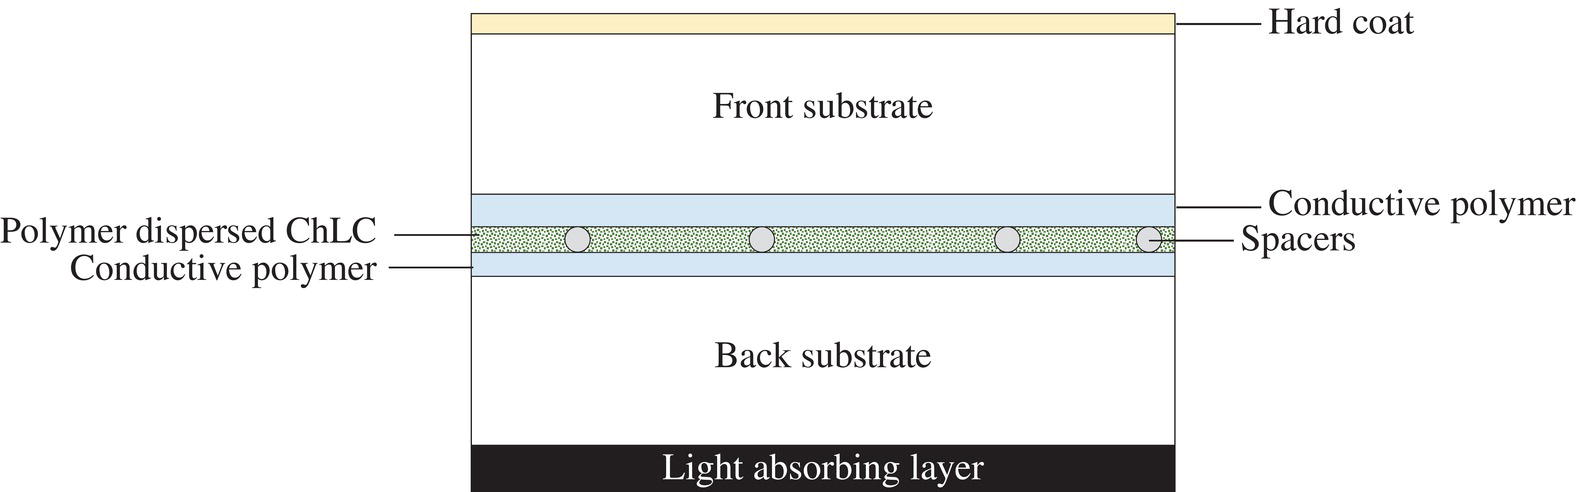
Figure 5.18 Not to scale cross section of a typical ChLC panel used in writing tablets.
Both substrates are coated with conductive polymer facing the polymer dispersed ChLC layer. There are many types of conductive polymers, but poly(3,4‐ethylene dioxythiophene) polystyrene sulfonate (PEDOT: PSS) is by far the most widely used. PEDOT: PSS is easy to coat from a water‐based suspension and is flexible enough to withstand tablets' writing process and manufacturing. Indium Tin Oxide (ITO) can also be used instead of conductive polymers, but its brittleness can be a disadvantage during the manufacturing process and jeopardize the final device's reliability. ITO could also require alignment or dielectric layers that prevent shorting the device.
In most cases, spacers are needed to separate the conductive layers and control the thickness of the polymer dispersed ChLC. Most typical spacers are spherical and can be made of crosslinked polymers or ceramic‐like materials.
The polymer dispersed ChLC is considered the active layer of a writing tablet as it optically responds to mechanical and electrical stimuli. It consists of a ChLC. Usually, a nematic and chiral mixture is entrapped in a connected polymeric network that allows restricted fluid flow. The thickness of this layer ranges from 2 μm to around 10 μm.
Other functional layers can be added to modify the device's appearance or provide protection against environmental effects. For example, a hard coat can be coated on the front substrate to prevent premature wear and tear due to writing. The hard coat or the front substrate can also contain UV blocking agents to prevent damage by light exposure.
5.5.2 Fabrication of Writing Tablets
Unlike typical encapsulated PDLCs, the ChLC in a writing tablet is embedded in an interconnected polymer network, enabling flow without total encapsulation. It is also different from PSCT in that the presence of polymer is not only to stabilize the liquid crystal texture but also to restrict the liquid crystal preventing excessive flow. The manufacturing of writing tablets employs Polymerization Induced Phase Separation (PIPS) principles to control the morphology of the polymer network containing the ChLC. Acrylic, vinyl, or thiol‐ene crosslinkers and monomers are mixed with a ChLC material in an isotropic phase with proportions typically in between PDLC's and PSCT's systems. The polymerization takes place using Ultraviolet (UV) light requiring the photoinitiator to absorb in the same frequency as the maximum emission of the light being used. The reaction is triggered following a Free Radical Polymerization (FRP) mechanism. The presence of crosslinkers, i.e. multifunctional reactive molecules, randomizes the propagation step growing a crosslinked network that starts rejecting the non‐reactive ChLC components in virtue of the entropy reduction associated with the polymerization process [44, 45]. Other methods such as Temperature Induced Phase Separation (TIPS) or Solvent Induced Phase Separation (SIPS) can be used to generate the polymeric structures needed in a writing tablet. Figure 5.19 is a schematic representation illustrating that the procedure takes place after the isotropic mixture of precursors is sandwiched between the substrates and the cell gap is set with the help of spacers. In this example, the substrates are polyethylene terephthalate (P ranging from approximately 25 to 175 μm approximately.
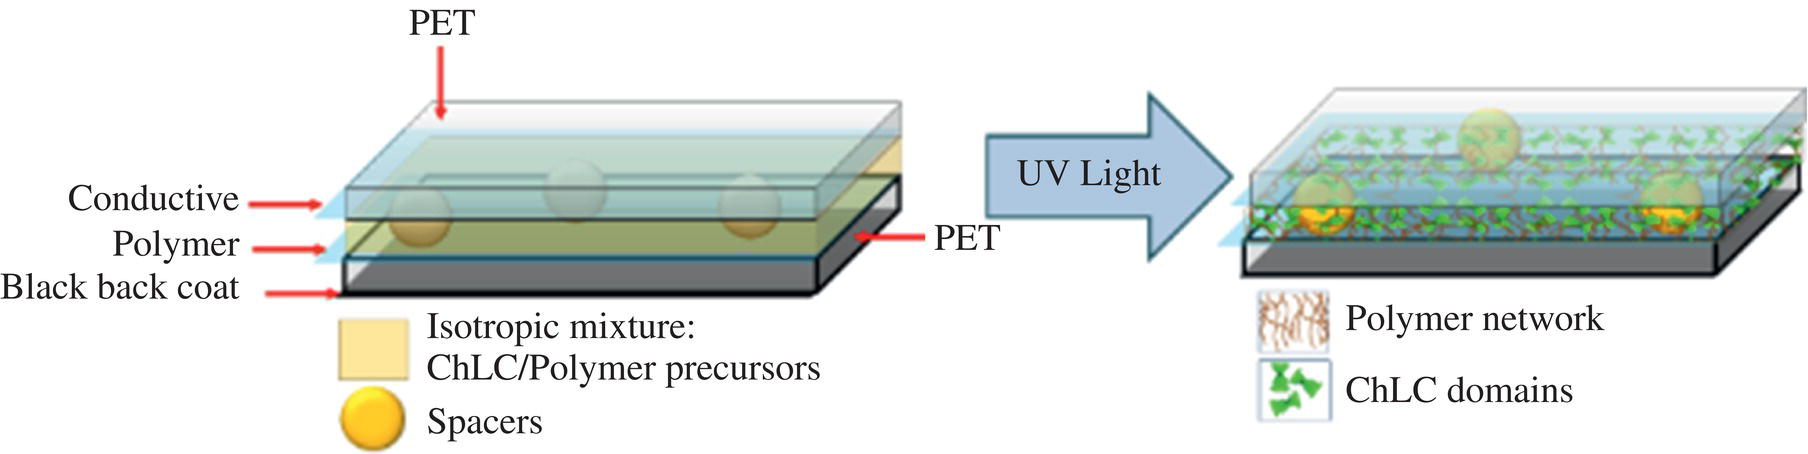
Figure 5.19 General representation of the polymerization induced phase separation process to fabricate a writing tablet.
The theoretical framework of this process proposed by different authors suggests that the kinetics of polymerization have a significant effect on the final morphology [46, 47]. This means that the crosslinker functionality and concentration, the presence of acrylates and methacrylates, the efficiency of the photoinitiation, and the curing conditions are of paramount importance to consider while formulating the initial isotropic mixture. Additionally, solubility parameters of the ChLC during the different stages of the polymerization and the viscosities and relative diffusion characteristics of the different components, are known variables of significant importance to consider that make the prediction and design of morphologies an experimental process.
As is well known, phase separation during a PIPS process can occur by nucleation and growth or spinodal decomposition. The former requires a minimum energy barrier to form nuclei that grow in time. The latter, takes place when the energy barrier is negligible, so separation proceeds through even the smallest fluctuations. Polymeric interconnected networks are often associated with phase separation by spinodal decomposition between the polymerizing structures and the liquid crystal. However, theory and experimental observations support the idea of a crossover in behavior where phase separation starts with nucleation and growth followed by emerging unstable structures corresponding to spinodal decomposition.
Furthermore, depending on the kinetics of polymerization and phenomena such as gel point, the final polymeric structure might not resemble the initial stages of phase separation. In some cases, nucleation, and growth is the dominant phase separation mechanism. Still, the morphology freezing happens later, here nucleated droplets have coalesced into semi‐interconnected structures [48, 49].
The flexible properties of all the layers forming a writing tablet make it a suitable candidate for mass production using roll‐to‐roll processing. The most common manufacturing method in the industry starts with an isotropic mixture composed of ChLC, monomers, crosslinkers, and photoinitiators that are laminated in a cleanroom between flexible PET substrates previously coated with PEDOT: PSS. Spherical spacers control the cell gap of the laminated structure. The system is then continuously exposed to UV light that triggers the photoinitiators, subsequently initiating the polymerization. All this happens continuously at room temperature with virtually no VOC emissions or water waste. After curing, a highly precise automated laser cutting system singulates the parts without interrupting the continuity of the process. The laser cutting is engineered so high throughput can be achieved without delaminating or electrically shorting parts while, at the same time, protecting the parts from accidental delamination. The high versatility of the system is designed to perform different shapes and sizes without the need for retooling or consumables [50, 51].
5.5.3 Polymer Morphology of CHLC Writing Tablets
The ChLC response to different mechanical forces is subject to the geometry, and topological features of the resulting polymeric network after the PIPS is completed. Figure 5.20 shows SEM pictures of the morphologies of different writing tablets taken after the front and back substrate were separated and the ChLC rinsed off with isopropanol. Morphology “a” shows a tight uniform structure resembling a sandy agglomeration that restricts ChLC flow, substantially favoring the formation of thinner lines during writing. Morphology “b” combines larger droplets (pools) with tight tunnels connecting them, which allows for a broader line. Morphology “c” exhibits an even, more significant proportion of droplet‐like reservoirs, promoting even broader and brighter written lines.
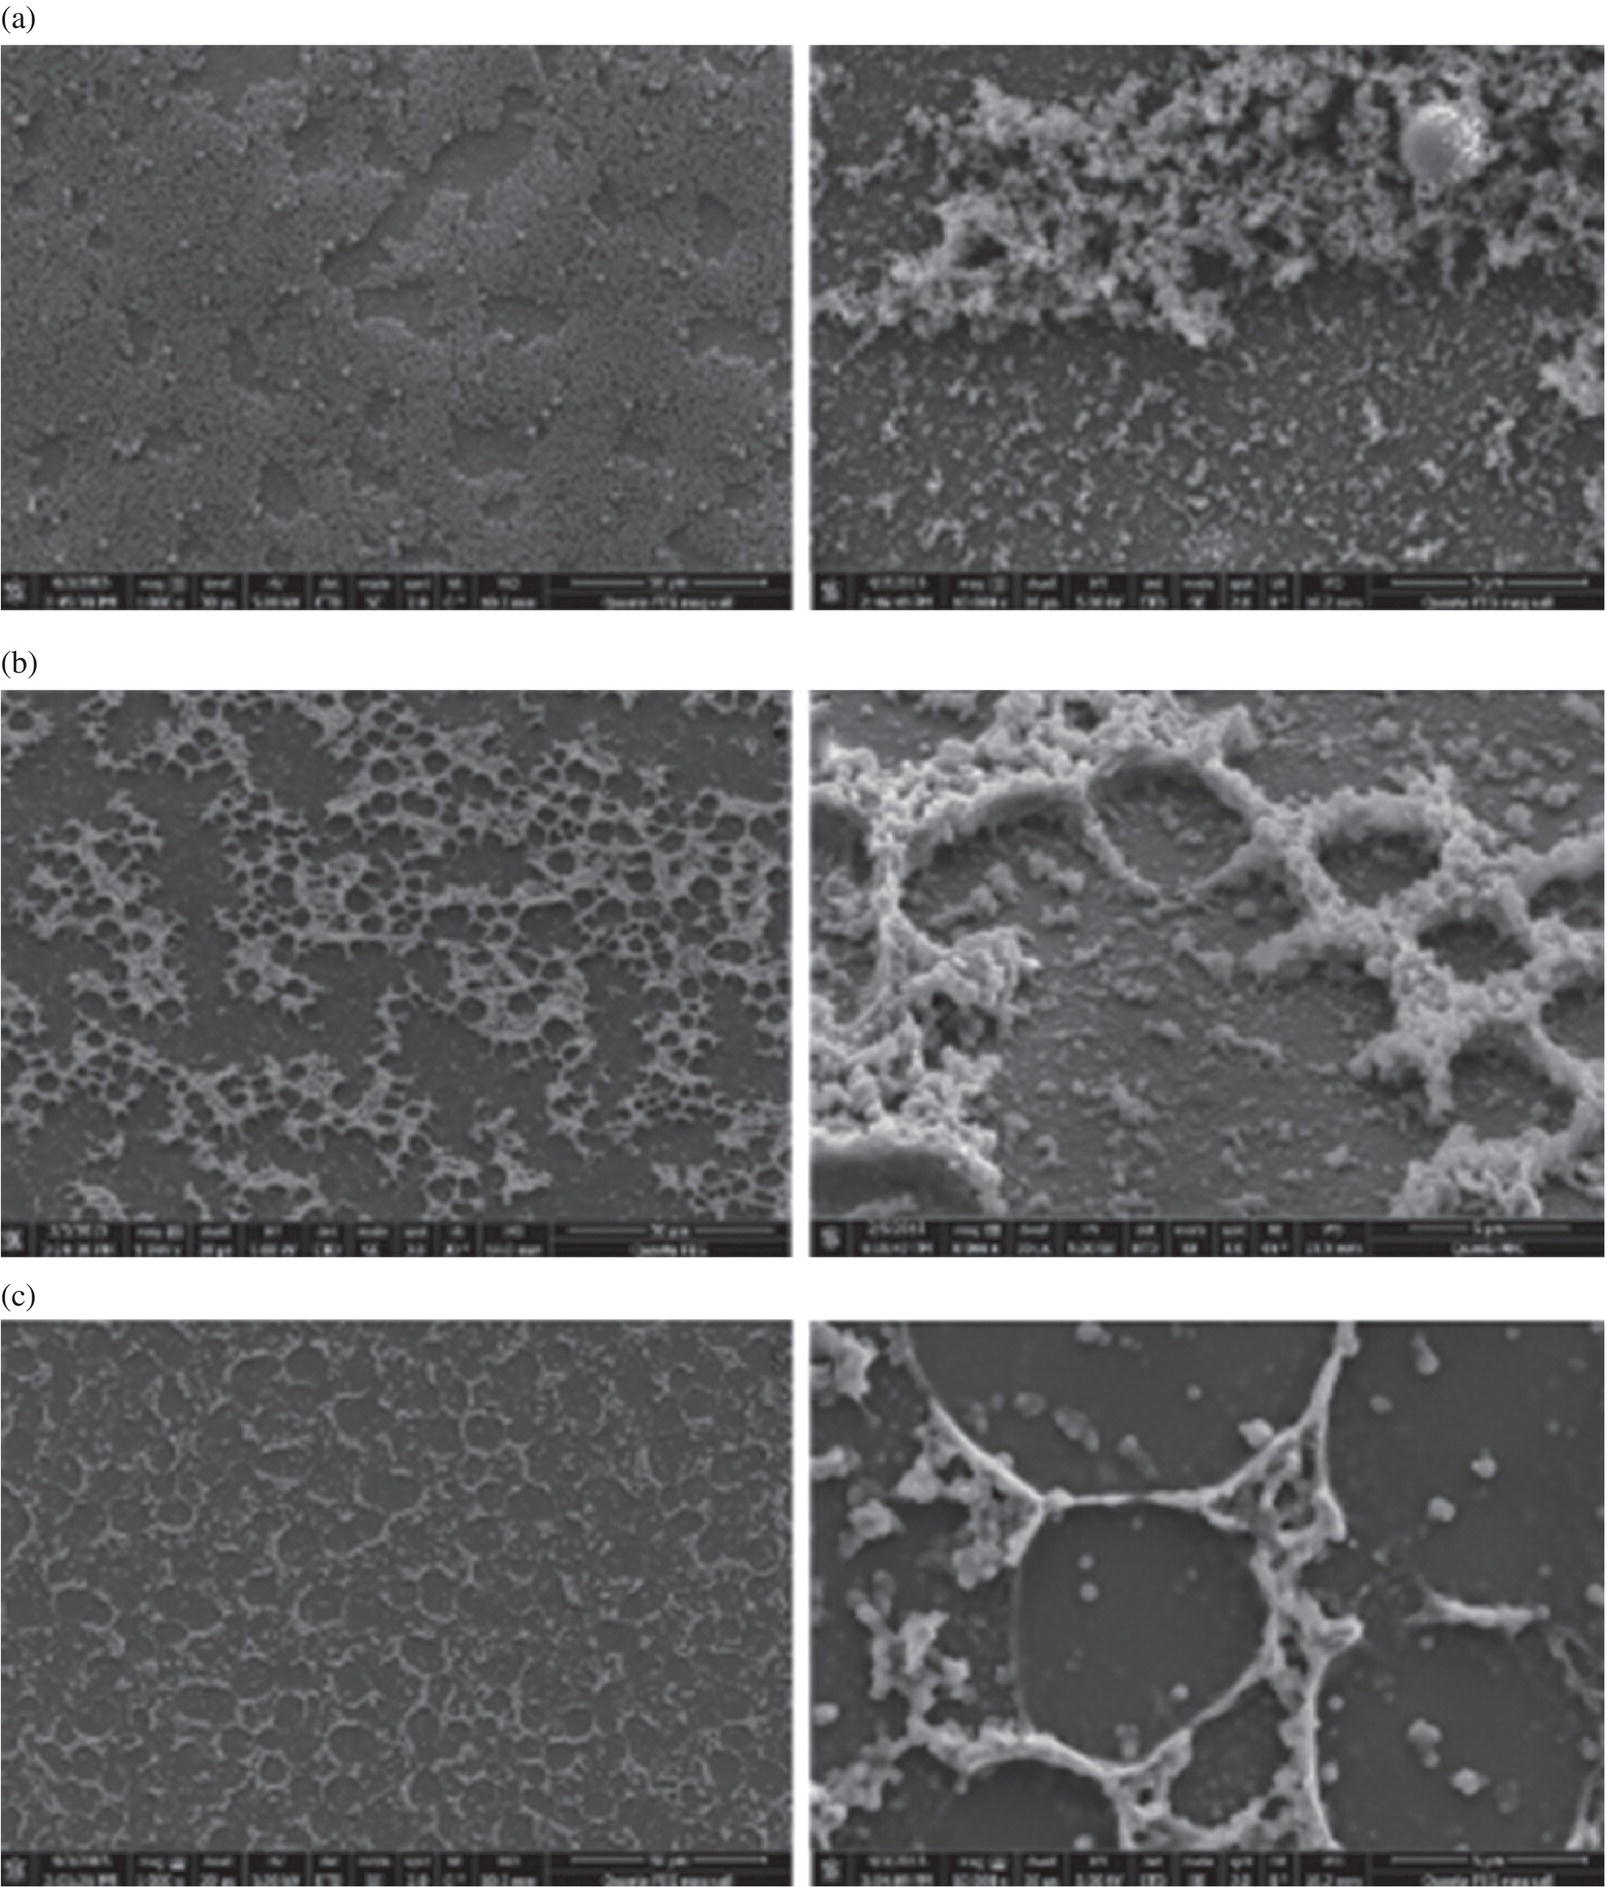
Figure 5.20 SEM pictures of three different types of writing tablet morphologies. The scale of the bar for the left‐hand‐side column is 50 μm and for the right‐hand‐side column is 5 μm.

Figure 5.21 SEM micrograph of a cross section of a writing tablet. The scale bar in both figures is 10 μm.
To better understand the scale of the layers in a writing tablet construction, Figure 5.21 shows a cross‐section of a writing tablet obtained by SEM after preparing a sample with an ultra cryo‐microtome. This morphology is similar to sample “b” in Figure 5.20. In this view, one can appreciate the polymer pockets that contained the ChLC and the tighter surrounding structure that connects them. The writing tablet of Figure 5.21 has a cell gap of 3 μm.
Figure 5.22 shows a close‐up of a written mark created by applying pressure with a pointed stylus on a writing tablet. The flow created by deflecting the front substrate disturbs the formerly Focal conic textures to a bright Planar texture while the rest of the device remains in Focal conic,, allowing one to see the back substrate, which is a PET film with a black layer on the opposite side.
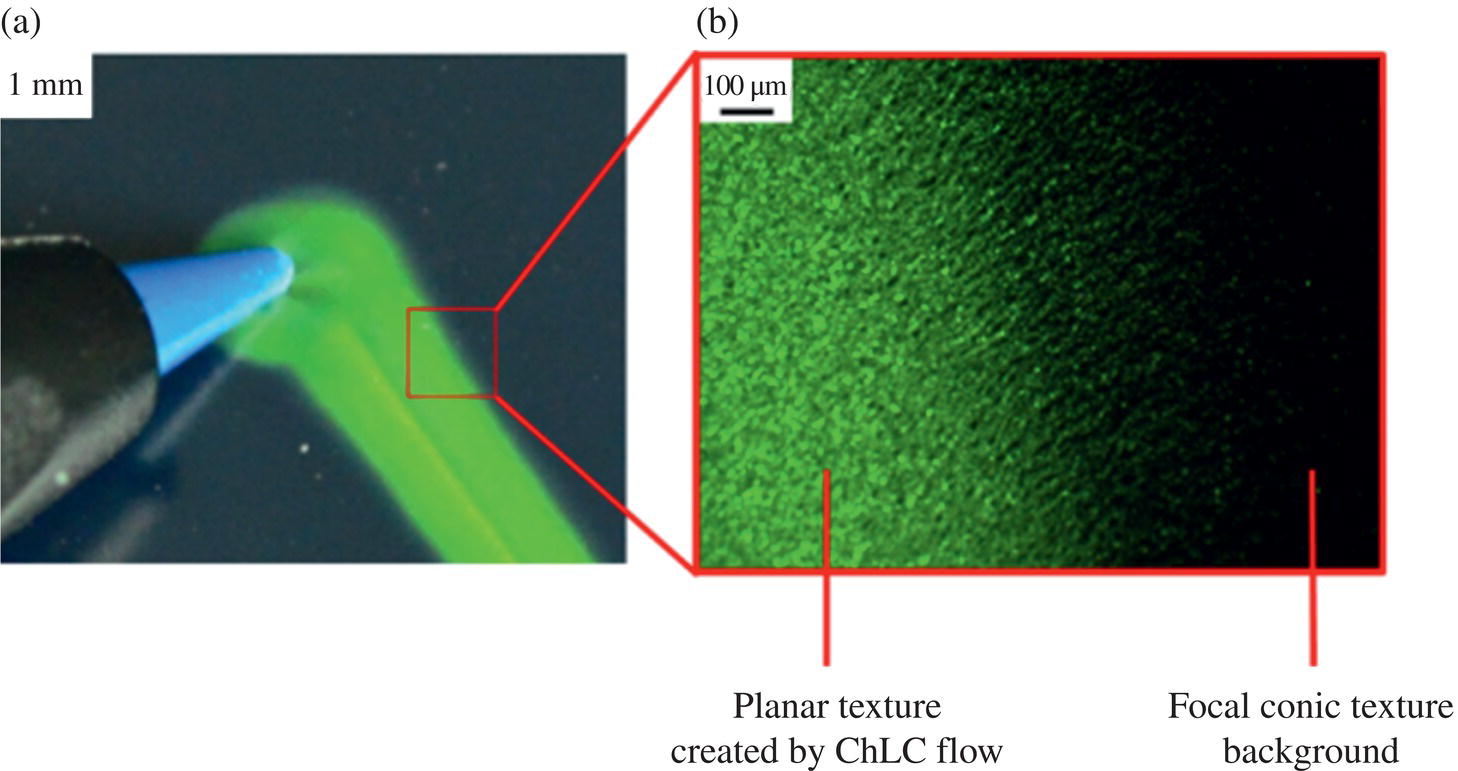
Figure 5.22 Zoom in to the border between Planar textures created by flow and the Focal conic texture of the rest of the device.
A critical aspect that separates the writing tablet technology from the more typical PDLC’s and PSCT'’s is that the final polymeric network must be designed to withstand high compression and shear forces involved during the writing process. For example, a polymer network with brittle properties might break irreversibly during the process. A low hardness polymer can also deform, changing the morphology of the network and, subsequently, the writing properties of the damaged area. The reliability of writing tablets will be discussed later in this chapter.
5.5.4 Characteristics of Writing Tablets
5.5.4.1 Writing Mechanism
The effect of flow on the ChLC textures has been the subject of analysis over the years. One of the first reports tracked the transmission and reflection of a layer of ChLC exposed to different shear rates [52]. The objective of the experiments was to explain the effect of shear forces on the Planar textures of the ChLC mixtures., At low shear rates, the reflectance of the ChLC layer increased and shifted toward blue, concluding that the helical structure of the ChLC behaves as a rigid unit tilting with little distortion. Intermediate shear rates seemed to create a complex stratified distribution that may include a Focal conic layer in the middle and Planar layers in contact with the shearing surfaces. Higher shear drives the system to a homeotropic state. In all cases, the system relaxed to a Planar texture after a short time.
More recently, researchers have proposed computational simulation of the microfluidic flow of cholesteric liquid crystals to study the rheology of ChLC with different anchoring conditions in the context of a Poiseuille flow. Their hydrodynamic model was solved numerically, showing other texture transitions at different pressure gradients for a ChLC with homeotropic anchoring conditions going from finger patterns at low pressures to the formation of Planar structures at larger pressure gradients [53]. To fundamentally understand the effect of flow on a polymer dispersed ChLC writing tablet, one needs to consider the complexity of the rheology of anisotropic material, such as ChLC, in confined heterogeneous geometries, such as polymeric networks (Figure 5.20). The current state of the art clarifies that it is an intricate task and an incredible opportunity for the scientific community.
As a qualitative depiction of the cycle of writing and erasing of a writing tablet, Figure 5.23 shows how an unwritten surface appears black as the weakly scattering focal conic texture allows light to go through the layers to be absorbed by the black background. If a pointed object is used to deflect the front surface of the construction, force is transferred to the polymer dispersed ChLC changing the volume and inducing localized flow on the initially Focal conic domains forcing them to reorient to a Planar texture that follows the trajectory of the writing. The net flow of ChLC is constrained by the polymeric network providing the final shape and size of the written line that remains after the pressure is released. Notice that up to this point, there is no need for an electric field thanks to the bistable properties of the polymer‐stabilized ChLC. After the writing is finished, an electric pulse can reposition all ChLC domains back to the Focal conic texture.
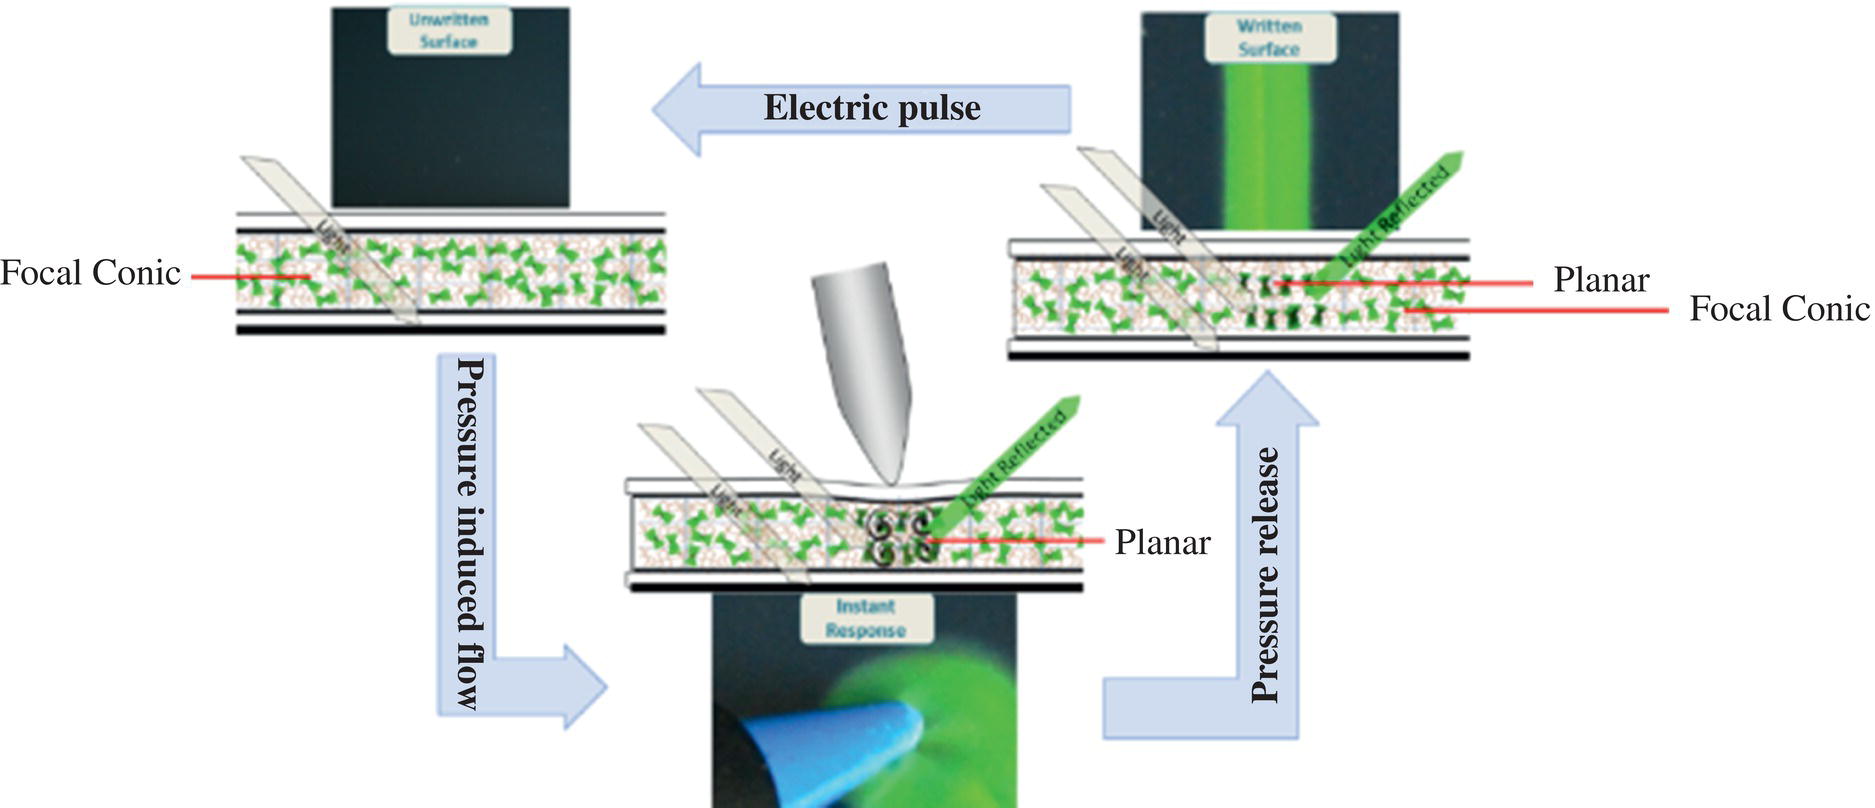
Figure 5.23 Writing and erasing cycle of a writing tablet.
Human writing is a complex process that involves several neurophysiological and biomechanical variables [54]. However, for all practical purposes, one could assume that the effect of writing on a surface can be described by the writing speed and the force applied to the surface through the writing object. Previous measurements show that writing speeds and forces vary largely depending on the user, age, and writing style. However, it can be assumed that the human writing speed distribution is centered around 75 mm/s and force around 150 gF [55, 56]. These approximations will be used in the chapter to describe the general effect of human writing on the writing properties of ChLC writing tablets.
One way to characterize the writing tablet properties is to draw the line at a given weight and speed using a non‐compressible stylus tip of a known radius. Its width can be measured manually or digitally. The effect of writing weight and speed on the intensity profile of written lines is shown in Figure 5.24. All measurements correspond to one writing tablet using the same instrument. Notice that the width and shape of the written mark changes substantially with speed at a fixed weight. In the case of fixed speed and varying weight, the shape remained similar while the intensity decreased significantly when lighter weights were applied on the writing tablet. One can infer that slower writing speeds promote larger outward flows as there is more time for liquid crystal molecules to be influenced by substrate deflection.
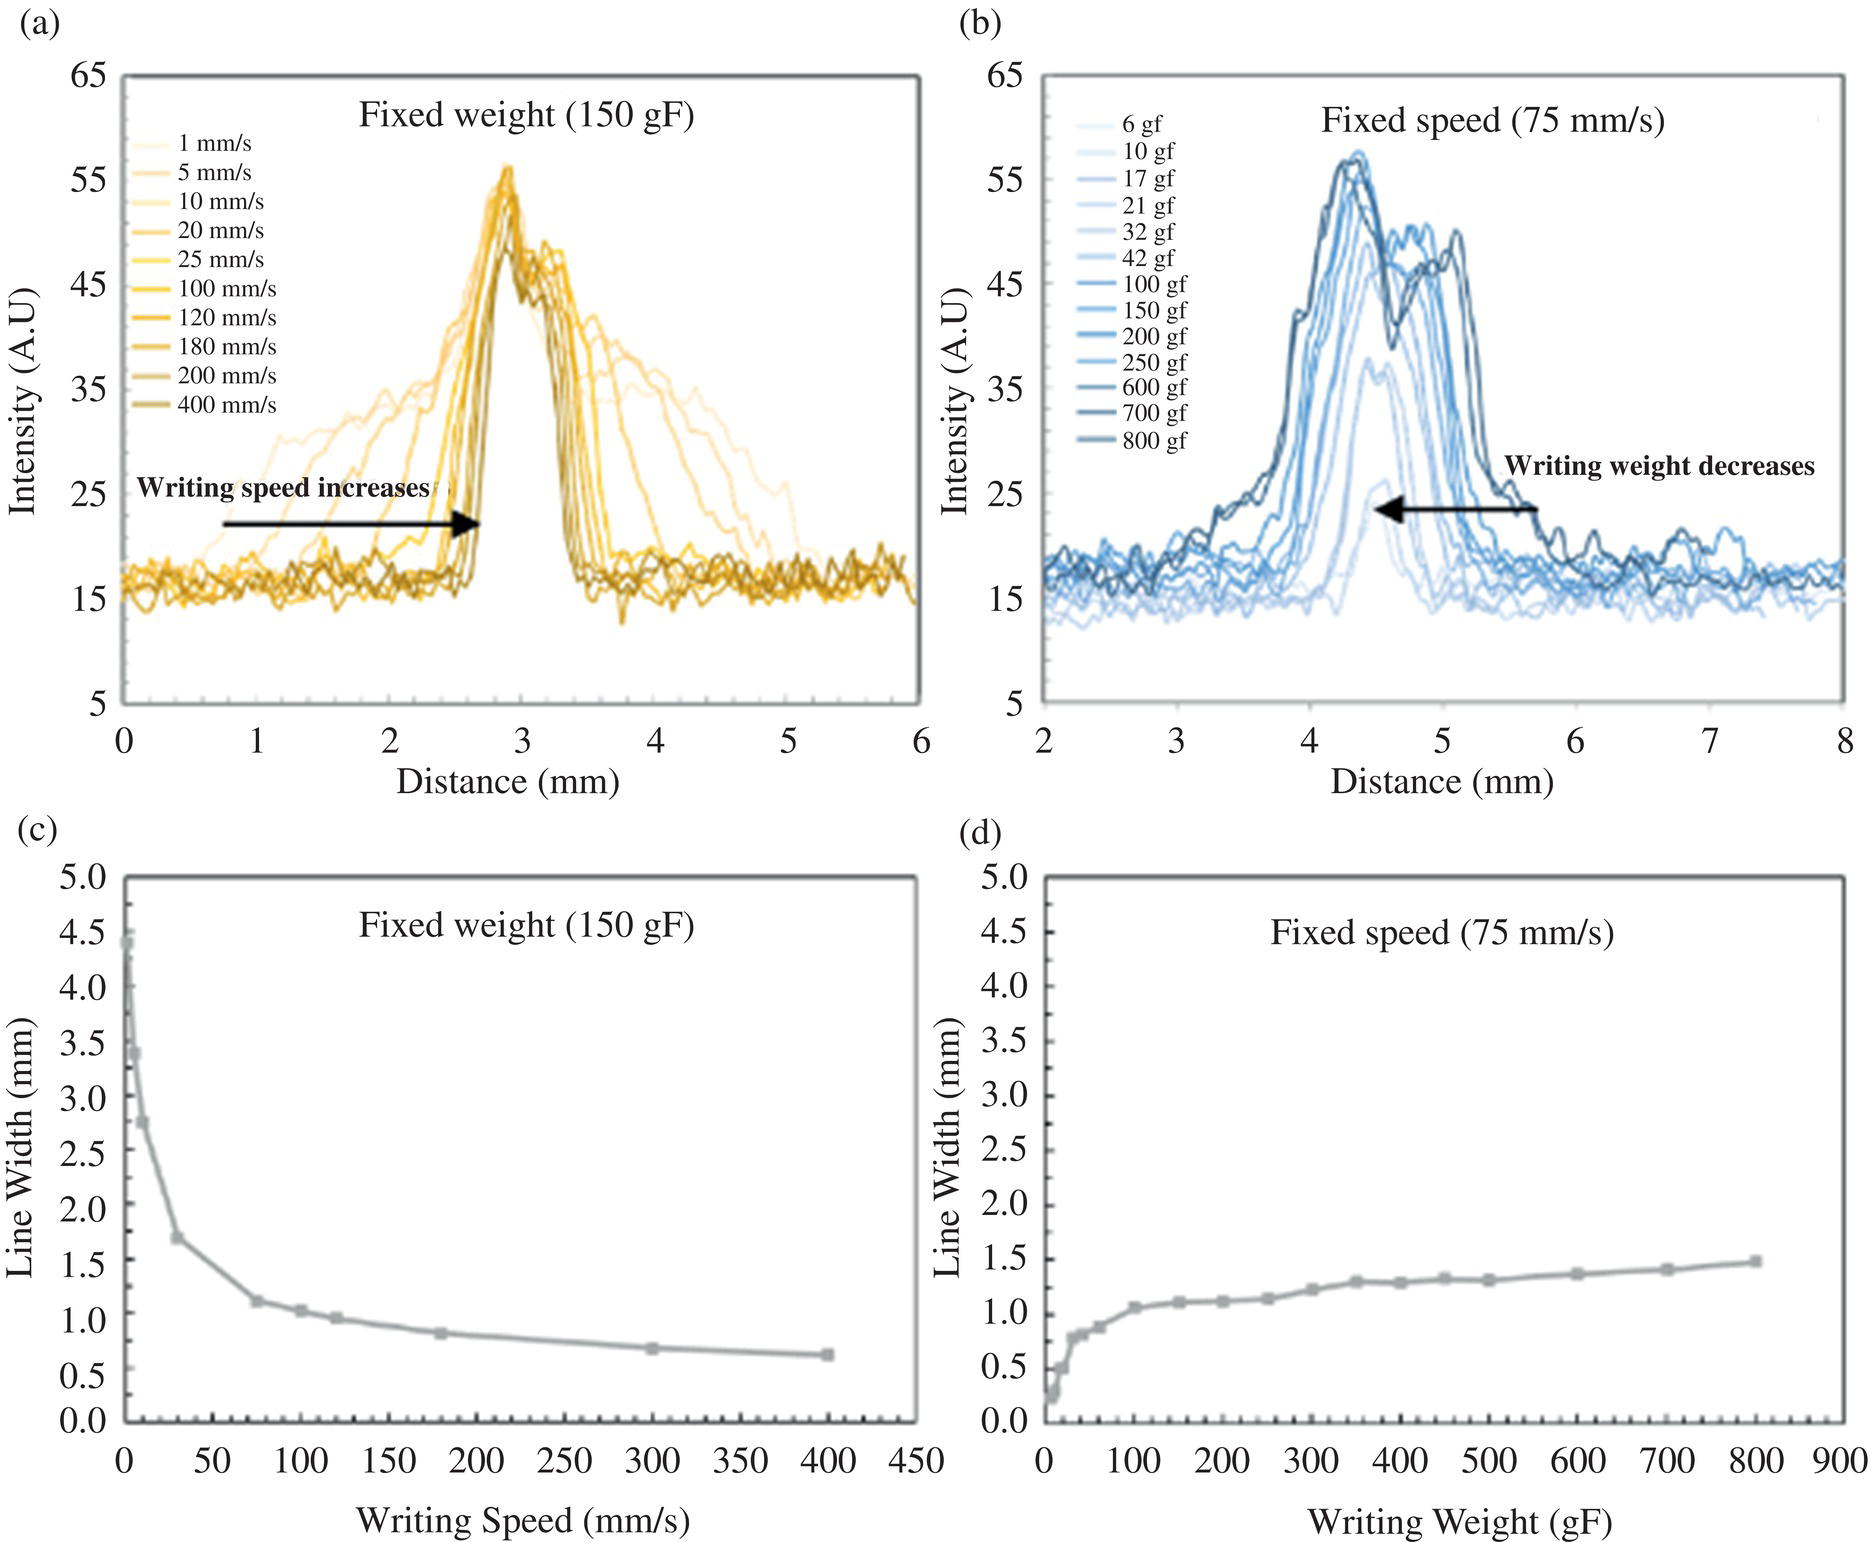
Figure 5.24 Effect on written line intensity profiles of: (a) writing speed at a fixed weight. (b) Writing weight at fixed speed. (c) and (d) are their respective plots against the line width measured at each condition.
Interestingly, line widths cover a significant range from less than 1 mm to about 4 mm; note that the writing tip is a hard‐sphere of 3 mm diameter, which means the effect is not necessarily related to the writing object size but to the flow exerted by it. The message here is that the size of the mechanically induced Planar texture is essential. The patterns and features inside the line can be of significant interest on the fundamentals of how a ChLC material responds to different forces when confined inside polymeric networks.
As hinted before, it is possible to obtain different ChLC embedded in morphologies with different features. Consequently, it is expected that the line response to weight (writing force) and speed would be different for different systems, as exhibited in Figure 5.25, where each trend represents a different polymer morphology. It becomes evident that it is possible to obtain highly sensitive systems that respond quickly to speed or weight changes while others remain flattered over the same range of speeds and weights.
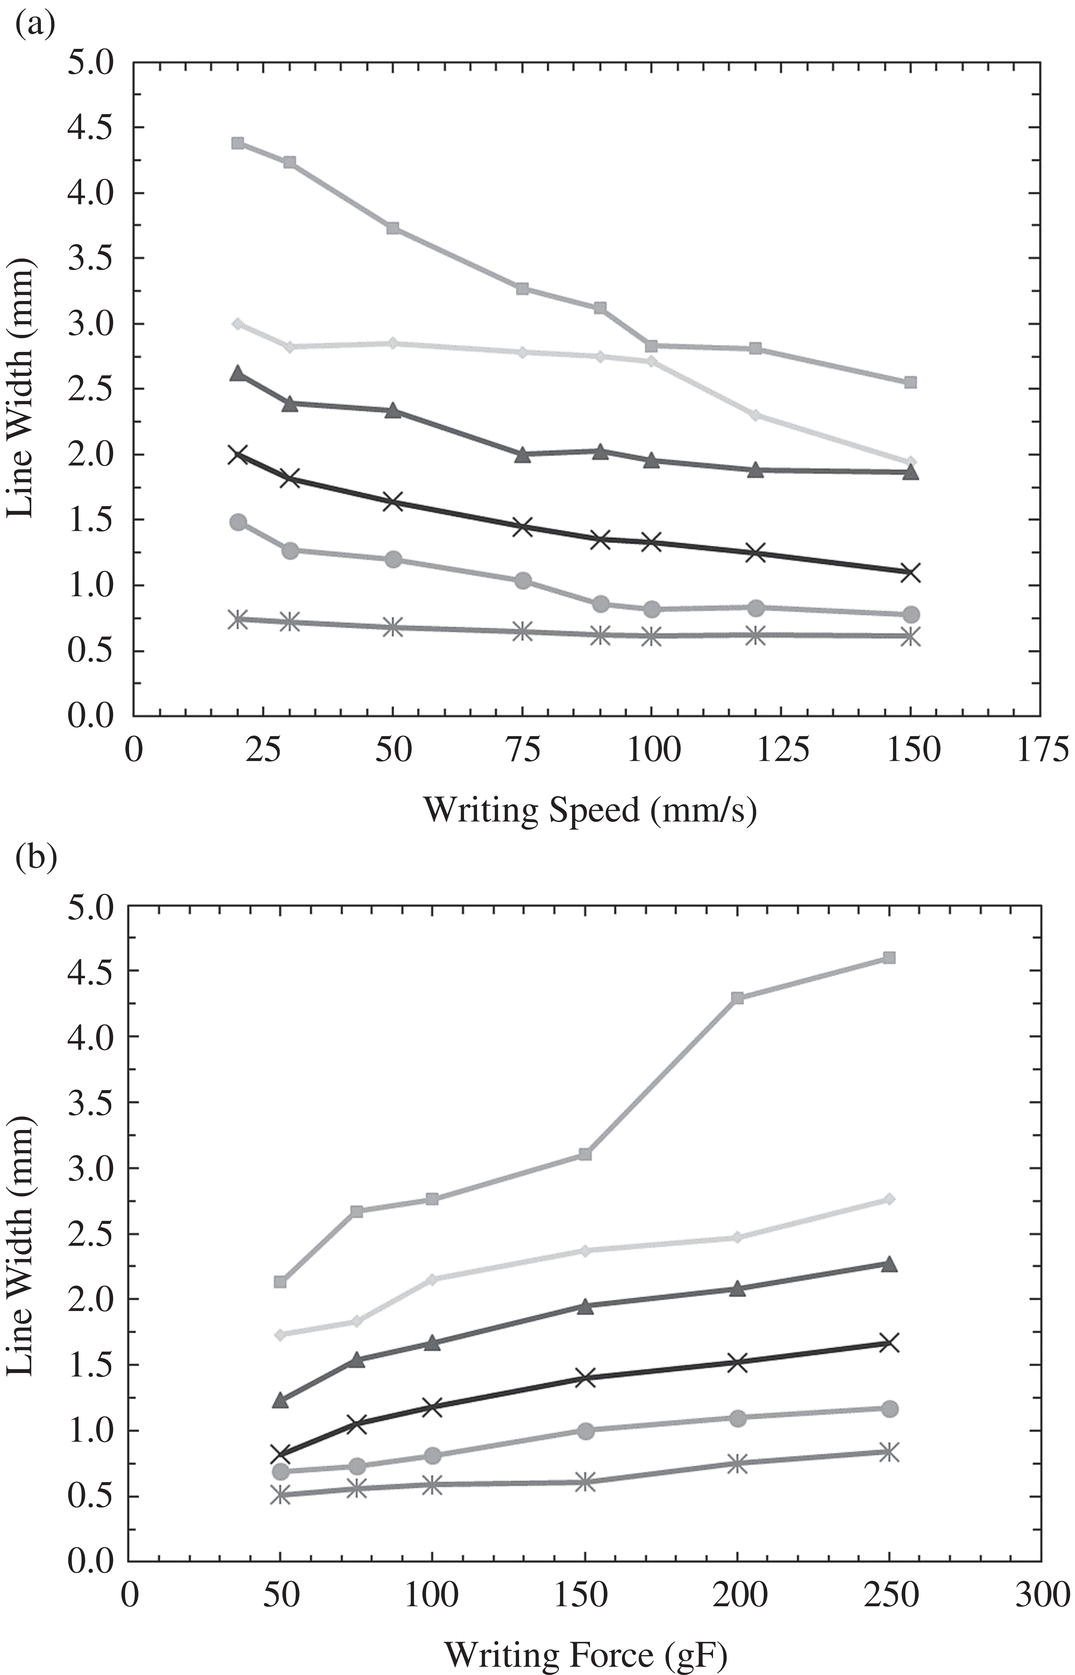
Figure 5.25 Different writing tablet morphologies exhibiting different responses to: (a) different writing speeds with writing weight fixed at 150 g. (b) different writing weights at a fixed writing speed of 75 mm/s.
Another critical property of lines created by pressure on a ChLC writing tablet is reflectance. Generally, higher reflectance is achieved with systems that show wider line widths. However, as seen in Figure 5.26, it is also possible to obtain thinner lines with the same or higher reflectance as thicker ones. The factors affecting the reflectance of writing tablets are not entirely understood given the complexity of the morphology, alignment between the ChLC and polymer walls, interactions between ChLC and/or polymer with the surface of conductive polymer, scattering effects, etc. Writing reflectance measurement can be made through diffuse illumination at an 8° viewing cone, with specular component included (SCI) under a D65 illuminant for a 10 ° (CIE 1964) observer. The measurement is made, so the aperture of the equipment covers an area that is fully written on.
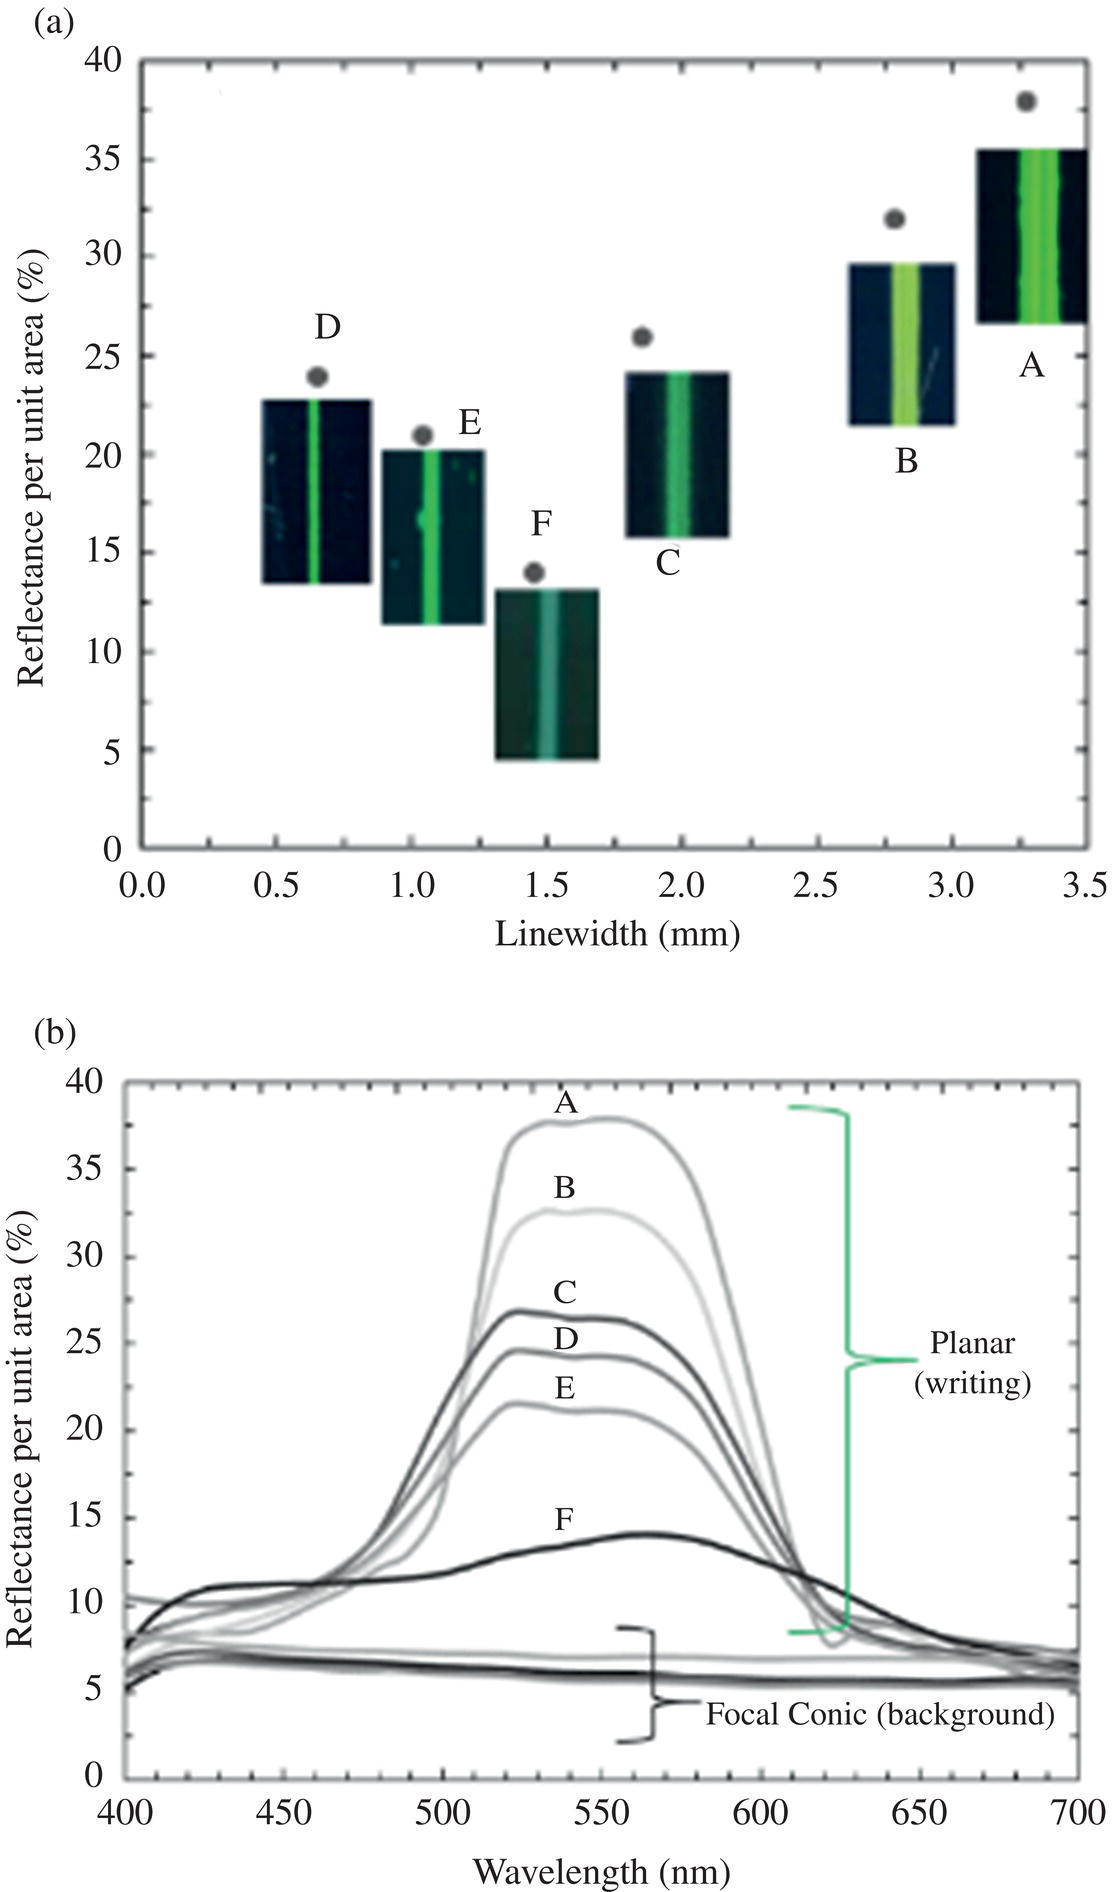
Figure 5.26 (a) Linewidth and peak reflectance per unit area plot for different writing tablets A–F. (b) Reflectance spectra of Planar and Focal conic textures of writing tablets A–F.
Consequently, any reference to reflectance should be considered as per unit area. The comparison between the reflectance of the written line (Planar) versus the reflectance of the background (Focal conic) is a measure of the contrast of the device. The background reflectance is a combination of the optical properties of the Focal conic texture of the ChLC, polymeric network, and back substrate. As seen in Figure 5.26, contrast‐enhancing is usually achieved by increasing the reflectance of the written line without increasing the reflectance of the background.
One interesting finding is that the effect of the cell gap does not follow a monotonic relationship with the reflectance of the written line. Unlike pure ChLC, writing tablets may exhibit different regimes [57]. As seen in Figure 5.27, thinner cell gaps exhibit higher reflectivity up to 4 μm, where the behavior changes perhaps now dominated by the well‐known dependence on the number of pitches that can fit in the cell gap [58]. One plausible hypothesis is that thinner cell gaps maximize the alignment of ChLC molecules in the Planar texture to the substrate surface concerning the lateral polymeric walls. Similarly, one can imagine that thinner cell gaps promote the formation of ChLC pools in interconnected droplets like the structures presented in Figure 5.20; it is expected that said structures result in better and larger Planar domains.
5.5.4.2 Electro‐Optic Response of Writing Tablets
Like measuring the curves with a pure electrical response, the display needs to be reset to a known initial state before measuring its voltage response. An erase and reset waveform at the drive frequency (typically around 3 Hz) that would switch the display to the weakly scattering Focal conic state are determined to obtain these curves. Typically, this waveform has two bipolar pulses, one to switch the writer to Planar and another to reset the display to the dark state. The erase pulse amplitude is set to the maximum voltage step of the measurement. The best reset amplitude is the voltage provides the darkest focal conic state. A typical result is obtained u the schematic shown in Figure 5.28 for every voltage step, a specific result is obtained as shown in Figure 5.29.
Note that, in some cases, the reflectivity of the written line is higher or lower than the reflectivity obtained by switching the display to the bright state. Looking at Figure 5.29, the reflectivity of the written line before voltage V1 is higher than the reflectivity after voltage V4. At voltages less than V1, the voltage is not high enough to switch the display to homeotropic and enable the transition to Planar. Therefore the reflectance of the written line dominates. But at voltages higher than V4, the voltage is high enough to switch the display to Planar.
![Schematic illustration of reflectance of the written line of different writing tablets with different cell gaps With Adapted from [57].](https://imgdetail.ebookreading.net/2023/10/9781119745587/9781119745587__9781119745587__files__images__c05f027.jpg)
Figure 5.27 Reflectance of the written line of different writing tablets with different cell gaps With Adapted from [57].

Figure 5.28 Schematic for measuring the electro‐optic response of a cholesteric writing tablet.
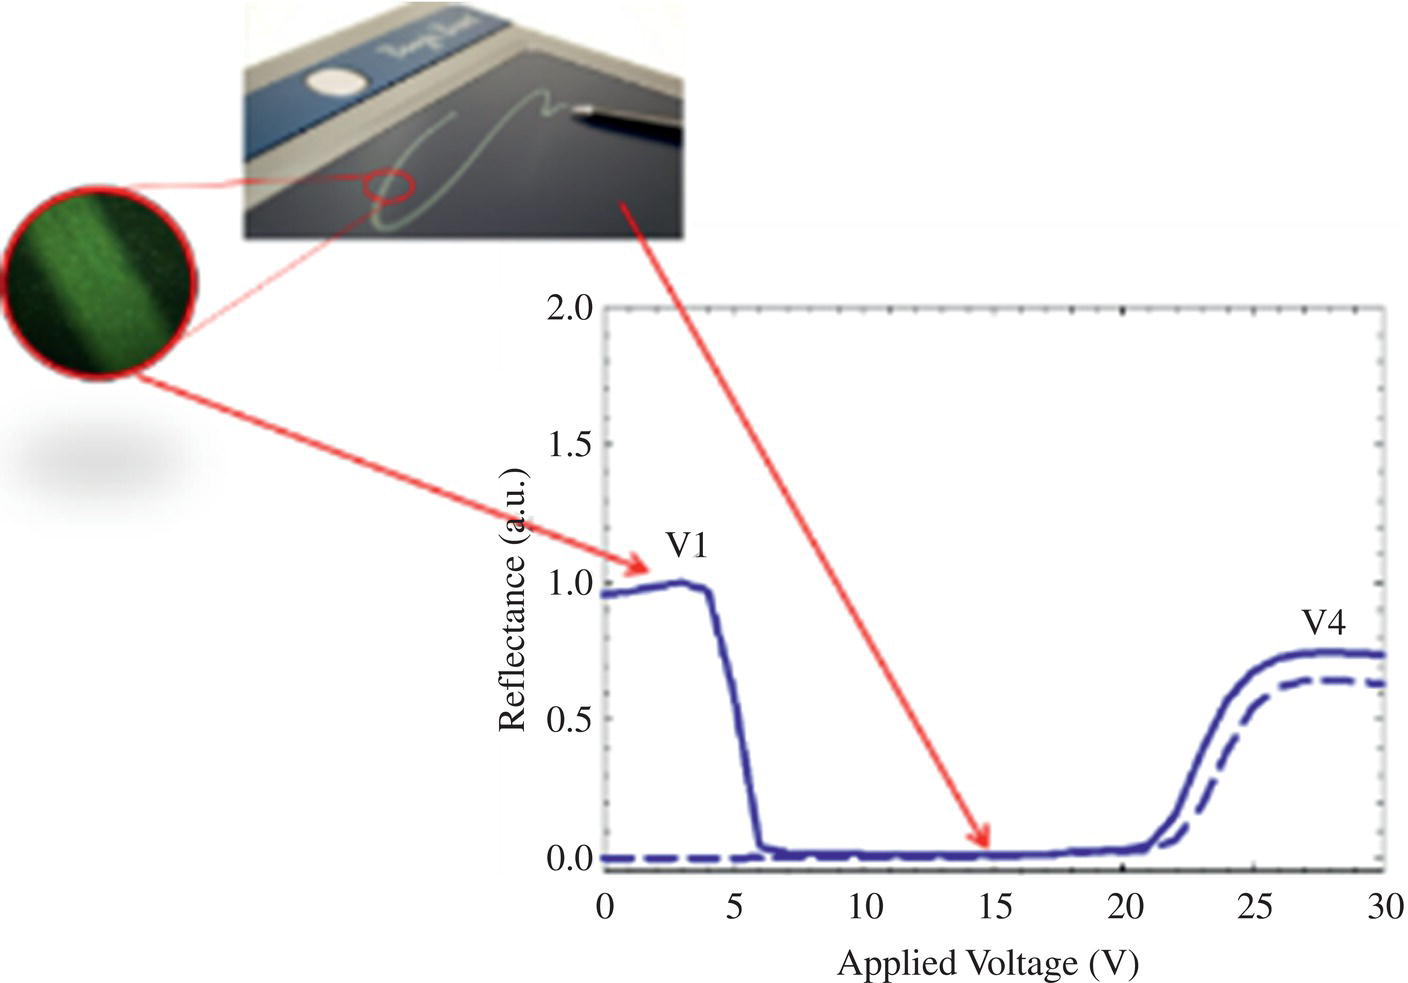
Figure 5.29 A typical electro‐optic response curve of a bistable cholesteric writing tablet, the solid line is the response of the written block and the broken line is that of the background.
5.5.4.3 Exact Erase
The writing tablets described above are single‐pixel devices; that is, the same electrodes are shared over the whole writing area. Therefore, the whole tablet is erased. It is possible to erase a portion of the tablet to erase minor mistakes, as shown in Figure 5.30. This type of erasing takes advantage of the pressure from the stylus that locally changes the cell gap from the nominal d1 to a reduced d2, as shown in Figure 5.31. This reduction in cell gap and the flow of the liquid changes the electro‐optic response in that area of pressure Figure 5.32 indicates that there is a selective erase voltage, VEE, where the reflectivity of the written image, RW, is maximized and reflectivity of the erased image, RE, is minimized. Beyond that range, it is possible to fully erase the display using, for example, voltage VFE without the need for eraser pressure [59].
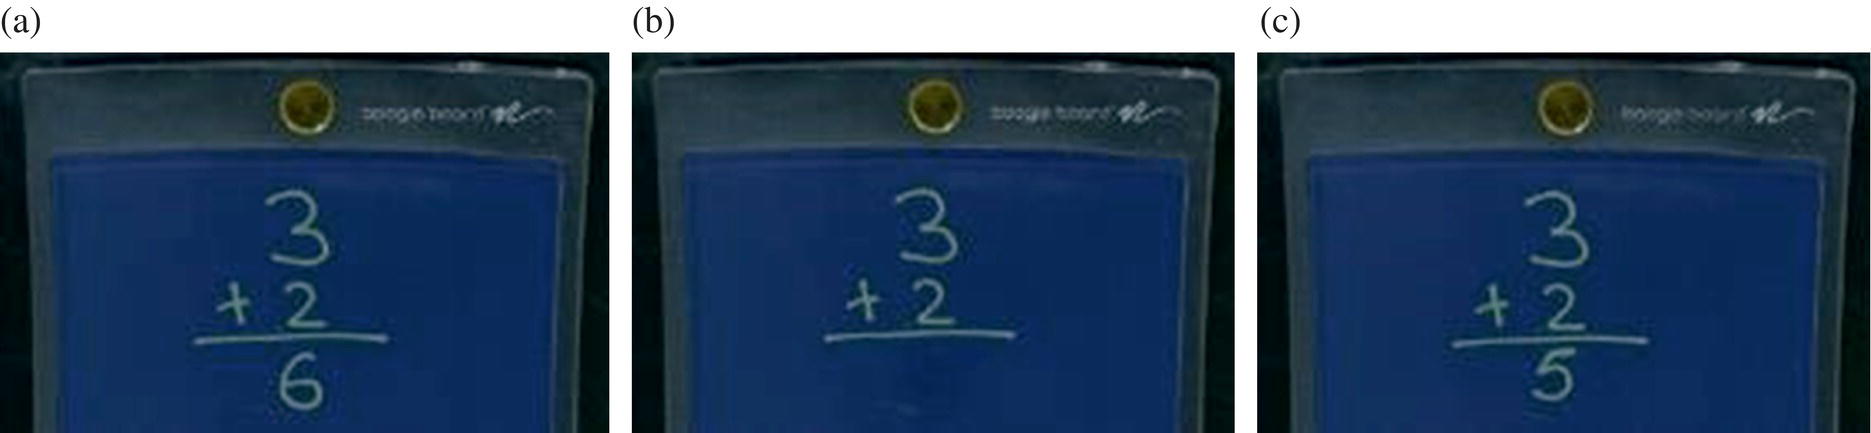
Figure 5.30 Example of exact erase. (a) Original writing (b) Exact Erase (c) corrected writing.

Figure 5.31 Cross section of a writing tablet showing nominal cell gap, d1, and reduced cell gap, d2, from stylus pressure.
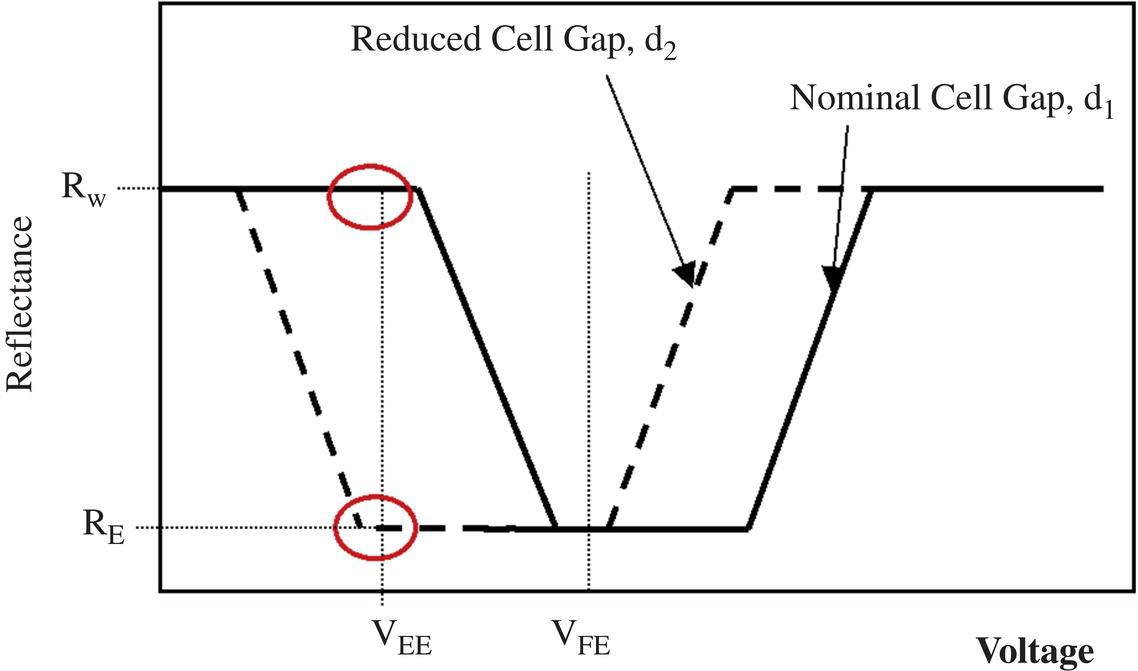
Figure 5.32 Idealized illustration of the EO curves for the regions with nominal cell gap d1 and reduced cell gap d2.
5.5.4.4 Writing Reliability
Unlike paper, writing tablets have to survive numerous writings during the life of the device. It would be unacceptable, for example, if the writing were illegible or altered due to previous writing. To develop a reliability test, the writing profiles of 10 individuals writing on cholesteric writing tablets were captured using a digitizer behind the tablet [60, 61].
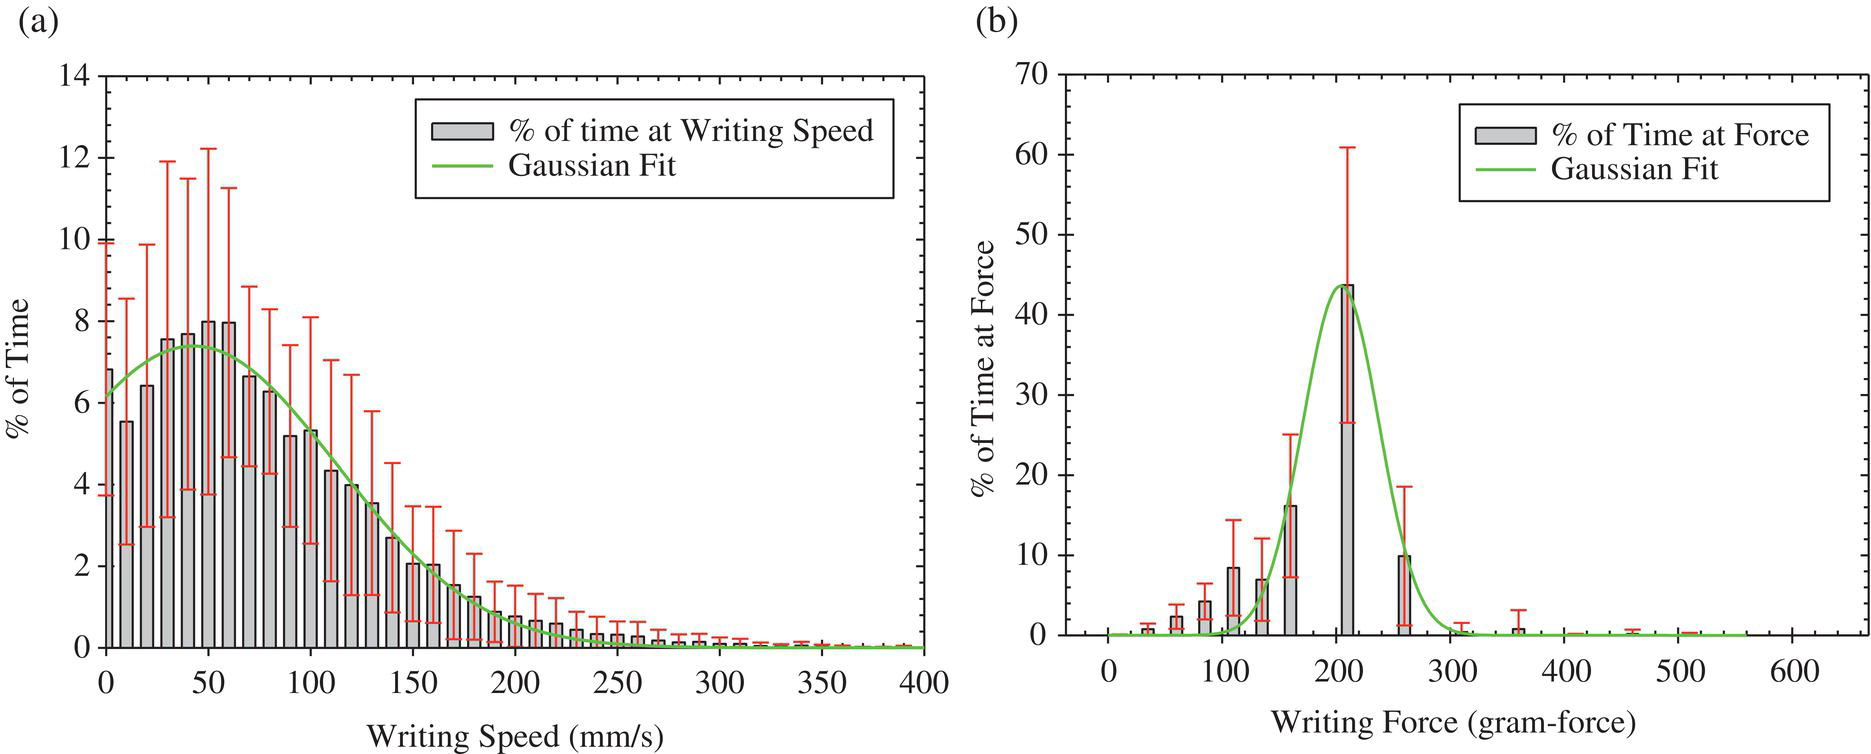
Figure 5.33 Histograms of humans writing on a writing tablets (a) writing speed and (b) writing force.
From this study (Figure 5.33), the average writing speed is 65 ± 50 mm/s, and the average writing force is 205 ± 35 g‐force. Further analysis of the data shows that,, individuals only write faster than the above averages 55% of the time and only about 17% of the time at speeds greater than 115 mm/s. They also only write with forces above average about 12% of the time. The average maxima of the writing speeds and forces were also found. The average maximum writing speed is 320 ± 149 mm/s, about 5 times higher than the average writing speed above. The average maximum writing force is 390 ± 920 g‐force, which is about 2 times higher than the average writing force above.
With these results, a writing test and pattern were developed (Figure 5.34a). The pattern was chosen to have some repetition to accelerate wear. The writing test is done using a robot that normally holds a stylus with a 150‐gramg force attached and writing at a nominal velocity of 63 ± 33 mm/s. Using these parameters and even higher forces, writing tablets show remarkable robustness, especially at typical writing forces, as shown in Figure 5.35.
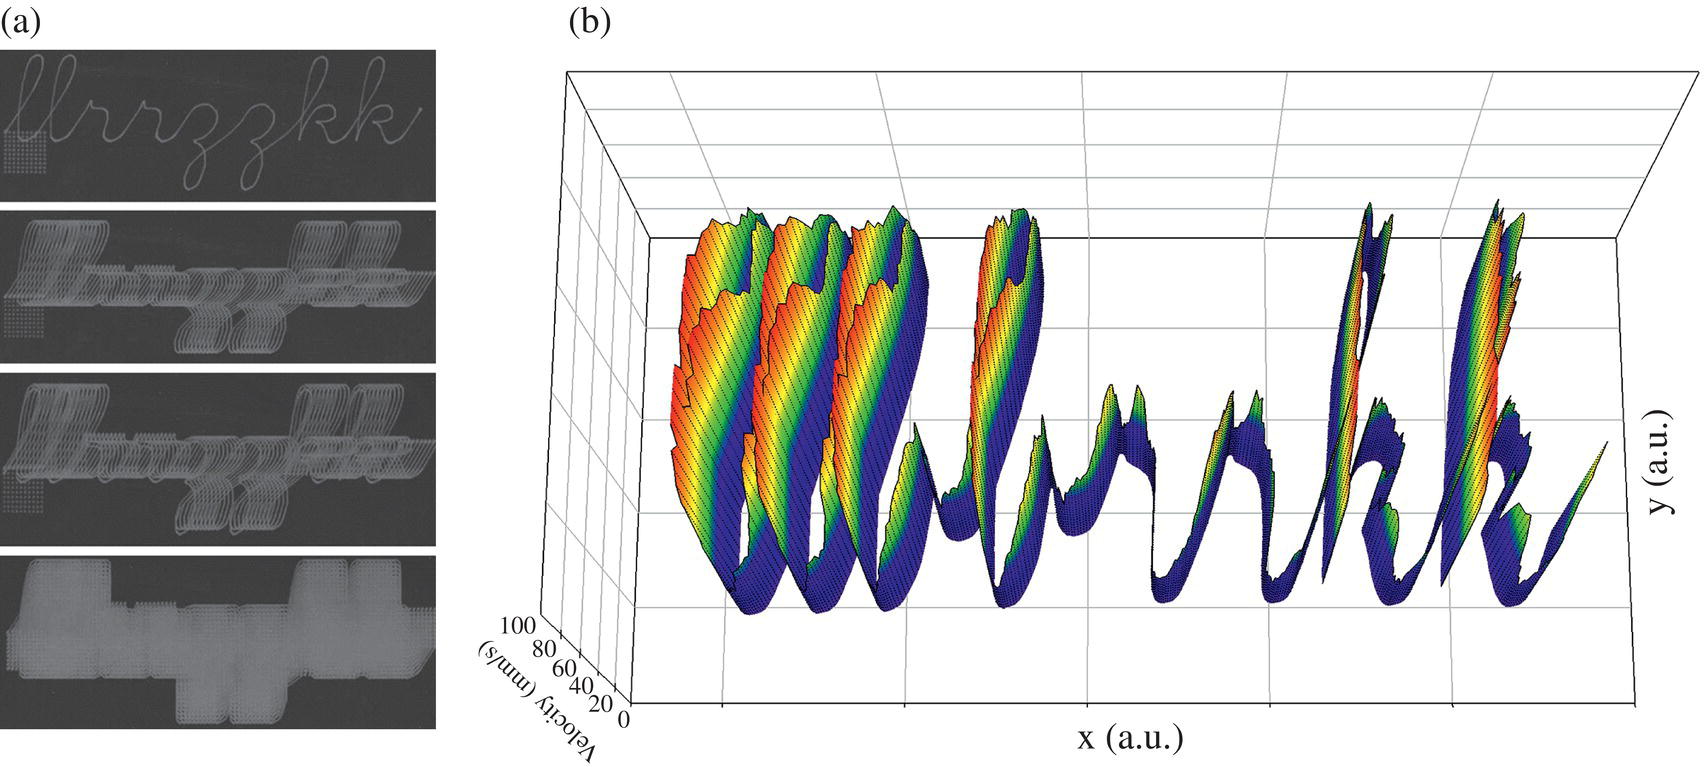
Figure 5.34 (a) Writing pattern designed for reliability testing. (b) Instantaneous velocity of the writing.

Figure 5.35 Wear points of writing tablets written on repeatedly with by a robot with increasing force. The points at the lowest force (Open Symbols) are the current iteration of the test, and not a wear point.
5.5.5 Semi‐Transparent Writing Tablets
Reducing the absorption of the light absorbing layer behind the writing tablet allowed for a new use model for displays. Figure 5.36 shows writing tablets made with absorbing layers of varying degrees of transparency. Note that even with a bright reflector behind the display, the contrast of writing in the portion of the display with 50% absorption is surprisingly high. To construct the optimal semitransparent eWriter, there are multiple parameters that need to be optimized. These parameters include the color and transmission of the absorbing layer, the haze and clarity of the liquid crystal layer in the Focal conic state, and the transmission, haze, and clarity of the substrates used to make the display [62].
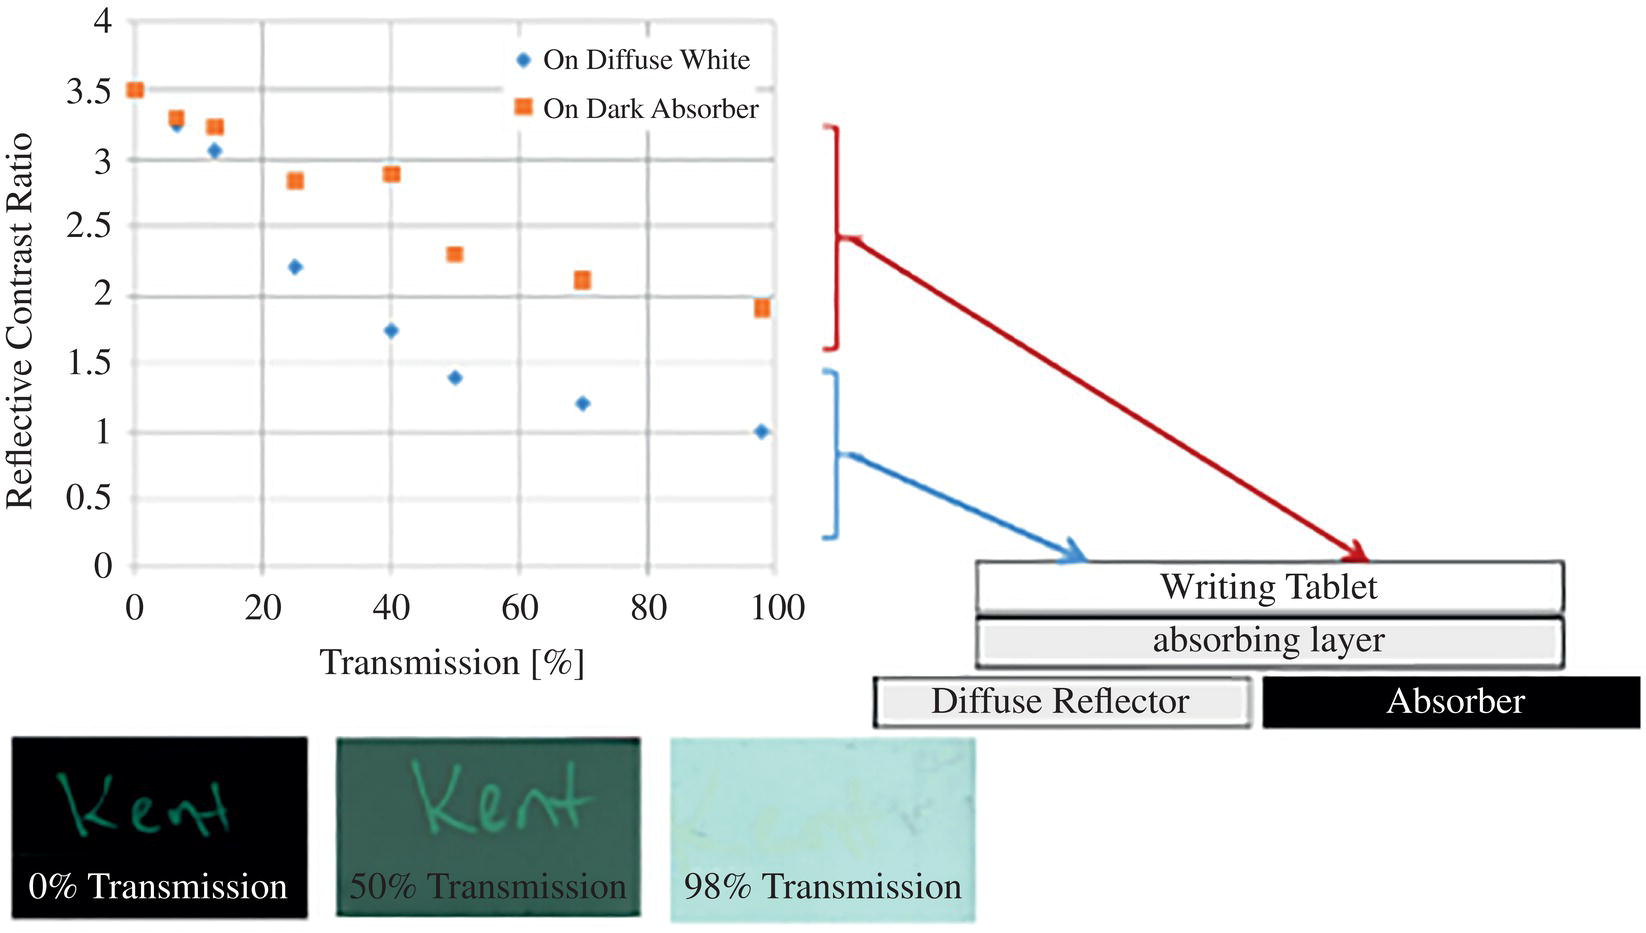
Figure 5.36 The change in contrast ratio of writing tablets made with absorbing layers with varying degrees of transparency.
The color of the absorbing layer is usually a matter of preference as almost any color can be selected as long as there is sufficient color difference between the color reflected by the written Planar texture of cholesteric liquid crystal and the color of the absorber, as shown in Figure 5.37.
An adequately designed semi‐transparent writing tablet has high contrast in both reflection and transmission mode and has high clarity in transmission mode. This allows one to view objects behind the eWriter, while in use. With these properties, a semi‐transparent writing tablet can be used as a stand‐alone tablet and an electronic tracing paper, as shown in Figure 5.38. When coupled to another display, say an eReader, the writing tablet can be used to fill in forms harnessing its excellent writing experience, as shown in Figure 5.39.
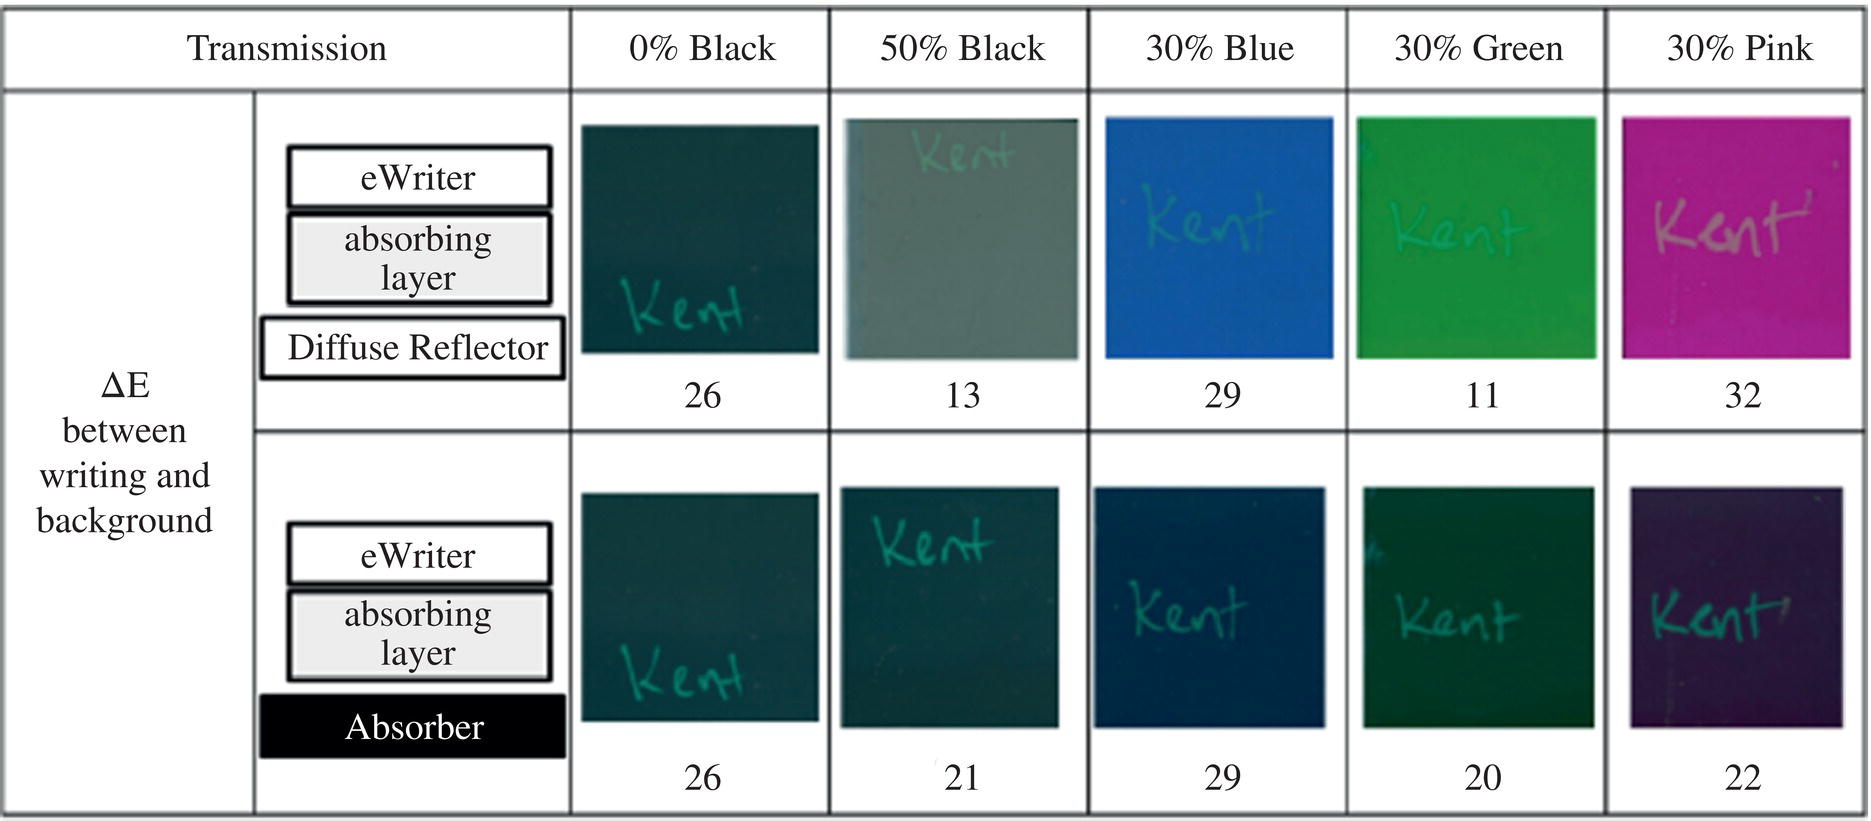
Figure 5.37 Color contrast of semitransparent writing tablets as quantified by color difference ΔE from the 1976 CIE L*a*b* Space.

Figure 5.38 Semi‐transparent writing tablet used in tracing mode (left) and writing mode (right).

Figure 5.39 A semi‐transparent display coupled to an eReader display.
5.5.6 Multi‐Colored Writing
Just as the semi‐transparent writing tablet above replaces tracing paper, it is possible to make a writing tablet that mimics better scratch art paper. Scratch‐art paper reveals hidden patterns and colors after a messy black wax coating is scratched off. The writing tablet has a uniform background that shows bright iridescent colors that change across the writing surface. The writing surface is the color of the absorbing background until written on, at which time the color of the writing will depend on the color reflected by the cholesteric liquid crystal layer and the absorbing background at that particular writing location, as shown in Figure 5.40.
To fabricate this writing tablet, the same encapsulation technique described earlier is used to place two or more dispersions of cholesteric liquid crystals that are tuned to reflect different colors next to each other in the same layer, as shown in Figure 5.41. Note that the electrodes are shared among the colors Therefore, to erase the written image, the electro‐optic response curves need to be measured for each color region. With this data, a voltage is chosen so that when applied, no matter what the original state, written, or unwritten, the field will erase all the regions of tablet to the Focal conic state [63].
5.5.7 Large Format Writing Surfaces
Bistable cholesteric liquid crystal writing tablets can be scaled up to large size formats. Some approaches involved tiling two or more panels together to allow for ease and economy of manufacturing while providing erase of the individual panels as detailed in reference [64]. Other approaches shown in Figure 5.42 are made from a single panel with one button to erase the whole single 55‐in. diagonal writing surface. As it is a low‐power device, it only needs 4 batteries to last over 50 000 erases, allowing for ease of installation and mobility. The materials and cure conditions of the panel are chosen so that the response to stylus pressure creates marks bright and wide that can be read across a room, making it an ideal collaboration tool.
Figure 5.40 A writing tablets revealing multiple colors. The one on the left has an opaque absorber while the right is semi‐transparent.
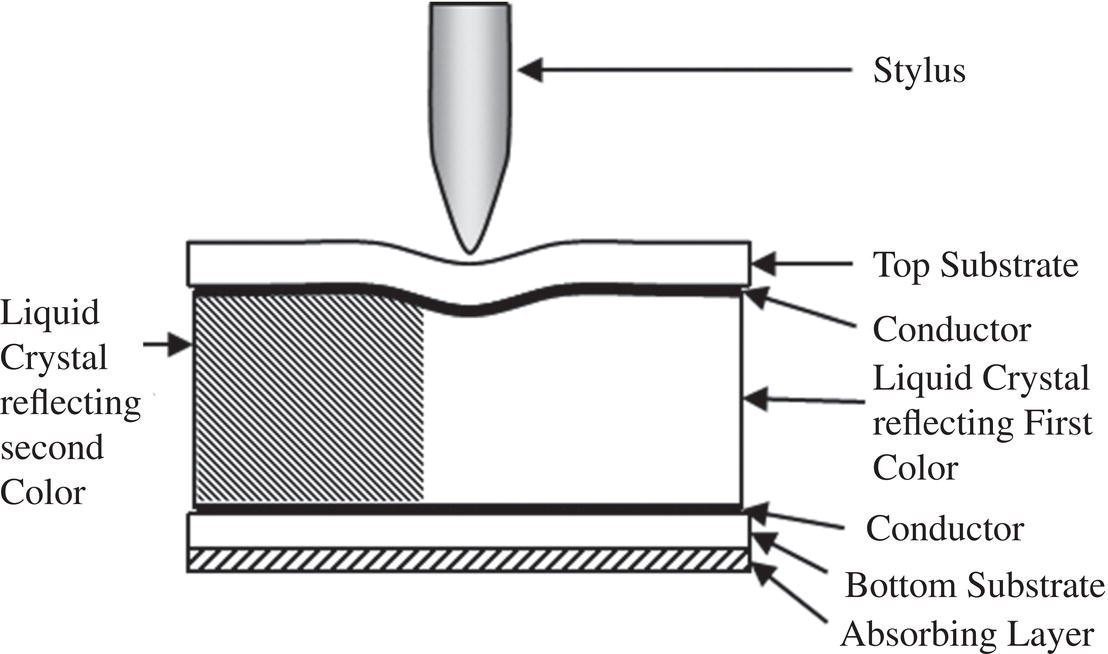
Figure 5.41 A cross section of the writing tablet revealing multiple colors.
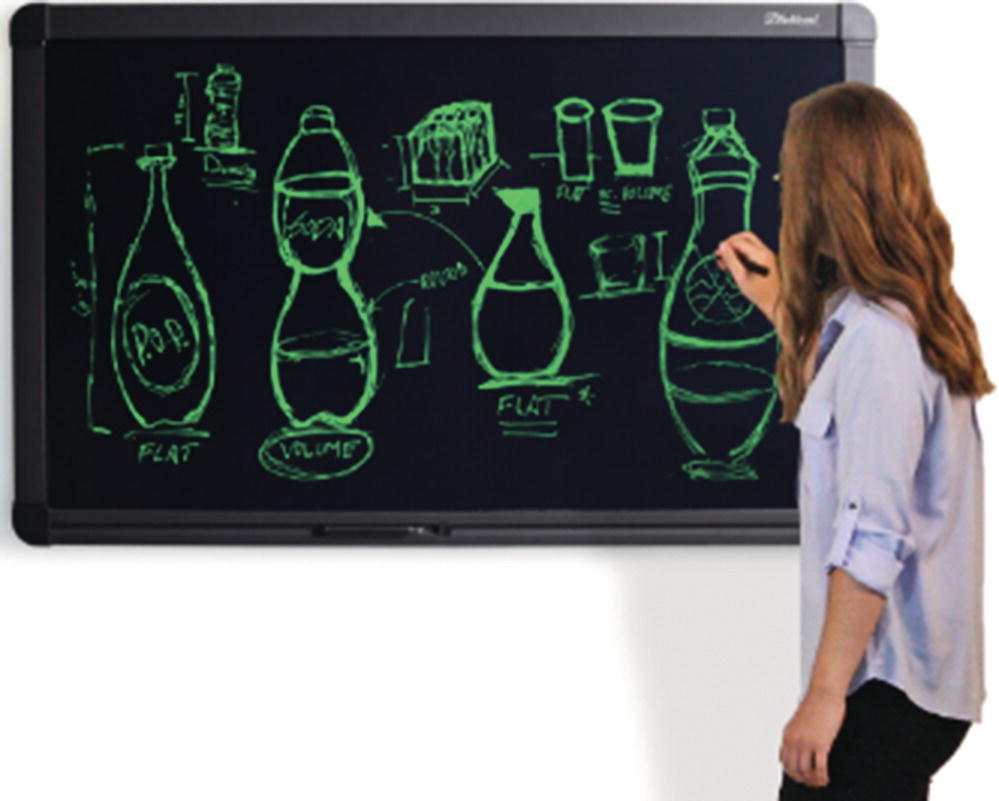
Figure 5.42 55‐in. diagonal bistable writing tablet.
5.5.8 Saving the Written Image
There are many methods of capturing the writing on the writing tablet. The simplest is by simply taking a photograph of the written image; the surface of the device usually has an antiglare coating that allows for very good camera capture. A resistive touch panel can also be placed behind the writing tablet to capture the writing. This method works well with smaller devices, but larger panels' palm rejection is an issue. Using EMR digitizers, one can eliminate this issue as the digitizer can distinguish between touch and pen inputs.
The most elegant and effective way of capturing the writing is placing a print with location information encoded into it behind a semi‐transparent writing tablet and using a pen with a camera to read the location code. The writing tablet being transparent to IR allows the camera to read the code with ease with no loss in positional information. The camera can be connected to a mobile device to share the captured image as shown in Figure 5.43.

Figure 5.43 Capturing the written image using dot/dash encoded print behind a semitransparent writing tablet.
5.6 Conclusions
Cholesteric liquid crystals are very well suited for various ePaper applications as they have all the properties needed, including low power consumption, very small bill of materials, ability to use birefringent substrates, bistability, ruggedness, flexibility, and scalability. The displays made from ChLC's can be passively driven, withstand harsh outdoor conditions, made into readers and billboards. They can be put into wallets or used to change the color of a phone case.
Writing tablets are a very successful example of the use of ChLC displays that cater to writing as an undeniably essential human activity complementary to reading and still very much dependent on the use of paper. The simple but elegant use of ChLCs results from years of evolutionary and revolutionary developments that resulted in the practical, manufacturable, and low‐cost variety of products currently in the market that has been sold by the millions.
The study of the phenomena involved in the writing process, understanding the effect of ChLC flow in confined complex geometries, is still an intriguing topic ready to welcome the academic and industrial interest to keep propelling innovations around these fascinating materials.
References
- 1 de Gennes, P.G. and Prost, J. (1993). The Physics of Liquid Crystals, 2e. Oxford: Clarendon.
- 2 Venkataraman, N., Magyar, G., Montbach, E. et al. (2009). Thin flexible photosensitive cholesteric displays. J. Soc. Inf. Disp. 17 (10): 869–873. https://doi.org/10.1889/JSID17.10.869.
- 3 Bahadur, B. (ed.) (1992). Liquid Crystals: Applications and Uses, 3e. World Scientific p. 424.
- 4 Booth, C.J. (1998). Chiral nematic liquid crystals: the synthesis of chiral nematic liquid crystals. In: Handbook of Liquid Crystals, 303–334. https://doi.org/10.1002/9783527620555.ch4a.
- 5 Wu, S.‐T. and Yang, D. (2001). Reflective Liquid Crystal Displays. Wiley.
- 6 Lehman (1889). Uber Fliessende Krystalle. Z. Phys. Chem.. Stoechiom, Verwandtschafsl, 4 (62).
- 7 Dierking, I. (2003). The nematic and cholesteric phases. Textures of Liquid Crystals. 51–74. https://doi.org/10.1002/3527602054.ch5.
- 8 Yang, D.‐K., West, J.L., Chien, L.‐C., and Doane, J.W. (1994). Control of reflectivity and bistability in displays using cholesteric liquid crystals. J. Appl. Phys. 76 (2): 1331. https://doi.org/10.1063/1.358518.
- 9 Blinov, L.M. and Chigrinov, V.G. (1994). Electrooptic Effects in Liquid Crystals. Springer‐Verlag.
- 10 Lavrentovich, O.D. (2020). Electromagnetically tunable cholesterics with oblique helicoidal structure [invited]. Opt. Mater. Express 10 (10): 2415. https://doi.org/10.1364/ome.403810.
- 11 Froyen, A.A.F., Wübbenhorst, M., Liu, D., and Schenning, A.P.H.J. (2021). Electrothermal color tuning of cholesteric liquid crystals using interdigitated electrode patterns. Adv. Electron. Mater. 7 (2): doi: 10.1002/aelm.202000958.
- 12 Mulder, D.J., Schenning, A.P.H.J., and Bastiaansen, C.W.M. (2014). Chiral‐nematic liquid crystals as one dimensional photonic materials in optical sensors. J. Mater. Chem. C 2 (33): 6695–6705. https://doi.org/10.1039/c4tc00785a.
- 13 Huang, Y., Zhou, Y., Doyle, C., and Wu, S.‐T. (2006). Tuning the photonic band gap in cholesteric liquid crystals by temperature‐dependent dopant solubility. Opt. Express 14 (3): 1236. https://doi.org/10.1364/oe.14.001236.
- 14 Göbl‐Wunsch, A. and Heppke, G. (1979). Temperaturfunktionen der durch Mehrfachdotierung mit chiralen Verbindungen in einer nematischen Phase induzierten Helixganghöhe. Zeitschrift fur Naturforsch. Sect. A J. Phys. Sci. 34 (5): 594–599. https://doi.org/10.1515/zna‐1979‐0512.
- 15 Schadt, M. (1997). Liquid crystal materials and liquid crystal displays. Annu. Rev. Mater. Sci. 27 (1): 305–379. https://doi.org/10.1146/annurev.matsci.27.1.305.
- 16 Chandrasekhar, S. (1992). Liquid Crystals. New York: Cambridge University Press.
- 17 Yang, D.K., Huang, X.Y., and Zhu, Y.M. (1997). Bistable cholesteric reflective displays: materials and drive schemes. Annu. Rev. Mater. Sci. 27 (1): 117–146. https://doi.org/10.1146/annurev.matsci.27.1.117.
- 18 Doane, J.W. and Khan, A. (2005). Cholesteric liquid crystals for flexible displays. In: Flexible Flat Panel Displays, 331–354. https://doi.org/10.1002/0470870508.ch17.
- 19 Doane, J.W. (1990). Polymer dispersed liquid crystal displays. In: Liquid Crystals – Applications and Uses (ed. B. Bahadur), 361–395. World Scientific.
- 20 Schneider, T., Montbach, E., Davis, D. et al. (2008). UV Cured Flexible Cholesteric Liquid Crystal Displays, vol. LCD, pp. 2–12.
- 21 Kitzerow, H.‐S. and Crooker, P.P. (1993). UV‐cured cholesteric polymer‐dispersed liquid crystal display. J. Phys. II Fr. 3 (5): 719–726.
- 22 Echeverri, M. (2012). Phase Diagram Approach to Fabricating Electro‐Active Flexible Films: Highly Conductive, Stretchable Polymeric Solid Electrolytes and Cholesteric Liquid Crystal Flexible Displays.
- 23 Crawford, G.P. (2005). Encapsulated liquid crystal materials for flexible display applications. In: Flexible Flat Panel Displays (ed. G.P. Crawford), 313–330. Wiley.
- 24 Yang, D.K. (2006). Flexible bistable cholesteric reflective displays. IEEE/OSA J. Disp. Technol. 2 (1): 32–37. https://doi.org/10.1109/JDT.2005.861595.
- 25 Schneider, T., Nicholson, F., Khan, A. et al. (2005). Flexible encapsulated cholesteric LCDs by polymerization induced phase separation. SID Symp. Dig. Tech. Pap. 36 (1): 1568. https://doi.org/10.1889/1.2036311.
- 26 Yang, D.‐K. and Ma, R. (1999). Polymer stabilized black‐white cholesteric reflective display. no. 19.
- 27 Miller, N. et al. (2003). 54.1: Ultra low power black and white cholesteric display with COG and solar array. SID Symp. Dig. Tech. Pap. 34: doi: 10.1889/1.1832557.
- 28 Broer, D.J., Lub, J., and Mol, G.N. (1995). Wide‐band reflective polarizers from cholesteric polymer networks with a pitch gradient. Nature 378 (6556): 467–469. https://doi.org/10.1038/378467a0.
- 29 Li, Y., Zhan, T., and Wu, S.‐T. (2020). Flat cholesteric liquid crystal polymeric lens with low f‐number. Opt. Express 28 (4): 5875. https://doi.org/10.1364/oe.387942.
- 30 Li, Y., Zhan, T., Yang, Z. et al. (2021). Broadband cholesteric liquid crystal lens for chromatic aberration correction in catadioptric virtual reality optics. Opt. Express 29 (4): 6011. https://doi.org/10.1364/oe.419595.
- 31 Tondiglia, V.T., Natarajan, L., Bailey, C.A. et al. (2011). Electrically induced bandwidth broadening in polymer stabilized cholesteric liquid crystals. J. Appl. Phys. 110 (5): 53109. https://doi.org/10.1063/1.3632068.
- 32 Montbach, E., Pishnyak, O., Lightfoot, M. et al. (2009). 4.2: Flexible electronic skin display. SID Symp. Dig. Tech. Pap. 40 (1): 16. https://doi.org/10.1889/1.3256657.
- 33 Helfrich, W. (1971). Electrohydrodynamic and dielectric instabilities of cholesteric liquid crystals. J. Chem. Phys. 55 (2): 839–842. https://doi.org/10.1063/1.1676151.
- 34 Clinton Braganza, D.‐K. Y. (2005). Dynamics of the Growth of Twist Fingers in Cholesteric Liquid Crystals. APS March Meeting. http://meetings.aps.org/link/BAPS.2005.MAR.B37.9.
- 35 Yang, D.K., Doane, J.W., Yaniv, Z., and Glasser, J. (1994). Cholesteric reflective display: drive scheme and contrast. Appl. Phys. Lett. 64 (15): 1905. https://doi.org/10.1063/1.111738.
- 36 Huang, X., Yang, D., and Doane, J.W. (1995). Transient dielectric study of bistable reflective cholesteric displays and design of rapid drive scheme. Appl. Phys. Lett. 67 (9): 1211–1213. https://doi.org/10.1063/1.115010.
- 37 Zhu, Y.M. and Yang, D.‐K. (1998). P‐82: Cumulative drive schemes for bistable reflective cholesteric LCDs. SID Symp. Dig. Tech. Pap. 29 (1): 798–801. https://doi.org/10.1889/1.1833882.
- 38 Khan, A., Miller, N., Ernst, T. et al. (2004). 22.4: Novel drive techniques and temperature compensation mechanisms in reflective cholesteric displays. SID Symp. Dig. Tech. Pap. 35 (1): 886–889. https://doi.org/10.1889/1.1821411.
- 39 Braganza, C., Bowser, M., Krinock, J. et al. (2011). 30.2: Single layer full color cholesteric display. SID Symp. Dig. Tech. Pap. 42 (1): 396–399. https://doi.org/10.1889/1.3621334.
- 40 Liang, C.‐C., Liao, Y.C., Chen, C.J. et al. (2011). 30.4: A low cost, full color cholesteric LCD with low voltage and crosstalk‐free drive scheme. SID Symp. Dig. Tech. Pap. 42 (1): 404–407. https://doi.org/10.1889/1.3621336.
- 41 Chien, L. ‐C. and Doane, J. W. (1997). Pixelized Liquid Crystal Display Materials Including Chiral Materal Adopted To Change Its Chrality Upon Photo‐Irradation. US Patent 5,668,614.
- 42 Jin, Y., Hong, Z., Jeon, C.W. et al. (2014). A novel flexible color display using two‐step UV exposure method. Mol. Cryst. Liq. Cryst. 595 (1): 83–91. https://doi.org/10.1080/15421406.2014.917792.
- 43 Chin, C.‐L., Cheng, K.‐L., Wang, Y.‐R. et al. (2012). 40.2: Novel Phototunable chiral materials for single layer color cholesteric display. SID Symp. Dig. Tech. Pap. 43 (1): 548–550. https://doi.org/10.1002/j.2168‐0159.2012.tb05838.x.
- 44 Kim, J.Y., Cho, C., Palffy‐Muhoray, P. et al. (1993). Polymerization‐induced phase separation in a liquid crystal‐polymer mixture. Phys. Rev. Lett. 71 (14): 2232–2236.
- 45 Nwabunma, D., Chiu, H., Kyu, T., and Introduction, I. (2000). Theoretical investigation on dynamics of photopolymerization‐induced phase separation and morphology development in nematic liquid crystal/polymer mixtures. Chem. Phys. 113 (15).
- 46 Nwabunma, D., Kim, K.J., Lin, Y. et al. (1998). Phase diagram and photopolymerization behavior of mixtures of UV‐curable multifunctional monomer and low molar mass nematic liquid crystal. Macromolecules 9297 (98): 6806–6812.
- 47 Duran, H., Meng, S., Kim, N. et al. (2008). Kinetics of photopolymerization‐induced phase separation and morphology development in mixtures of a nematic liquid crystal and multifunctional acrylate. Polymer (Guildf). 49 (2): 534–545. https://doi.org/10.1016/j.polymer.2007.11.039.
- 48 Maschke, U. and Coqueret, X. (2000). Phase diagrams and morphology of polymer dispersed liquid crystals based on nematic‐liquid‐crystal – monofunctional‐acrylate mixtures. Phys. Rev. E 62 (2): 2310–2316.
- 49 Soule, E.R. and Rey, A.D. (2019). Chapter 2: Phase diagrams, phase separation mechanisms and morphologies in liquid crystalline materials: principles and theoretical foundations. In: RSC Soft Matter, vol. 2019, no. 8,, 19–36. Royal Society of Chemistry.
- 50 Gregg, A., York, L., and Mark, S. (2005). Roll‐to‐roll manufacturing of flexible displays. In: Flexible Flat Panel Isplays (ed. G.P. Crawford), 409–445. New York: Wiley.
- 51 Montbach, E. and Davis, D. (2018). Roll‐to‐roll manufacturing of flexible displays. In: Roll‐to‐Roll Manufacturing: Process Elements and Recent Advances (ed. J. Greener, G. Pearson and M. Cakmak), 285–323. Wiley.
- 52 Pochan, J.M. and Marsh, D.G. (1972). Mechanism of shear‐induced structural changes in liquid crystals‐cholesteric mixtures. J. Chem. Phys. 57 (3): 1193–1200. https://doi.org/10.1063/1.1678376.
- 53 Wiese, O., Marenduzzo, D., and Henrich, O. (2016). Microfluidic flow of cholesteric liquid crystals. Soft Matter 12 (45): 9223–9237. https://doi.org/10.1039/C6SM01290F.
- 54 Chau, T., Ji, J., Tam, C., and Schwellnus, H. (2006). A novel instrument for quantifying grip activity during handwriting. Arch. Phys. Med. Rehabil. 87 (11): 1542–1547. https://doi.org/10.1016/j.apmr.2006.08.328.
- 55 Hsu, H.M., Lin, Y.C., Lin, W.J. et al. (2013). Quantification of handwriting performance: development of a force acquisition pen for measuring hand‐grip and pen tip forces. Meas. J. Int. Meas. Confed. 46 (1): 506–513. https://doi.org/10.1016/j.measurement.2012.08.008.
- 56 Caligiuri, M.P., Teulings, H.L., Dean, C.E. et al. (2010). Handwriting movement kinematics for quantifying extrapyramidal side effects in patients treated with atypical antipsychotics. Psych. Res. 177 (1–2): 77–83. https://doi.org/10.1016/j.psychres.2009.07.005.
- 57 Montbach, E., Khan, A. A., Echeverri, M., and Braganza, C. (2016). Enhanced brightness ewriter device, US10287503B2, November.
- 58 St, W.D., John, W.J., Fritz, Z.J.L., and Yang, D.K. (1995). Bragg reflection from cholesteric liquid crystals. Phys. Rev. E. 51 (2): 1191–1198. https://doi.org/10.1103/PhysRevE.51.1191.
- 59 Braganza, C., Lightfoot, M., Echeverri, M. et al. (2017). 38‐2: eWriter with select erase functionality. SID Symp. Dig. Tech. Pap. 48 (1): 539–541. https://doi.org/10.1002/sdtp.11697.
- 60 Braganza, C., Schlemmer, M., DeMiglio, A. et al. (2013). P.70: Durability and reliability of eWriters. SID Symp. Dig. Tech. Pap. 44 (1): 1254–1256. https://doi.org/10.1002/j.2168‐0159.2013.tb06460.x.
- 61 Braganza, C., Lightfoot, M., Schlemmer, M. et al. (2014). 54.3: Human and mechanical writing performance of eWriters. SID Symp. Dig. Tech. Pap. 45 (1): 789–792. https://doi.org/10.1002/j.2168‐0159.2014.tb00207.x.
- 62 Braganza, C., Montbach, E., Khan, A. et al. (2015). 23.3: Flexible Semitransparent eWriter Displays. SID Symp. Dig. Tech. Pap. 46 (1): 334–337. https://doi.org/10.1002/sdtp.10239.
- 63 Braganza, C., Echeverri, M., Kammer, K. et al. (2016). P‐110: eWriter featuring color burst technology. SID Symp. Dig. Tech. Pap. 47 (1): 1539–1542. https://doi.org/10.1002/sdtp.10994.
- 64 Montbach, E., Krinock, J., Liu, L. et al. (2013). Large area, seamlessly tiled, flexible eBoard. Dig. Tech. Pap. SID Int. Symp. 44 (1): 1250–1253. https://doi.org/10.1002/j.2168‐0159.2013.tb06459.x.