1
The Rise, and Fall, and Rise of Electronic Paper
Paul S. Drzaic1, Bo‐Ru Yang2, and Anne Chiang3
1 Apple, Inc
2 Professor, School of Electronics and Information Technology, State Key Laboratory of Optoelectronic Materials and Technologies, Guangdong Province Key Laboratory of Display Material and Technology, Sun Yat‐Sen University, Guangzhou, China
3 Principal, Chiang Consulting, Cupertino, CA
1.1 Introduction
For over a thousand years, before the world of electronics, paper was the dominant medium for people to share written and later printed information. People become familiar with paper at an early age, and there is an enormous worldwide infrastructure for the production and distribution of printed material. Despite this huge built‐in advantage, paper and print now fall short in providing for many demands of modern life. The past few decades have seen the emergence of electronic networks that transmit vast amounts of information, on‐demand, for use in various ways. Electronic displays are a necessary part of this infrastructure, converting bits to photons and serving as the final stage of transmitting information to people.
Over the years, several electronic display technologies have waxed and waned; cathode ray tubes, plasma displays, and super twisted nematic (STN) displays come to mind. A few technologies are dominant; backlit active‐matrix liquid crystal displays, active matrix organic light‐emitting diode (OLED) displays, and inexpensive, passively addressed liquid crystal displays. Along the way, tens of different types of display technologies have been invented and explored, but ultimately have failed to catch on. A few displays have found a home in niche products and promise greater future application. Reflective displays, particularly electronic paper, are examples that have managed to find a place in the display ecosystem, with unique applications best served by these technologies.
This book aims to update on some of the most exciting new areas in electronic paper technology. This introductory chapter focuses primarily on electrophoretic displays (EPDs) and how they became synonymous with electronic paper. The story starts in the early 1970’s, with the proposal and first demonstration of the electrophoretic movement of charged particles to make an optical effect. After intense effort, the technology was mostly abandoned, only to be resurrected by a start‐up company, E Ink. Several key, and rather improbable inventions had to be made to develop a technology competitive to the dominant liquid crystal technology. Finally, the right application and ecosystem, the Amazon Kindle electronic book, was necessary to cement commercial success.
The field of reflective displays is very rich. The many other chapters in this book and recent reviews [1, 2] provide a wealth of resources for understanding the many technologies that have been developed in the quest to achieve a paper‐like display. In this chapter, we will examine the following:
- A description of print‐on‐paper and how the optics of real paper compare with potential electronic paper competitors.
- A hierarchical summary of the different technical approaches for reflective displays.
- A detailed look at the historical development of EPDs, starting with the invention of the technology and ending with the introduction of the Amazon Kindle. Looking at the various developments in the context of its times, the EPD story offers some lessons in what it takes for a technology to transition from the laboratory to commercial success.
1.2 Why Electronic Paper?
Electronic paper has undoubtedly caught the imagination of the world. A Google search for electronic paper in September 2021 returns over 12 billion hits. This interest reflects people's love affair with paper as a medium for transmitting information. Yet, it is easy to recognise that printing ink onto dead trees is not easily compatible with today's networked world. What are the attributes of print‐on‐paper that make it so important?
- Paper is a reflective medium that automatically adapts to changing lighting
- Unlike most emissive displays, paper can be easily read in bright sunlight.
- The appearance of paper is relatively constant over different viewing angles, without significant shifts in luminance or color.
- Paper can be lightweight and flexible. The user can easily annotate it. with a pen or pencil.
- Paper is inexpensive
- Paper can be archived.
Nevertheless, physical paper cannot be instantly updated with information from electronic networks or easily serve as an interface with electronic devices. Today's backlit LCDs and OLED displays are ubiquitous as a means of transmitting information, but with the limitations that emissive displays possess, including eyestrain and low visibility in sunlight. Electronic paper can combine the power of electronic devices and networks with all the attributes of paper.
So what strategies can be taken to enable electronic paper? It is instructive to understand the composition and design of print‐on‐paper and see how many of these properties can be converted to something under electronic control to compete with printed media.
1.3 Brightness, Color, and Resolution
Conventional, non‐electronic paper consists of a mat of tightly pressed fibers, most commonly derived from parchment or wood pulp. The combination of fibers and embedded air pockets scatter light and provide the reflective characteristics of paper. Historically, additives to the paper pulp during fabrication have also provided glossiness, color, aid in manufacture, or other desirable characteristics (Figure 1.1).
Compared to a white optical standard, the perceived reflectivity of paper often ranges from 50–80%, but can be even higher. The whiteness or brightness of paper depends on several factors, including the density of fibers, the paper thickness, the presence of additives such as titanium dioxide, clays, or fluorescent agents, and whether the viewing surface is made glossy through calendaring and coatings. The color of light reflected from white paper may differ somewhat from a perfect reflector due to the fluorescing whiteners' presence, or some underlying color absorbance from the paper. The human eye readily accommodates for these changes, though, so the perception of consistent color and lightness of a page relative to its surroundings is easily achieved (Figure 1.2).
Print‐on‐paper consists of drops of colored ink impregnated into the paper fiber. It is straightforward to devise dyes and pigments that absorb red, green, or blue. To generate the color characteristics of print, the CMYK subtractive color system can be used (Figure 1.3). The colors in print are usually comprised of cyan (absorb red), magenta (absorb green), and yellow (absorb blue) (Figure 1.4). Black pigment (the K in CMYK) is also commonly used, as it is challenging to achieve a neutral black color by mixing cyan, magenta, and yellow.
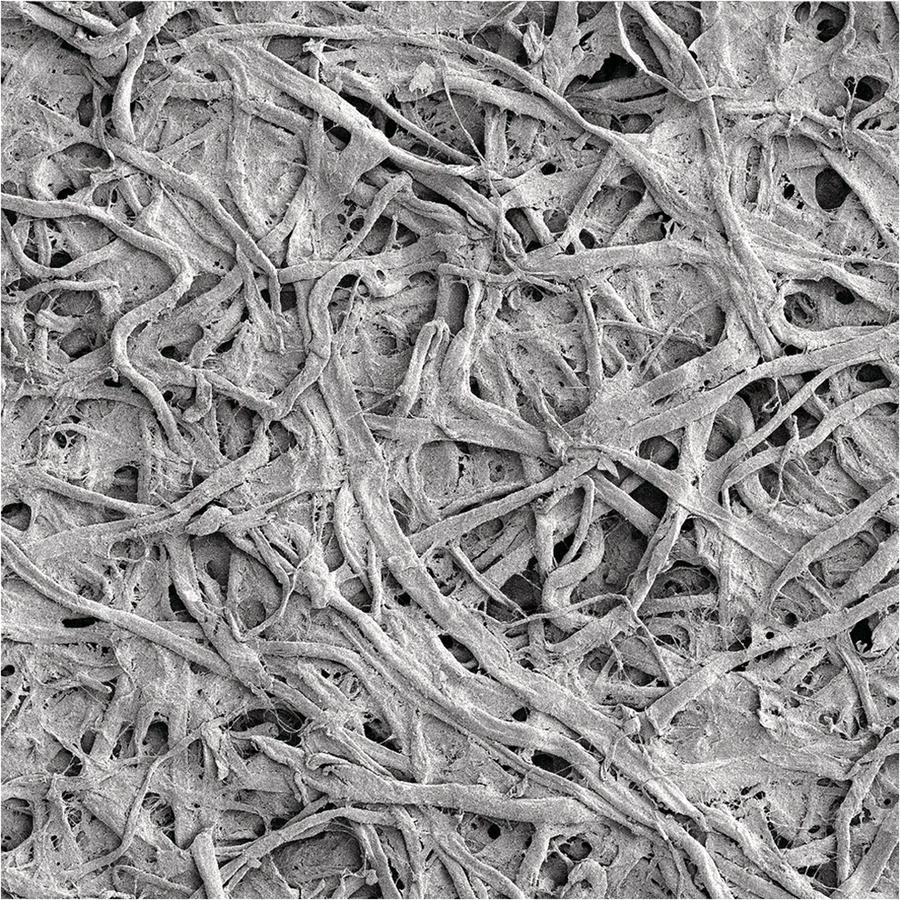
Figure 1.1 Arches 100% cotton rag paper. Scanning electron microscope image @100×.
Source: http://paperproject.org,[3] Used with permission of CJ Kazilek.
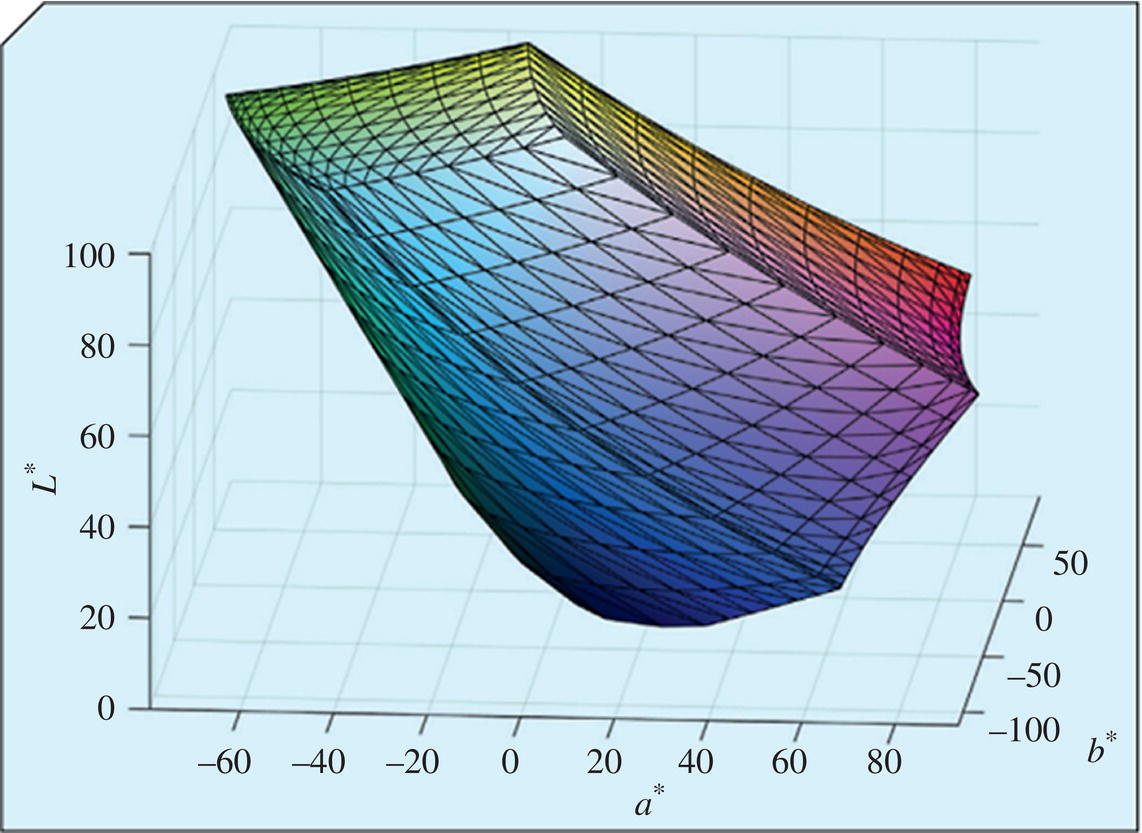
Figure 1.2 CIELAB color system [4] John Wiley & Sons.

Figure 1.3 Color separation of an image into its CMYK components, and the final printed image. The absence of a color is white.

Figure 1.4 Subtractive color mixing. Cyan and magenta overlap to make blue, cyan, and yellow overlap to make green, yellow, and magenta overlap to make red, and all three mixed together provide black.
To achieve a wider color gamut, inkjet printing may use six or more colors to print. Additionally, spot color printing can deposit specialty inks (such as fluorescent pigments) that currently have no analog in emissive displays.
Depending on the industry, a variety of different color spaces and metrics have been developed for printed and reflected color. For example, the CIE 1976 (L*a*b*) color space is widely used to measure reflective colors and print. The human perception of lightness is measured by L*, which roughly scales as the cube root as the reflected luminance level.
For color reproduction in the print industries, the SNAP standard (Specifications for Newspaper Advertising Production) and SWOP standard (Specifications for Web Offset Publications) are widely used [1]. These print standards are rarely applied to electronic displays, though the advent of colored reflective displays approaching print‐like appearance could change this situation.
Grayscale in printing is achieved using halftones (Figure 1.5). Each dot on a printed page defines an area where smaller halftone dots are printed. The more halftone dots, the deeper the color or darker the black while white is the absence of halftone dots. The smaller the dots, the higher the resolution. Print is often defined in lines per inch.″ Some examples of everyday printed objects include:
- Newspaper (monochrome) – 65–100 LPI
- Books and magazines (color) – 120–150 LPI
- Art books (color) – 175–250 LPI
- Photorealistic inkjet printer (color) – 250–300 LPI
Likewise, the resolution‐defined dot for color printing consists of multiple prints of smaller dots. The combination of different colors and black and the underlying brightness and color of the paper provide the specific color and lightness of that dot.
With inkjet printing, commercial printers can also control the size of the drop, such as achieving four different sizes (Figure 1.6). The number of achievable gray levels is a combination of the number and size of the printed dots within the equivalent printed pixel [6, 7].

Figure 1.5 Examples of halftone dots of variable size, enabling grayscale [5] / Slippens / Public Domain.
1.4 Reflectivity and Viewing Angle
An important aspect of paper is that the image printed on the page appears to have constant lightness and color irrespective of the viewing angle and lighting conditions. If the paper is glossy, there may be some glare from the surface, but that reflectance rarely interferes with the user interacting with the page. The near‐constant appearance of the printed page is representative of Lambertian reflectance. The underlying paper scatters light, impinging onto the surface from many angles and then reflected uniformly into all spatial angles. Whether the page is illuminated by a collimated source such as a light bulb in a dark room or a more uniform source such as a cloudy sky, the distribution of reflected light from the paper does not change that much. Likewise, the amount of light scattered into the viewer's eyes for a given spot on the paper is also constant with viewing angle [8].
![Schematic illustration of printed color generation through printed CMYK halftones [5] / Slippens / Public Domain.](https://imgdetail.ebookreading.net/2023/10/9781119745587/9781119745587__9781119745587__files__images__c01f006.jpg)
Figure 1.6 Printed color generation through printed CMYK halftones [5] / Slippens / Public Domain.
1.5 Translating Print‐on‐Paper into Electronic Paper
With this background, we can examine why designing an electronic display with the appearance of high‐quality print‐on‐paper is challenging.
1.5.1 Brightness
Electronic displays require a transparent front sheet as the top surface of the display. This top surface (usually plastic or glass) provides a flat dielectric interface with air and degrades the optics of electronic paper in several ways.
- A significant fraction (4–10%) of light is directly reflected off the display without interacting with the display medium. This reflected light is seen as glare and degrades the contrast of the underlying display to the viewer. This reflected light also reduces the available light scattered back to the viewer. Anti‐reflective coatings can reduce this reflected light, but with added cost and sometimes compromises in durability.
- Even if there is perfect diffuse reflectance, a significant fraction of that light will be trapped by internal reflectance at the display‐air interface [9]. For an EPD where the dielectric phase is somewhere in the range of 1.38–1.45, the maximum amount of light that can be outcoupled from a white scattering layer, with no other absorptive losses, is predicted to be no more than 65%. These incoming and outcoupling losses limit the potential brightness of an embedded Lambertian scatterer within an electronic paper display.
There are strategies to improve the luminance of scattering‐based displays by incorporating focusing optical elements with the display itself. Fleming et al. have demonstrated a display that uses a retroreflective prismatic element within the display and a black electrophoretic colloid to control the reflection from this element [10, 11]. While the reflectivity of the micro prism layer will depend on the geometric details of the source illumination, in many lighting conditions, the micro prism itself provides optical gain, and the display can appear “whiter than white.”[12]. One display by Fleming et al., when illuminated by moderately collimated light, is reported to have an apparent brightness over 80%, with a 20: 1 contrast ratio. Fleming will describe more information on these types of displays in Chapter 4 of this volume. Further information about the metrology of measuring reflective display and e‐paper will be described in Chapter 12.
1.5.2 Grayscale – Analog vs. Digital
High‐quality images require grayscale, with 256 levels for each color channel being standard in emissive displays. Today, it is impractical to rely only on halftoning approaches to generate high‐quality grayscale, which would require further subdividing each CMYK subpixel into an additional 4, 8, or 16 subpixels to maintain the native resolution. Instead, grayscale is generated using analog techniques, in which any pixel can be programmed to show intermediate reflective states between black and white. While many reflective display technologies, including EPDs, can show continuous grayscale within any pixel, maintaining accurate and uniform grayscale across all pixels is challenging. Analog gray levels are typically restricted to a number that enables uniform luminance without mura artifacts. For example, today's commercial e‐paper displays from E ink are limited to 16 analog levels of gray to achieve good uniformity. However the underlying technology is capable of more gray levels [13].
Sophisticated dithering algorithms have been developed to minimize perceptual errors, some of which have been examined for use in electronic displays [14]. Dithering is analogous in many ways to halftones in print. In an electronic display, dithering sacrifices resolution to give the appearance of intermediate gray levels or to suppress non‐uniformities between pixels.
1.5.3 An Overview of Approaches to Color Electronic Paper
Many inventive approaches have been proposed to achieve electronic color paper. Some designs take advantage of an electro‐optical medium that can change color at the subpixel level intrinsically. Other approaches use color filters with an otherwise colorless black and white effect. Accurate and uniform grayscale is essential for high‐quality images and is often very difficult to achieve.
Figure 1.7 illustrates an EPD in combination with color filters [15]. The function of a color filter is to absorb portions of the visible spectrum so that reflected light is colored. RGB or CMY primary colors can blend the primaries to provide an extended color range. Grayscale is adjusted by controlling the state of the reflective medium, similar to gray in black and white displays. These displays inevitably must make trade‐offs between color saturation, color space coverage, and brightness. Reasonable brightness is usually achieved at the cost of color purity and a restriction of available colors.
Another approach is the adoption of multiple color particles as electrophoretic elements [16, 17]. Different colors can be generated in each sub‐pixel by mixing C, M, Y translucent particles with scattering white particles, as shown in Figure 1.8. This approach was firstly demonstrated by Fujifilm in 2012 [16], and later on by E ink [17], which named it Advanced Color ePaper (ACeP). The colored pigments have different electrophoretic mobilities and responsivities, which facilitate to shuffle the color particles with driving waveforms of different voltage and pulse widths. As shown in Figure 1.8, different primary colors can be presented by positioning the white particle layer above or underneath the translucent C, M, Y particles. Integrating the CMYW particles into a display unit, ACeP can present different colors and gray levels in each subpixel by controlling the driving waveforms. These driving waveforms are complex, and frame rates are currently slower than other EPD approaches. Nevertheless, the multiple color particle design dramatically increases the color saturation and reflective luminance achievable compared to the color filter approach. Figure 1.9 compares the color performance of these two types of color EPD prototypes [16, 17].
![Schematic illustration of color electrophoretic display using B/W particles and subpixel color filters [15] / John Wiely & Sons.](https://imgdetail.ebookreading.net/2023/10/9781119745587/9781119745587__9781119745587__files__images__c01f007.jpg)
Figure 1.7 Color electrophoretic display using B/W particles and subpixel color filters [15] / John Wiely & Sons.
![Schematic illustration of eight primary colors of ACeP by different pigment arrangements [17] / John Wiely & Sons.](https://imgdetail.ebookreading.net/2023/10/9781119745587/9781119745587__9781119745587__files__images__c01f008.jpg)
Figure 1.8 Eight primary colors of ACeP by different pigment arrangements [17] / John Wiely & Sons.
Many other inventive approaches have tackled the problem of making the electro‐optical medium capable of switching color. Controlled lateral migration of colored fluid and particles enables a bi‐primary color system. This design allows a single pixel to be changed through mixtures of color states [19].
A variety of other physical phenomena can be used to modulate reflected light electrically. The following table describes several varieties of reflective displays that have been developed over the past several decades. The fact that so many technologies have been pursued shows both the interest in the electronic paper and the difficulty in achieving a paper‐like display. We compare the various reflective display technologies in Table 1.1, showing the strengths and weaknesses of the different approaches. More information on these different technologies can be found in reviews [1, 2, 20] and other chapters in this book.
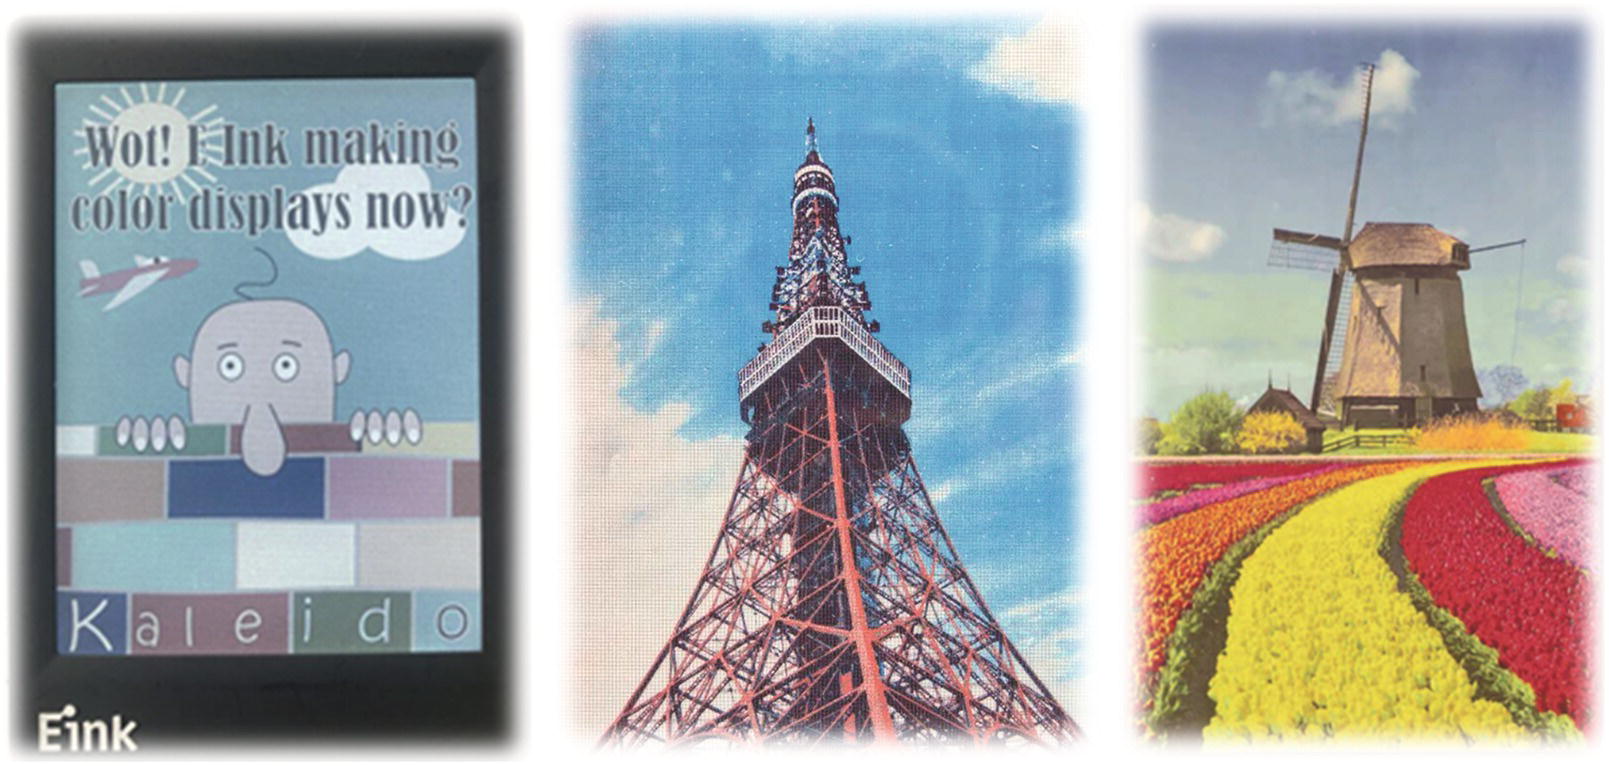
Figure 1.9 Prototypes of colored electrophoretic displays: the left image uses a color filter and front light, while the middle and right images use the multiple color particles design [16–18] A. [18] Ian French, et al. 2020; B.[16] Hiji N, et.al, 2012 / John Wiley & Sons, Inc.; C.[17] Telfer S J, MD Mccreary, 2016 / John Wiley & Sons, Inc.
Table 1.1 Summary of performance and other key factors for monochrome e‐Paper technologies.
| Electrophoretic (commercial) | Electrophoretic (eTIR) | In‐plane EPD | Electro kinetic | Liquid powder | Electrochromic | Electrowelting | Electro fluidic | MEMs (IMOD) | Cholesteric LC | PDLC | Reflect LCD w polarizer | Flip dot | Zenithal bistable device | |
|---|---|---|---|---|---|---|---|---|---|---|---|---|---|---|
| White, color %R | 44% W [21] | 60% [10] | 75% [23] | ∼62% [15] | 25 ∼ 30% [28] | 70% [30] | 70% W [34] | 72% W [37] | 61% (Indoor) 80% (Outdoor) [40] | 40% [35] | 50% W | 42% W [43] | 80% [45] | 39% [48] |
| Black %R | 3% [21] | 4% [10] | 3% [23] | 2% | 3 ∼ 4%[28] | – | 3–5% | <3% [37] | >3% [35] | 5% [35] | 5% | 2% | 6% | 2% [48] |
| Contrast ratio | ∼15 : 1 [21] | 15 : 1 [10] | 23 : 1 [23] | 30 : 1 | 8 : 1 | 38.1 : 1 [31] | >35 : 1 [35] | >30 : 1 [37] | 15 : 1 | 8 : 1 [35] | 10 : 1 | >20 : 1 [43] | 13.3 : 1 | 20 : 1 [48] |
| Lambertian | Yes | Partial [10] | Yes | Yes | Yes | Yes | Partial | Yes | No | Partial | No | Partial | Yes | Partial[48] |
| mono SNAP/SWOP | – | Maybe SWOP [10] | Maybe SWOP [23] | SNAP | – | Maybe SWOP [30] | SNAP [34] | SNAP | SNAP | – | Maybe SNAP | Maybe SNAP [43] | – | – |
| Driving voltage | 15 | 2–4 [11] | <10 | ∼5 [26] | 40–70 | 1.4 [31] | 15 ∼ 20 | 10–20 | 5–10 | (lab) < 4 (product) 25–40 [41] | 5 | ∼3 [43] | 4 ∼ 125[46] | 20 |
| Bistable | Yes | Yes [10] | No | No | Yes | Yes [32] | Yes [34] | Yes | Yes | Yes | No (Yes with matrix) | Yes | Yes | yes |
| Switching speed (msec) | 100's | (33 fps) 33 [10] | 15 (100 V) 30 (40 V) [24] | <300 [27] | <0.2 [29] | <10 [33] | 10 | ∼4 [38] | 0.01's | 300 (vertical) 5 (in‐plane) [41] | 51 [42] | 48 [43] | ∼66 [47] | 20 ms |
| Matrix drive | AM | AM [11] | AM, PM | AM | PM | PM | AM | AM, PM | PM | PM | AM | PM | – | AM [49] |
| Greyscale approach | Pulse | Pulse [10] | Analog/Pulse | Pulse | Multi‐write | – | Analog/Partial filling/Spatial dithering [36] | Pulse | Spatial/Temporal | Pulse | Analog | Halftone | Pulse | Analog [49] |
| Grayscale bit level | 4 | 4 [10] | 5 (∼30) [25] | >4 [27] | 2 | 6 [30] | 4 | 4 [39] | 6 | 4 | 8 (60 Hz) 1 (6 Hz) [42] | 2 [44] | 1 | 4 [49] |
| Neutral white point | Yes | – | Yes | Yes | Yes | Possible | Yes | Yes | Yes | No | Yes | Possible | – | Yes [48] |
| Lifespan | Good | – | Unproven | Unproven | Good/ltd. | Ltd./unproven | Unproven | Unproven | Good | Good | Good | Great | Commercial | Good |
| Power (Static) | None | None [10] | Very low | Very low | None | Very low | None [34] | None | Very low | None | Low | Moderate | None | Very low |
| Power (Video) | Low | Low [11] | n/a | n/a | Low | Very high | High | High | High | Moderate | Moderate | Low | High | Very low |
| Years of research | Since 1969 [22] | Reported 2018 [10] | Since 2000 [1] | Since 2009 [1] | Since 2003 [1] | Since 1989 [1] | Since 2003 [1] | Since 2009 [1] | Since 1997 [1] | Since 1994 [1] | In mid 1980s [1] | Since 2001 [1] | – | Since 1995 [48] |
| Maturity | Many products | Prototype [10] | AM & PM demo | AM demo | ESL product/large PM | Smart card products | AM demo | Segment product | PM products | PM products | AM prototypes | Products | Products | Products |
There are several interesting aspects of Table 1.1 worth noting:
- Several e‐paper technologies reach the reflective luminance of monochromatic SNAP (R ~ 60%), and a few of them move toward SWOP (R ~ 76%).
- The required driving voltages for many e‐paper technologies are below 15 V, the maximum voltage provided by mainstream active matrix backplanes. As we will describe in a later section of this chapter, active‐matrix backplane compatibility is a significant practical advantage.
- Many e‐paper technologies have demonstrated a video speed response. However, it is important to note that high‐quality video reproduction requires accurate grayscale performance, and accurate color if present. Not all technologies report this metric.
Later chapters in this book provide an up‐to‐date review of several essential e‐paper technologies.
- In Chapters 2 and 3, the fundamental mechanisms, physical models, driving waveforms, and image processing of EPDs will be reviewed.
- Chapter 4 describes the Clear Ink EPD with a total internal reflective structure, enhancing the display's brightness.
- Chapters 5 through 8 describe several different categories of reflective liquid crystal displays. Chapter 5 introduces reflective displays based on cholesteric liquid crystals that rely on Bragg reflection from helical liquid crystal structures. Chapter 6 introduces the zenithal bistable display (ZBD), which utilizes a grating‐type surface alignment structure to achieve bistable reflective states. Chapter 7 introduces the memory‐in‐pixel (MIP) liquid crystal display technology, which realizes a bistable display by building a static memory circuit behind the reflective electrode for each pixel. Chapter 8 introduces optically rewritable (ORW) technology, which uses a photoalignment layer to control the orientation of the liquid crystals and spatially generate bright and dark reflective states.
- Chapter 9 reviews electrowetting display technology, in which an applied voltage causes the physical translation of a dyed fluid within the pixel, with a resulting optical appearance change.
- Chapter 10 discusses electrochromic technology, generating reversible color change through an electrochemical redox reaction.
- Chapter 11 introduces the phase transition material technology. Under optical or electrical energy stimulation, a phase change material cycles between amorphous and crystalline states with a resulting change in reflectivity.
- Chapter 12 reviews the metrology of reflective displays, providing the means to characterize the performance of different technologies.
It is fair to say that the electronic paper technology that has seen the greatest success in transitioning to high volume products is the microencapsulated EPD technology from E Ink Corporation. The next section of this chapter will review the historical development of EPDs, including the many inventions and milestones needed to achieve a competitive device. It took over 35 years to go from the initial concept, proposed by Xerox and Matsushita, to a successful high‐volume product, the Amazon Kindle. During this development period, many engineers and scientists' insights and hard work developed a combination of technical achievements and manufacturing scale that could enable competitive display products. Even with the baseline technology resolved, it still took the right product concept ready at the right time to lead to the commercial success of the Amazon Kindle. There are lessons to learn from observing how a laboratory curiosity was transformed into a technology and product that opened up a new industry.
1.6 The Allure of Electronic Paper vs. the Practicality of LCDs
The idea of a personal electronic device allowing user input and a display output screen is widely attributed to work done in the late 1960's by Alan Kay of Xerox PARC. Kay coined the term DynaBook for the apparatus [50]. He also laid out many of the characteristics of the device, including that the visual output should be, at the very least, of higher quality than what can be obtained from newsprint. While electronic paper was not explicitly called out as a display medium, that analogy to newsprint is a natural precursor for an electronic book. Nevertheless, until the late 2000's, liquid crystal displays dominated all implementations of personal electronic devices.
Why did it take so long to develop attractive electronic paper products? One overwhelming factor is the success of the liquid crystal display. LCD technologies started development about the same time as EPDs, and one successful variant (the super twisted nematic, STN) LCD did not appear until over ten years later. Reflective LCDs' suffered from poor brightness, poor contrast, and poor viewing angle characteristics. Nevertheless, LCDs can be matrix addressed to enable high pixel count, have reasonable response time, and be used in transmissive mode. LCDs were seen as “good enough” for many early applications. With volume production came incremental improvements in performance, reliability, and cost year‐by‐year. For a new electronic paper technology to take hold, it must outperform LCDs in multiple aspects and have an application important enough to attract investment in manufacturing at scale. For decades, no reflective display technology seriously challenged LCDs.
1.7 The Evolution of Electrophoretic Display‐Based Electronic Paper
1.7.1 Early History
Electrophoresis is the movement of charged colloidal particles under the influence of an external electric field. Electrophoretic deposition is a well‐known technology, with an early patent dating to 1919 [51]. In electrophoretic printing [52], charged colloidal particles suspended in a dielectric fluid were directed to deposit in specific electrode areas by applied electric fields. Various methods were used to fuse the particles to form a permanent coating. Such liquid toner technology was later applied to xerography, where it competed with the more successful dry toner technology developed by companies such as Xerox.
An EPD could harness a similar effect, using a reversible translation of the colloid to form an image visible through a transparent electrode. Perhaps inspired by liquid toner technology, Evans et al. applied for a US patent in 1969 (granted in 1971) on a “Color Display Device,” which described an EPD [53]. Many essential elements in an EPD were disclosed, including:
- Charged particles in a dielectric fluid
- The dielectric fluid may be clear or opaque (colored)
- Different colored pigments may be used at the same time
- Charge control agents may be added to the particle suspension to aid in particle charging
- Bistability in the display was claimed, with image retention after the field is removed
- The potential for matrix (X‐Y) addressing
Despite the wide‐ranging descriptions, no actual working embodiments were described. There does not appear to be any public record of immediate follow‐up work by Evans or his coworkers. EPDs did become an important area of development by others at Xerox in the late 1970's, under a different group of researchers and engineers.
Nearly contemporaneously, Ota of the Matsushita Corporation applied for a patent in 1970 (granted in 1972) for an EPD Device [54]. Many of the same concepts described by Evans were disclosed in that patent. Ota also described an embodiment where the electrophoretic fluid was separated into distinct compartments within the display. Compartmentalizing the electrophoretic fluid foreshadowed a critical development area 25 years into the future when the electrophoretic fluid across the display would be separated into tiny, active microcapsules for improved stability.
In 1973, Ota et al. published the first peer‐reviewed article on EPDs [55]. This paper disclosed specific examples of the electrophoretic medium and display construction and showed photographs of digital clocks with seven‐segment display digits. These were the first public examples of working EPDs.
In the early 1970's, commercial electronic displays typically meant emissive displays such as cathode ray tubes, vacuum fluorescent displays, or Nixie tubes. There was a growing need for low‐power reflective displays in consumer devices, but these technologies were still under development and not yet widely used. A 1975 paper by Goodman of RCA Laboratories [56] described the landscape for low power reflective displays: liquid crystals (dynamic scattering and twisted nematic type), electrophoretic, and electrochromic. A wide range of properties was compared within the paper. However, the paper acknowledged that all these technologies were still at an early stage of development with unknown future potential.
An advantage of LCDs is that they could be matrix addressed to enable 48‐line displays, whereas the other technologies could not. If the application required more than a limited number of pixels, then LCDs were the only choice at that time. The paper concluded that “Although (none of the three display types) are yet not suitable for matrix address video displays, LCDs, ECDs, and EPIDs are potentially useful in those applications where low power consumption is important, and matrix address of a large number of elements is not important.” LCDs were being used in “watches, calculators, and panel displays.” Still, “Primarily because of the somewhat limited viewability of LCDS, ECDs, and EPIDS are being investigated for utilization… .” EPDs suffered from poor reliability and the need for high operating voltages, but the race was on to overcome these difficulties and supplant low visual‐quality LCDs.
1.8 Initial Wave of Electrophoretic Display Development
The 1970's and early 1980's were a period of intense development in EPDs. Multiple companies developed the technology, including Matsushita, Xerox, Philips, Plessey, EPID Inc., Thomson‐CSF, Seiko Epson, Exxon, and Copytele. It is instructive to describe what was and what was not accomplished by these pioneering companies.
During this period, the development focus was primarily on single color electrophoretic pigments suspended in a contrasting fluid. Many papers described progress on the electrophoretic suspension and in controlling the switching and memory characteristics of the panel. Some highlights in the technology development are described as follows.
1.8.1 The Electrophoretic Fluid, Thresholds, and Memory
In theory, the notion of charged pigment particles suspended in a dielectric fluid, being attracted or repelled from a transparent conductor to change a display's appearance, seems quite simple. In practice, the electrophoretic fluid was a witch's brew of particles with particular surface chemistries, low viscosity, high resistivity oil, one, or more dyes, surfactants, and charge control agents.
In 1977 Lewis et al. published a study describing several key behaviors of an EPD and the potential chemistry and physics behind them [57]. Topics such as stability against permanent flocculation, the challenges of creating a switching threshold, and the usefulness of various pigment, fluid, and polymer chemistries were described. The following list provides a snapshot of the characteristics of an EPD that Lewis et al. were able to achieve:
- 38 μm cell gap, comprising polymer‐coated titania in a diethyl phthalate solution of Sudan Black
- Drive voltage of 15 V
- one second switching time
- Erase/conditioning voltage of 30 V for one second required before addressing
- 1 μA/cm2 drive current
- Memory of weeks
Lewis et al. also provided a physics‐based analysis for reversible display memory based on the competition of van der Waals attraction and electrostatic repulsion between two particles within the electrical double layer. While this model provided some qualitative guidance, the authors recognized that the complex multi‐component composition found in actual displays was beyond the scope of a simple analysis. The authors postulate that steric stabilization by modification of the particle surface could be a helpful approach, which was an important area of future development by many companies.
A 1978 paper by Murau and Singer provided additional insight into the physics behind electrophoretic device stability and memory functions [58]. This paper described a further theoretical framework for particle attractions and repulsions. It also provided dynamic electrical measurements of working displays that demonstrated the complex behavior of multiple charge carriers with different mobilities. They claimed that properly stabilized suspensions could achieve over 250 000 000 switches without severe degradation.
Croucher and Hair later provided an additional detailed description of desirable properties for the electrophoretic fluid, along with examples for many categories [59]. They examined several aspects of dispersion stability, including the tendency of different suspensions to settle (gravity‐induced sedimentation), the tendency toward flocculation, and the ease of redispersion of the particles with time. They concluded that steric stabilization of the pigment particles is essential, and described the characteristics of polymers for stable physisorption onto the particles. They also speculated on potential advances, such as chemisorption (chemical attachment) of the stabilizing polymers onto the pigment, and demonstrated the potential of charge control characteristics into the steric stabilizer.
Novotny and Hopper published an analysis of the electro‐optical characteristics of an EPD device [60]. The paper described a model where the device's memory characteristics relied on particle‐electrode and particle‐particle attraction, and observed devices with memories on the order of many hours. They concluded that the wide distribution of such forces would work against the appearance of a voltage threshold for switching.
The lack of a voltage threshold was a major drawback for EPDs, as it reduced the ability of the device to use simple row and column electrodes (passive addressing) to enable displays with a large number of pixels. Other approaches toward enabling x‐y addressing are described later in this chapter, but the problem wasn't truly solved until the active matrix addressing became practical in the early 2000's.
1.8.2 Memory Function, Device Stability, and Control Grids
From the earliest times, the memory function for EPDs was noted as an essential feature of these displays. EPD memory was attributed to the EPD particles remaining in place after removing the switching voltage. Long‐term memory could lead to a low power device, which would consume power only during switching. Of course, if the particles stick too firmly to the panel electrodes, they could become stuck and degrade the contrast of the device due to lack of switching. Any particle adhesion to the panel electrodes or other particles would need to be finely balanced to offset gravitational settling (which could erase the image) and permanent particle stiction and flocculation (which could cause permanent ghosting).
The location of the pigment particles within the display will vary with the images rendered by the display. The local distribution of pigments would tend to vary from region to region within the display over time. This history dependence could require reset pulses to be applied to the EPD to erase the history. Moreover, the particles could migrate over time within the panel to give a non‐uniform distribution of pigment, which could cause a temporary or permanent reduction in contrast. Neither characteristic is attractive in a display and provided serious challenges to developing EPDs.
Despite the strong interest in EPD memory function, there is no complete description of the chemistry and physics of the EPD memory effect in this time. In his original paper, Ota noted that the EPD has a memory function, because the pigment particles deposited on the surface of the electrode remain on the surface even after removal of an applied voltage mainly due to van der Waals attractive force between the pigment particle and the electrode. No specific details beyond this simple description were given, though.
Further mentions of memory function were made by Dalisa and coworkers in two 1977 papers, though again, no detailed description of explanation was provided [61, 62].
To enable matrix addressing, Dalisa and coworkers proposed adding a third electrode layer, a “control grid,” between the other two cell electrodes to enable matrix addressing. The electrode rows in the control grid would be perpendicular to the columns in the bottom electrode. While the top electrode would uniformly attract (or repel) the electrophoretic particles, the control grid could provide an additional potential to either enhance or diminish the effective voltage between the top and bottom electrodes. Dalisa et al. claimed that the device demonstrated 5 ms switching per line at ±15 V and a resolution of 5 lines/mm. While the paper contended that further improvements could be made, the dimensions of the control grid and added complexity would limit this approach to low or medium‐resolution displays.
Hopper and Novotny published two papers in 1979 that provided detailed descriptions of some EPD systems and treated important topics such as response times, memory, and device addressing [63, 64].
- These papers described device dynamic and optical trade‐offs with cell thickness, electric field, particle concentration, and other formulation variables. They noted a complex electrical transient behavior due to the contributions of the many charged components present in the electrophoretic fluid.
- Similar to Ota, the papers described a hypothesis where the device's memory characteristics relied on particle‐electrode and particle‐particle attraction and observed devices with memories on the order of many hours. They concluded that the wide distribution of such forces would work against the appearance of a voltage threshold for switching. The device switching was dependent on the voltage history of the device. No other physical mechanisms regarding the memory effect were provided, though.
- Hopper and Novotny recognized that passive addressing of EPDs to achieve high pixel count displays was not likely. They noted that thin‐film transistor (TFT) active‐matrix addressing was possible, though the capability to fabricate useful TFT backplanes was not very developed.
- Hopper and Novotny noted that particle migration and settling where serious problems in EPD displays. Along with Harbor, they used a public invention disclosure to propose that subdividing the EPD panel into subdivisions could potentially resolve this issue [65]. As will be noted later, subdivided EPD panels were reported in 1986, and the microencapsulated EPDs described later in this chapter provided the ultimate segregation for particles.
Murau and Singer published a detailed study examining the mechanisms behind various factors leading to instability in electrophoretic panels [58]. They attributed the steric repulsion due to adsorbed polymers and modeled the balance between these repulsive forces between particles with the electric fields that induce tight packing of particles at the electrode surface. They also described two interesting phenomena that degraded display reliability:
- Particles undergoing vertical switching can migrate laterally outside of the electrode area and then become effectively stuck in field‐free regions.
- Electrohydrodynamic fluid instabilities caused by slow‐moving background changes in the suspension, leading to undesirable particle clustering
By carefully optimizing several aspects of the electrophoretic fluid, Murau and Singer were able to demonstrate a device that was switched over 2.5 × 10⁸ times without serious degradation.
1.8.3 Optics
While the white TiO2 pigment is similar to the pigments used in white paint, there are multiple aspects of the EPD that significantly reduce the reflectivity of a display compared to white paint. The reflectivity of a white pigment below a clear, dielectric surface will be reduced due to refraction and total internal reflection within the device and the reduction of illuminating light reflected from the display surface. An EPD device containing a dyed fluid, there will be additional losses due to residual colored dye in the fluid above the electrophoretic particles, even in the bright state. Reducing the dye concentration improved brightness, but at the cost of contrast due to reduced hiding of the white pigments in the dark state (Figures 1.10 and 1.11).
One of the first analyses of this interplay between brightness and contrast was provided by Vance [66]. Vance modeled the reflectivity of TiO2 pigment suspended in a dielectric fluid medium without dye to estimate the upper limit to reflectivity. He then analyzed experimentally the potential contrast for different dye concentrations and cell thickness and the impact on bright state reflectivity. (Figure 1.12) shows the relationship predicted between device reflectance and contrast ratio at different cell thicknesses and dye concentrations. Realizing that significant cell gaps will result in unacceptably high voltages and slow response times, for a 25 μm cell thickness, he estimated that an ideal device could achieve brightness between 35% and40% for a contrast ratio between 5 and 10. However, this estimate assumed that the electrophoretic medium contained a particle concentration of 10% or higher, which was considered unrealistic for a stable device.

Figure 1.10 Device reflectance vs contrast ratio for EPD at different device thicknesses. From Vance 1977 [66].
![Schematic illustration of first EPD product for point-of-purchase (POP) use, and the experimental numeral display EPD [70] / U.S Patents / Public Domain.](https://imgdetail.ebookreading.net/2023/10/9781119745587/9781119745587__9781119745587__files__images__c01f011.jpg)
Figure 1.11 First EPD product for point‐of‐purchase (POP) use, and the experimental numeral display EPD [70] / U.S Patents / Public Domain.
Fitzhenry‐Ritz published a similar analysis in 1981, examining the combinations of yellow pigment/red dye and green pigment/black dye from both a simulation and experimental perspective [67]. While her results were complicated by using color‐contrasting states, the results were similar to Vance in that it did not seem possible to achieve true paper‐like brightness and contrast with EPD systems.
Vance states, “It thus appears unlikely that displays with the contrast (10:1) and reflectivity (>70%) of black and white printed pages can be produced by these systems. Rather, as has been universally observed, practical ‘black and white' EP displays will operate between two shades of gray.” Interestingly, he notes that “devices employing undyed suspending fluids state (sic) such as those disclosed in the patent literature will be capable of much higher reflectance than the dye cells described here.” Despite this prediction, the appearance of two‐particle black and white EPDs will need to wait until the introduction of the microencapsulated EPDs more than 10 years later.

Figure 1.12 Demonstration of the first active‐matrix electrophoretic display.
Source: From A. Chiang. (1980). “Electrophoretic Display Technologies and Characteristics,” presented at the Seminar Notes, SID Technical Symposium. pp. 1–32 [78].
Analysis by Shu et al. determines that the relative reflectivity of white pigment in a dielectric fluid under glass is limited to <65% due to total internal reflection and other incoming and outcoupling losses [9]. Additional optical elements can be deployed to raise the effective brightness under some lighting conditions, as will be described in Chapter 4.
1.8.4 EPD in Decline
While steady progress was being made in EPDs, progress in LCDs was faster. In a 1986 IEEE Spectrum article entitled “Whatever happened to Electrophoretic Displays?,” Werner and Kmetz essentially announced the demise of EPDs [68]. They pointed out that while great progress was made in developing practical high pixel count EPDs with reasonable switching time, poor reliability still plagued the technology. Over time, the particles would tend to agglomerate, causing image nonuniformities. Moreover, the relatively high switching voltages for EPDs added complexity and cost to the driving electronics. STN LCDs could achieve similar contrast ratios, high pixel counts, and even faster switching speeds, with lower‐cost electronics. The future for EPDs seemed grim, with the article ending:” The two major players in EPDs have weighed these complexities and cast their votes. Philips has cut back its research effort, and the EPID division, which presented the only paper on electrophoretics at the 1986 SID Symposium, has been put on the block by Exxon.” Additional perspective is provided in the 2005 book Liquid Gold by Joseph Castellano [69]. While the book's primary focus is the development of the liquid crystal flat panel display industry, there is mention of competition by EPD displays. For example, Castellano reports that EPID displays (Exxon) had installed equipment to fabricate EPD displays in 1980; expansion was planned to enable 12.5″ displays (7.5″ × 10″) with 70 000 pixels. The EPD displays were able to show white pixels on a darker background, and the contrast was quite good. Nevertheless, the technology was plagued by image sticking, and long‐term reliability was unknown.
Philips commissioned a study by Castellano in 1985 to determine if there was still a market segment available for EPDs, given the rise of LCDs. Castellano writes that the only potential entry was to build large screen, high‐information content displays without the need for an active matrix backplane. Such products could replace CRT monitors or serve as the displays in portable computers. Unfortunately, the Philips technology suffered from similar reliability and matrix addressing limitations to EPID, Inc. and other companies. Castellano states that Philips ended the project a few years later.
Before closing out the section on the initial wave of EPD displays, it is useful to describe some of the achievements by the teams at that time, recognizing that the technology was moving into a near‐dormant phase in the late 1980's and 1990's.
- Matshushita developed EPDs with yellow‐red, white‐blue, and white‐black color pairs around the 1975 time period (Figure 1.11) [70].
- Murau at Philips Laboratories published a paper in 1984 describing an EPD with a control grid structure. The 9 × 16 cm display possessed 230 000 pixels at a pixel size of 250 × 250 μm in 360 rows by 640 column arrangement. Using encapsulated TiO2, the display achieved a relative brightness of 23% with a contrast ratio of 15 : 1 and an addressing time of 10 ms/line [71].
- Chiang described a 1 in2 32 × 32 display addressed using only a passive x‐y addressing scheme, enabled by a “packing pulse” followed by complex 2/1 or 3/1 selection Schemes [72].
- Chiang also reported a stylus‐addressed EPD in 1979, which finessed the x‐y addressing limitations by enabling the user to write an image using a charged stylus [73].
- Shiffman and Parker reported in 1984 an EPD display driven by NMOS circuitry on single‐crystal silicon. This first demonstration was limited to 16 × 16 pixels on a 4 × 4 mm display area, with peripheral circuitry filling the 6 mm wafer [74].
- Beilin and coworkers reported in 1986 a 9″ diagonal 2000‐character (8 × 8 pixels each) EPD display using control grid technology. The display employed honeycomb grid compartments to segregate the electrophoretic material into single pixels, claiming that five years of a lifetime is feasible. Interestingly, they reported that they improved the particle stability by chemically grafting the stabilizing polymers to the particle surface and several proprietary charging agents and stabilizers. The device was reported to have a reflectance of 13% with a 9: 1 contrast ratio [75].
- Chiang reported the first active matrix‐driven EPD panels in 1980 []. The varistor comprised back‐to‐back ZnO diodes, the panel incorporated pixel‐level storage capacitors and enabled a display with 32 × 32 pixels and an area of 1 in2. Switching voltages were reported as 70 V, with image switching times of either 16 ms (blue to white) or 11 ms (white to blue). Importantly, the paper also reported that the images were written line‐at‐a‐time, at 20 μs/line without crosstalk, flickering, or refreshing with the incorporation of local storage capacitors. This capability is unique to bistable reflective displays.
Despite these advances, for over 10 years, there was little activity in the development of electrophoretic technology. EPDs had developed the reputation as not viable for primary display application.i
The controversial company Copytele, founded in 1983, filed and was granted several patents in EPD technology. While raising millions of dollars from investors and claiming to develop displays for data and graphics, a report in 1992 indicated no evidence of any successful commercialization [79].
Nippon Mektron, in a 1994 paper, reported a 5 × 7 direct drive display aiming for large‐area applications [111]. The drive electronics were bonded directly to the backplane on a printed circuit board. More importantly, this paper demonstrated that EPD switching times could be fast (1.7 ms frame rate) and reliable (with over one 20 million switching cycles with only minor performance loss, and the equivalent of five years exposure to sunlight). Still, the contrast ratio was modest (4 : 1).
1.9 The Revival of EPDs
By the late 1990's several pieces of the puzzle started coming together.
- There was little progress in improving the optical appearance of reflective LCDs. If people wanted high‐quality, bright images on a portable electronic device, then backlit LCDs were required, with the usual limitations for emissive displays compared to paper.
- While several other technologies were investigated for reflective displays that could potentially be considered a rival for paper, none met with any commercial success.
- The steady growth of the LCD display marketplace led to a significant investment in TFT panel manufacturing plants. While TFT panels for LCDs were not optimized for EPDs, they potentially could solve the pixel addressing a problem that plagued early versions of EPDs.
EPDs did see a revival in the 1990's, with the introduction of microencapsulated EPDs. In a paper published in the journal Nature, Comiskey et al. from MIT demonstrated that it is possible to create an EPD by microencapsulating the electrophoretic medium in urea‐formaldehyde microcapsules [22]. The microcapsules were subsequently coated between two electrodes with an in‐situ polymerized polyurethane binder. Many of the positive features of EPDs were preserved, including near‐Lambertian viewing characteristics and bistability. Moreover, the microencapsulation seemed to provide a means of solving the agglomeration and pigment migration problems that plagued conventional EPD displays. Since the pigments and fluid were confined within a small microcapsule, migration of particles across the panel could be avoided.
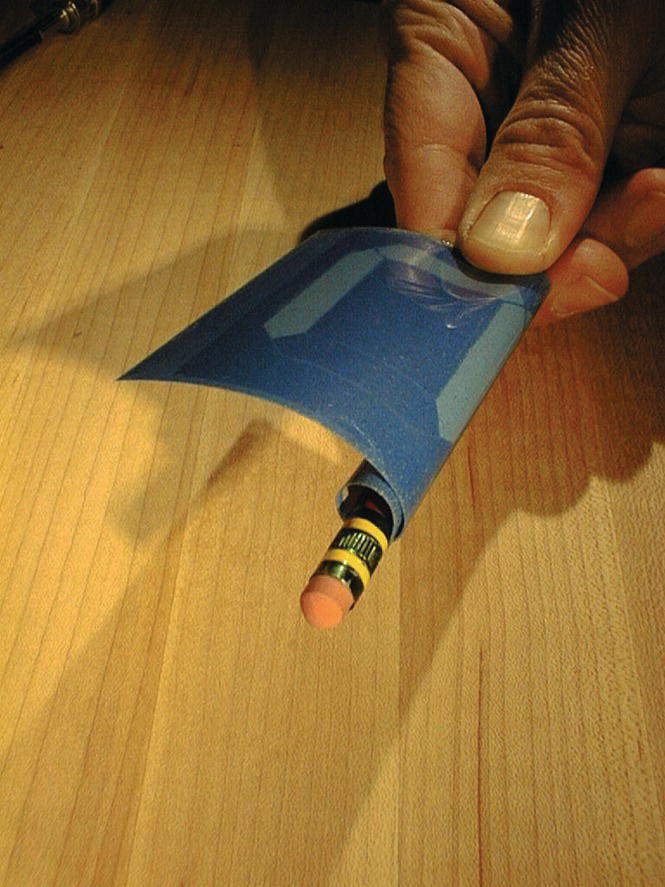
Figure 1.13 SID 1998 Digest paper [80] Drzaic P, et.al, 1998 / John Wiley & Sons, Inc.
Since the microcapsules that contained the electrophoretic fluid were dispersed in a polymer film, the display could be flexible as well. A 1998 SID Digest paper by Drzaic et al. demonstrated a fixed (bistable) image microencapsulated EPD display wrapped around a pencil in Figure 1.13 [80]. The display material comprised titanium dioxide particles and a blue dielectric fluid and was reported to exhibit ±90 V switching voltage, 12% luminance, and a 6:1 contrast ratio.
As an interesting footnote, the company Nippon Mektron had filed for several Japanese patents in the area of microencapsulated EPD, the earliest filed in 1987 and published in 1996 [81]. There is no evidence that these patents were filed outside of Japan or publications on this technology until 1998. That year, Nakamura et al. from the Japanese company NOK published a paper on microencapsulated EPDs at the 1998 SID symposium [82]. NOK showed an actual working display images, with a 5 × 7 matrix design‐driven with external switches connected by through‐film vias to reflective electrodes. Display characteristics included:
- TiO2 in blue dye dielectric
- 50 μm capsules made from gelatin/gum arabic
- Mixing of microcapsules into silicone binder, coating into a single layer, and laminating onto flexible film
- +/50 V switching voltage
- 50 nA/cm2 driving current
- Contrast ratio 4:1
- 1000‐hour stability (memory function)
Despite this early entry, further activity at NOK on the technology seems limited. There appears to be only one additional publication by that company, in 1999, using a flexible sheet of microencapsulated electrophoretic material with the photoconductive drum of a laser printer to form a rewritable flexible paper.
There are also several Japanese patents on microencapsulated EPDs filed in the late 1980's and early 1990's by Nippon Mektron Corporation, with the earliest appearing in 1987 [83]. Nevertheless, there are no technical publications in this area until the NOK 1998 paper, and no technical papers afterward. For the balance of this chapter, we will focus on developing EPDs at E Ink Corporation and collaborators.
1.10 Developing a Commercial Display
The startup company E Ink Corporation was founded in 1997 to commercialize “electronic ink” based on the MIT technology, and set up shop in Cambridge, MA. Professor Joseph Jacobson first drew attention to the concept in a 1997 publication aptly titled “The Last Book.” [84]. In 1998, the company received significant publicity, including being named one of Fortune Magazines 30 Cool Companies of 1998. The company also secured US$15.8 M in venture and industrial funding by mid‐1998, backed by the Hearst Corporation, Motorola, and others [85]. The venture capital model expected that E Ink would develop products that would enable the company to scale rapidly, supplying products in high‐volume markets such as publishing and advertising.
Much of the interest was driven by the vision of radio paper. In a 2000 interview, Jacobson described radio paper as “electronic paper, coated with e‐ink, with tiny transistors in it to act as electrodes, solar cells, and radio receivers.” The paper “would be able to upload pretty much anything, even video, using no more energy than it draws from ambient light.” “I fundamentally think five years is the right time scale for the static paper to be phased out and replaced by radio paper’ Jacobson says.” [86].
While the microencapsulated technology seemed promising, there was a long way to go to achieve any commercial product, let alone “radio paper.” Issues to overcome included:
- Contrast and brightness were not better than reflective LCDs and certainly inferior to backlit LCDs.
- The operating voltage was high. ±90 V switching is not compatible with high‐resolution devices
- The displays could not be passively addressed. Options were either direct drive (for low pixel count displays) or, in principle, active‐matrix backplanes (for high pixel count/high resolution) displays. At that time, TFT panels were expensive, hard to source, and not designed for the switching characteristics needed for EPDs.
- No scalable manufacturing method was demonstrated.
- Reproducibility and reliability not demonstrated
The vision of “radio paper” was compelling but incredibly challenging. Remarkably, the engineers at E Ink and their collaborators managed to make multiple inventions, overcome these limitations, and develop a competitive display technology that, while not quite “radio paper,” still met a market need in a compelling way. The following sections describe many of the key achievements to developing a practical display suitable for use in high‐volume electronic paper products, up to the introduction of the Amazon Kindle.
1.11 Enhancing Brightness and Contrast
The expectation that electronic paper would look like print on paper requires a display with reasonable brightness and contrast. As mentioned previously in this chapter, for EPDs using titanium dioxide dispersed in a dyed fluid, Fitzhenry‐Ritz pointed out a tradeoff in dye concentration, display brightness, and display contrast [67]. Using titanium dioxide in a dyed fluid, the microencapsulated EPD E Ink display exhibited a brightness of 12% and a contrast ratio of 6 : 1, well under the theoretical maxima predicted for EPD displays. While brightness and contrast ratio could be traded off by adjusting dye concentration, there was no expectation that a brightness >40% with good contrast could be achieved in this system.
A way out of this dilemma would be implementing a two‐particle system with white and black pigments. If one color of the colloid could be brought to cover the top surface of the microcapsule, with the other color hiding behind this layer, then higher brightness and contrast could be achieved. The challenge is that while previous papers and patents had disclosed the concept of such two‐particle systems, there is little indication that such a system was reduced to practice. There are significant challenges to such an implementation:
- There are two types of particles needed to possess opposite charges to respond to the applied field properly. Such opposite charges would attract, so that irreversible particle flocculation was a serious issue.
- The electrophoretic mobilities of the particles would need to be made stable, and any charging agents within the fluid compatible with both types of particles.
- This two‐particle system would need to be compatible with the microencapsulation process.
Honeyman and coworkers developed a means of grafting polymers onto the colloid surface, which achieved these goals [87]. They first attached a polymerizable or polymerization‐initiating group to the particle, then reacted with one or more polymerizable species. These secondary polymers could comprise branched polymer chains, which would present a barrier retarding the flocculation of oppositely‐charged particles. These polymers could also incorporate charged or chargeable groups. Since the polymers were chemically bonded to the particle surface, they would be much more stable over time previous methods of merely physabsorbing polymers onto a surface.
Achieving a two‐particle system resulted in a dramatic increase in display brightness compared to the single‐particle/dye system. As described in the following section, carefully engineered microcapsules were equally important in improving device optics.
1.12 Microencapsulation Breakthrough
While the microcapsules used by E Ink promised to resolve many of the instabilities found in conventional EPD displays, they introduced another problem regarding reduced contrast and high switching voltages. The following Figures 1.14–1.16 can be used to understand the source of these issues [80]:

Figure 1.14 Microphotograph of Microcapsules in blue state [112].

Figure 1.15 Microphotograph of Microcapsules in white state. From SID 1997 Digest paper [112].

Figure 1.16 Largest capsules are on the order of 100 μm. From 1998 Digest paper [80] Drzaic P, et.al, 1998 / John Wiley & Sons, Inc.
- There is a wide distribution of microcapsule sizes. Since the particles are rigid, they tend to layer on top of each other, increasing the cell gap across the film. This increased cell gap raises the total voltage required to switch.
- The rigid particles do not close pack. There are large gaps between microcapsules in which no switching occurs. These optically “dead” areas do not switch between light or dark states and degrade brightness and contrast.
- The distribution of the electrophoretic particles within the microcapsule is not uniform. Particularly in the dark state, the centers of the microcapsules showed larger optical contrast than the edges, which did not switch to the same degree.
Loxley and colleagues deftly resolved many of these issues by introducing microencapsulation chemistries to make the microcapsule walls compliant and developing a coating formulation to deposit a monolayer of capsules in an aqueous binder [89]. As the coating dried, surface tension pulled the microcapsules together. The compliant sidewalls enable the microcapsules to close pack, with minimal gaps between capsules. Additionally, the sidewalls between neighboring capsules take on a more vertical profile, which minimizes any curvature‐induced packing issues in the microcapsules.
Figure 1.17 shows a schematic‐view of the close packed capsules in a complete display. Figure 1.18 shows a top view of the microcapsules, with each square spaced at 200 ppi (127 μm on a side). Switching voltages of ±15 V became much more compatible with active‐matrix backplanes [90].
The photograph also illustrates another key feature of this formulation. The size of the microcapsules does not directly define the achievable resolution of the display. It is seen that with a given microcapsule, part of the microcapsule can be switched dark, and the remaining part light, depending on the field applied by adjacent electrodes. As such, high‐resolution images can be rendered.
1.13 Image Retention
One of the potential advantages of microencapsulated EPD systems is that the display's image can be retained for long periods. While this phenomenon had been noted in the early EPD work, the controlling factors were not fully understood. Sedimentation due to gravity was recognized as a cause of images fading over time, particularly severe in high‐density particles such as titanium dioxide. Coating the particles with polymer could reduce their density somewhat.
Figure 1.17 Schematic cross‐section of microcapsules e‐Paper display.
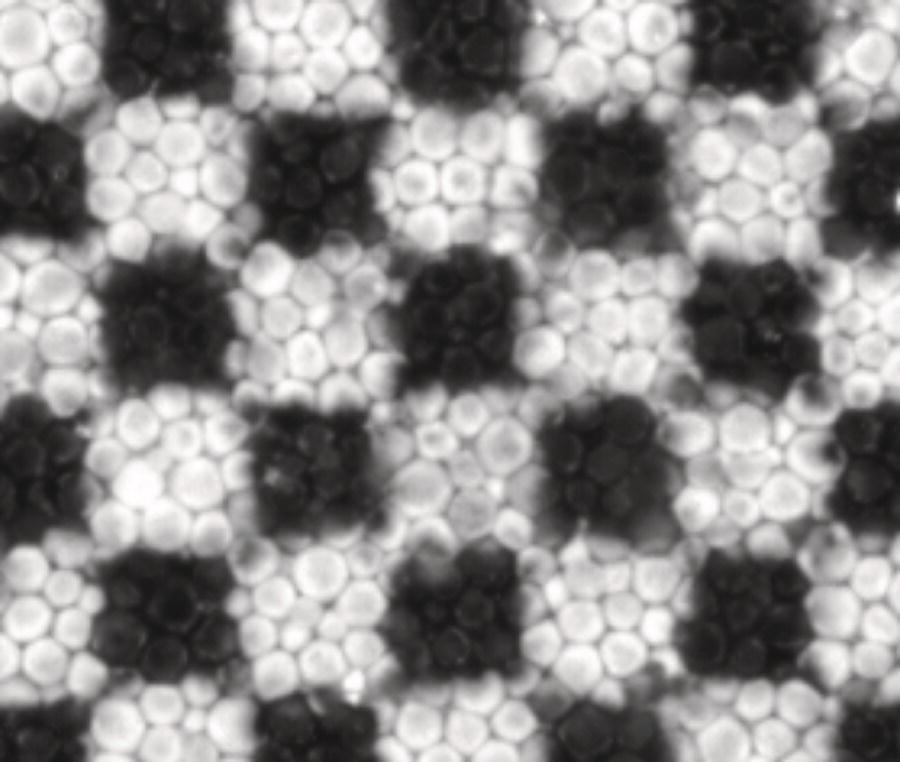
Figure 1.18 Each square is 127 μm on a side. From Bouchard 2004 [88].
As mentioned previously, Ota and Novotny and Hopper's publications attributed memory effects to van der Waals and electrostatic attractive force between the pigment particles and the electrode. In principle, the particle surfaces could be modified to enable sufficient attractive forces to counteract sedimentation forces. Still, the reality is that it is challenging to alter the particles to weakly and reversibly flocculate this way. In a two‐particle system, the problems become even more serious.
Webber developed stable and reversible image stability for two particle systems [91]. Webber discovered that adding an oil‐soluble high molecular weight polymer (>20 000) to the electrophoretic fluid can dramatically increase image stability without increasing the fluid viscosity. If the polymer is non‐absorbing onto the particle surfaces, the well‐known phenomenon of depletion flocculation will create osmostic pressure between the particles and induce soft flocculation [92]. Webber demonstrated image stability of 106 seconds in a black and white system (Figure 1.19).

Figure 1.19 Lightness (L*) as a function of time (t). Lightness states were achieved from different starting lightness states as indicated by the notation b → w, w → g, etc. The display was unpowered after completion of the optical change, i.e. t>0.3 s [91] / John Wiley & Sons, Inc.
1.14 Active‐Matrix Compatibility
High‐resolution images for EPDs require an active matrix backplane for addressing. Moreover, to fulfill the vision of “radio paper,” it seemed important that the active matrix backplane was scalable, flexible, and ultimately printable. Fortunately, silicon‐based TFT arrays were becoming available, and new flexible and printable technologies were on the horizon.
The first achievement of a silicon TFT, matrix‐addressed EPD, was made in late 1999. Bob Wisnieff of IBM provided to E Ink some active‐matrix panels designed for use in LCDs that would likely be compatible with the EPD material. This initial demonstration led to a successful collaboration with IBM, resulting in a 2001 report of active‐matrix driven EPDs with high pixel counts.ii Just as importantly, these prototypes demonstrated compatibility with technology already being deployed in the massive liquid crystal display industry [93].
In 2001 the engineers at E Ink further demonstrated microencapsulated EPD display driven by two other flexible active‐matrix panels.
- Using facilities at Princeton University, Chen designed and fabricated an a‐Si TFT array on a flexible stainless steel backplane. The resulting display is the first example of a flexible a‐Si microencapsulated EPD array [94].
- In collaboration with Lucent/Bell Labs, a 16 × 16 TFT array was built using organic transistors fabricated using a stamp‐transfer methods [95,96]. The resulting array was the first example of using organic semiconductors to fabricate a flexible display. This achievement gained international attention, winning the American Chemical Society Team Innovation award in 2002 and is designated as an “Editor's Choice Best‐of‐the‐Best” R&D100 award from R&D Magazine in 2001.
After this basic active‐matrix compatibility was demonstrated, custom electronic controllers and backplane designs enabled low power driving of high‐resolution panels. Early work leveraged existing AMLCD TFT backplane architectures, using specialized controllers to interface with the panel drivers, and providing specialized pixel‐level voltage pulses unique to the E Ink EPD material [97]. Gates et al. described an improved controller for EPD that elegantly repurposed the 16 bit wide LCD interface used for driving color panels to two 8‐bit representations of the current and to‐be‐updated EPD pixel gray levels. The display subsystem was also shut off between updates, allowing for ultra‐low power operation due to the EPD image stability [97,98].
The collaboration with Philips Corporation was critical for the successful evolution of the E Ink displays. Many such improvements are described in the paper by Henzen et al. [98]. EPD‐specific backplane modifications included two series transistors per pixel to enable large swing voltages, an enlarged storage capacitor to suppress kickback effects, and the adoption of a thick acrylate coating as an inner‐layer dielectric to create a field‐shielded pixel design. The Philips collaboration included a team from the Netherlands (Alex Henzen, Jan van de Kamer, Neculai Aileni, Roger Delnoij, Guofu Zhou, Mark Johnson), and Japan (Michael Pitt, Masaru Yasui, Tadao Nakamura, Tomohiro Tsuji).
1.14.1 Reproducible Gray Scale
Relying only on halftones for grayscale limits displaying images at high resolution. Microencapsulated EPD systems can partially switch between black and white states by applying an impulse (voltage*time) less than required to fully switch the pixel state. In principle, a large number of grayscales can be achieved this way. The challenge is that the impulse needed to achieve a specific gray level depends on the prior state of the display. If there is a set of pixels showing white, some showing black, and some showing a certain gray, the impulse to switch to another gray level will be different for each prior state.
Moreover, each pixel can have a somewhat different internal distribution of particles, depending on the history, even at the same nominal gray level. As more and more switching events take place, greater variations are built into each pixel, which appears in varying gray levels to the viewer. The pixels can be reset to a common starting state by applying a series of strong impulses, but the viewer sees these reset pulses as annoying flashes.
Amundson, Zehner, and coworkers demonstrated that it is possible to achieve reliable 4‐bit (16 level) grayscale using an algorithm that tracks the history of each pixel’s switching for a period of time, applying an impulse based on that history and the target gray level [99]. Through this approach and further application of other pulse waveforms, reasonably accurate 2‐bit (4 gray level) images could be achieved without visible flashing. This capability was extended to 16 levels in 2009 [100].
1.14.2 Overcoming “kickback” Phenomena
Since the early days of electrophoretic displays; it was known that charged species besides the pigments within the electrophoretic fluid could affect the performance of the displays. For the microencapsulated EPD, there is the additional complication that the “external phase” (polymer outside of the microcapsules) can also contain mobile ions, leading to deleterious phenomena due to time‐dependent polarization that external phase. This polarization can lead to phenomena where the switching characteristics depend on the time between pulses, or where the image slowly erases over time due to this polarization. However, work by Cao, Danner, and others showed that careful selection of the external phase chemistry could prevent these phenomena from occurring, leading to predictable switching and long‐term stable images [101,102]. The mechanism why kickback occurs and the waveform for alleviating this phenomenon will be described in more detail in Chapters 2 and 3, respectively.
1.14.3 EPD Panel Manufacturing
Unlike liquid crystal displays, microencapsulated EPDs required the development of several new manufacturing techniques. These include:
- volume production of electrophoretic suspension with all necessary pigment modifications and additives and incorporation of this fluid into a coatable microcapsule suspension
- roll‐to‐roll coating
- lamination to mechanical protection layer to enable handling

Figure 1.20 Encapsulation construction with [98] / John Wiely & Sons, Inc.
- creating an aperture through the electro‐optical material to allow interconnection to a backplane
- mechanical protection layers, and
- edge sealing to protect the microencapsulated EPD from water and humidity
Some engineers responsible for these essential practical advances include Duthaler, Danner, Zehner, Steiner, Doshi, Geramita, Valianatos, LeCain, and others [89,98,103] (Figure 1.20).
1.15 Electronic Book Products, and E Ink Merger
The first EPD‐based electronic reader, The Sony Librie EBR 1000, was introduced for sale in Japan in April 2004 [104]. The device was developed through a collaboration between Sony, E Ink, Philips, and Toppan Printing.
The device used a proprietary Sony eBook format. Content could only be purchased from content providers like Publishing Link via a PC and then transferred to the Libre by USB cable or memory stick. Digital rights management built into the system allowed for content to be accessible for 60 days, after which it expired and became unreadable. No support for pdf or other ebook formats was enabled. The device opened to middling reviews, in large part due to these content‐based restrictions. While the screen appearance was well‐received, many complained about the slow device interface, limited book offering, and the forced erasure of content [105].
Over the next decade, Sony released a series of upgraded readers and started marketing them outside of Japan in 2006. The devices never reached the volumes expected for such a product, and Sony exited the e‐reader market entirely in 2014 [106,107].
The Amazon Kindle was released in November 2007 and set the stage for a flourishing ebook ecosystem. This first device was a 6″ diagonal display, 800 × 600 @167 pixels per inch, and four gray levels per pixel. E Ink provided the microencapsulated electrophoretic material, the packaging design, and the driving scheme. Toppan printing mass‐produced the coating and conversion into sheet form the moisture‐barrier protective sheet. Philips developed the backplane, timing controller, and other ICs, and assembled the final module. Amazon sold the Kindle reader provided a large library of content for sale, and made it easy for customers to access that content. Year‐by‐year improvements led to greater adoption and increasing sales of e‐paper displays [107].
Despite the technical and product success of the Kindle, E Ink, the company was burdened by significant debt. The company had invested in many years of technology and business development. Its large area sign business only achieved modest success, and the Libre did not become a breakout product. Rather than maintain status as a standalone company, E Ink was sold to the Taiwanese Company Prime View International (PVI) in 2009 to enable further commercialization of the EPD technology [108]. Since then, PVI has renamed itself E Ink Holdings and continues to develop electronic ink for ebooks, signage, and other products. Later on, SiPix was merged with E Ink, with the microcup embossing technology enhancing the realization of high‐performance color e‐paper [109,110].
1.16 Summary
As is true for many technologies, the path for success for the electronic paper was not predictable. Periods of rapid technical progress were followed by periods of little interest due to combinations of application status, competitive technologies, and the commercial and financial landscape. Still, the rise, fall, and rise of electronic ink provides a nice success story for a technology that was envisioned to overcome a limitation of electronic displays and eventually managed to do just that.
The development of electronic paper did not end with the introduction of the Kindle. The remaining chapters of this book describe many exciting areas of development in this important field.
AcknowledgmentsPSD is grateful for the assistance of Rob Zehner, Guy Danner, Howie Honeyman, Rich Webber, Glen Crossley, Andrew Loxely, and Gregg Duthaler for useful discussions, and in proofreading the chapter.BRY is grateful for the assistance of Guangyou Liu, Mingyang Yang, Zheng Zeng, Linyu Song, Hao Shu, Yifan Gu, Yunhe Liu, Jie Liu, Xinzao Wu for manuscript preparation and in proofreading the chapters.AC would like to acknowledge Joel Pollack for oral accounts of early development activities on Electrophoretic Display Technology at various Xerox R&D Centers up to mid‐1970; and Warren Jackson for facilitating fact‐checks from Xerox document archives.
References
- 1 Heikenfeld, J., Drzaic, P., Yeo, J. et al. (2011). Review paper: a critical review of the present and future prospects for electronic paper. J. Soc. Inf. Disp. 19(2): 129–156.
- 2 Eshkalak, S.K., Khatibzadeh, M., Kowsari, E. et al. (2019). Overview of electronic ink and methods of production for use in electronic displays. Opt. Laser Technol. 117: 38–51.
- 3 http://paperproject.org/semgallery/semgallery1a.html#imagetop.
- 4 Smith, E., Heckaman, R.L., Lang, K. et al. (2020). Evaluating display color capability. Inf. Disp. 36(5): 9–15.
- 5 https://commons.wikimedia.org/wiki/File:Halftoningcolor.svg.
- 6 https://inkjetinsight.com/knowledge‐base/high‐speed‐inkjet‐devices‐take‐on‐commercial‐print‐quality.
- 7 https://inkjetinsight.com/knowledge‐base/understanding‐gray‐areas‐inkjet.
- 8 The International Committee for Display Metrology, (2012). Information Display Measurement Standard, v 1.03, 477. SID Publishers.
- 9 Shu, Y., Hagedon, M., and Heikenfeld, J. (2011). Light out‐coupling for reflective displays: simple geometrical model, MATLAB simulation, and experimental validation. J. Disp. Technol. 7(9): 473–477.
- 10 Robert, F., Sri, P., Robert, H. et al. (2018). 48‐2: Electronic paper 2.0: frustrated eTIR as a path to color and video. In: SID Symposium Digest of Technical Papers, 49(1): 630–632.
- 11 Fleming, R., Kazlas, P., Johansson, T. et al. (2019). 36‐3: Tablet‐size eTIR display for low‐power ePaper applications with color video capability. In: SID Symposium Digest of Technical Papers, 50(1): 505–508.
- 12 Mossman, M.A., Whitehead, L.A., and Rao, S.P. (2002). P‐83: Grey scale control of TIR using electrophoresis of sub‐optical pigment particles. SID Symp. Dig. Tech. Pap. 33(1): 522–525.
- 13 Satoshi, N., Kodama, Y. et al. (2013). 6.1: Invited paper: electronic paper system using high resolution electrophoretic display. SID Symp. Dig. Tech. Pap. 44(1): 34–37.
- 14 Lee, J.H., Horiuchi, T., and Saito, R. (2007). Confined‐error‐diffusion algorithm for flat‐panel display. J. Soc. Inf. Disp. 15: 507–518.
- 15 Duthaler, G., Au, J., Davis, M. et al. (2002). 53.1: Active‐matrix color displays using electrophoretic ink and color filters. In: SID Symposium Digest of Technical Papers, 33(1): 1374–1377. Oxford, UK: Wiley Blackwell.
- 16 Hiji, N., Machida, Y., Yamamoto, Y. et al. (2012). 8.4: Distinguished paper: novel color electrophoretic E‐paper using independently movable colored particles. In: SID Symposium Digest of Technical Papers, 43(1): 85–87. Oxford, UK: Wiley Blackwell.
- 17 Telfer, S.J. and Mccreary, M.D. (2016). 42‐4: Invited paper: a full‐color electrophoretic display. In: SID Symposium Digest of Technical Papers, 47(1): 574–577.
- 18 French, I., Lo, P., Chung, R. et al. (2020). Kaleido Color eReader Displays [J]. Proceedings of the International Display Workshops, 27: 754–756.
- 19 Mukherjee, S., Hsieh, W.L., Smith, N. et al. (2015). Electrokinetic pixels with biprimary inks for color displays and color‐temperature‐tunable smart windows. Appl. Opt. 54(17): 5603–5609.
- 20 Ivanova, A.G., Khamova, T.V., Gubanova, N.N. et al. (2020). Chemistry and manufacturing technology of electronic ink for electrophoretic displays (a review). Russ. J. Inorg. Chem. 65(13): 1985–2005.
- 21 Werner, K. (2019). LA chapter's one‐day conference covers North American display activity. Inf. Disp. 35(4): 34–36.
- 22 Comiskey, B., Albert, J.D., Yoshizawa, H. et al. (1998). An electrophoretic ink for all‐printed reflective electronic displays. Nat. 394 (6690): 253–255.
- 23 Verschueren, A., Stofmeel, L., Baesjou, P.J. et al. (2012). Optical performance of in‐plane electrophoretic color e‐paper. J. Soc. Inform. Disp. 18(1): 1–7.
- 24 Kishi, E., Matsuda, Y., Uno, Y., Ogawa, A., Goden, T., Ukigaya, N., Nakanishi, M., Ikeda, T., Matsuda, H. and Eguchi, K. (2000), 5.1: Development of In‐Plane EPD. SID Sympos. Digest. Tech. Pap. 31: 24–27.
- 25 Lenssen, K., Baesjou, P.J., Budzelaar, F. et al. (2009). Novel concept for full‐color electronic paper. J. Soc. Inform. Disp. 17(4): 383–388.
- 26 Yeo, J., Emery, T., Combs, G., et al. 2012. 69.4: Novel Flexible Reflective Color Media Integrated with Transparent Oxide TFT Backplane[J]. SID Sympos. Digest. Tech. Pap. 41(1): 1041–1044.
- 27 Koch, T., Yeo, J.S., Zhou, Z.L. et al. (2011). Novel flexible reflective color media with electronic inks[J]. J. Inform. Disp. 12(1): 5–10.
- 28 Sakurai, R., Hattori, R., Asakawa, M. et al. (2008). A Flexible electronic‐paper display with an ultra‐thin and flexible LSI driver using quick‐response liquid‐powder technology [J]. J. Soc. Inform. Disp. 16(1): 155–160.
- 29 Hattori, R., Yamada, S., Masuda, Y. et al. (2004). A quick‐response liquid‐powder display (QR‐LPD®) with plastic substrate[J]. J. Soc. Inform. Disp. 12(4): 405–409.
- 30 Yashiro, T., Hirano, S., Naijoh, Y. et al. (2011). 5.3: Novel design for color electrochromic display[C]. SID Sympos. Digest. Tech. Pap. 42(1): 42–45. Oxford, UK: Blackwell Publishing Ltd.
- 31 Ko, I. J., Park, J. H., Kim, Y. C., et al. 2017. P‐139: High Optical Contrast Reflective Display with Electrochromism[C]. SID Sympos. Digest. Tech. Pap. 48(1): 1781–1784.
- 32 Noh, C. H., Lee, J. M., Jeon, S. J., et al. (2009). P‐105: New Electrochromic Systems having Controllable Color and Bistability[C]. SID Sympos. Digest. Tech. Pap. Oxford, UK: Blackwell Publishing Ltd. 40(1): 1508–1511.
- 33 Cho, S.I., Kwon, W.J., Choi, S.J. et al. (2005). Nanotube‐based ultrafast electrochromic display[J]. Adv. Mater. 17(2): 171–175.
- 34 Rawert, J., Jerosch, D., Blankenbach, K. et al. (2010). 15.2: Bistable D3 Electrowetting Display Products and Applications[C]. SID Sympos. Digest. Tech. Pap. Oxford, UK: Blackwell Publishing Ltd. 41(1): 199–202.
- 35 Lo, K.L., Tsai, Y.H., Cheng, W.Y. et al. (2013). 12.4: Recent Development of Transparent Electrowetting Display[C]. SID Sympos. Digest. Tech. Pap. Oxford, UK: Blackwell Publishing Ltd. 44(1): 123–126.
- 36 Blankenbach, K., Schmoll, A., Bitman, A. et al. (2008). Novel highly reflective and bistable electrowetting displays[J]. J. Soc. Inform. Disp. 16(2): 237–244.
- 37 Hagedon, M., Yang, S., Russell, A. et al. (2012). Bright e‐Paper by transport of ink through a white electrofluidic imaging film[J]. Nat. Commun. 3(1): 1–7.
- 38 Henzen, A. (2018). 11.1: Invited Paper: Electrofluidic displays: Fast switching, Colorful, low power[C]. SID Sympos. Digest. Tech. Pap. 49: 105–107.
- 39 Bai, P.F., Hayes, R.A., Jin, M. et al. (2014). Review of paper‐like display technologies (invited review)[J]. Prog. Electromagnet. Res. 147: 95–116.
- 40 Gally, B., Lewis, A., Aflatooni, K. et al. (2011). 5.1: Invited Paper: A 5.7 ″Color Mirasol® XGA Display for High Performance Applications[C]. SID Sympos. Digest. Tech. Pap. Oxford, UK: Blackwell Publishing Ltd. 42(1): 36–39.
- 41 Lee, J.H., Cheng, I.C., Hua, H. et al. (2020). Introduction to flat panel displays[M]. Wiley.
- 42 Itoh, Y., Minoura, K., Asaoka, Y. et al. (2007). 40.5: Invited Paper: Super Reflective Color LCD with PDLC Technology[C]. SID Sympos. Digest. Tech. Pap. Oxford, UK: Blackwell Publishing Ltd. 38(1): 1362–1365.
- 43 Wen C J, Ting D L, Chen C Y, et al. (2000). P‐1: Optical Properties of Reflective LCD with Diffusive Micro Slant Reflectors (DMSR)[C]. SID Sympos. Digest. Tech. Pap. Oxford, UK: Blackwell Publishing Ltd. 31(1): 526–529.
- 44 Asao (2007). Y. P‐126: Advanced Image‐Processing Method for Hybrid Color LCDs[C]. SID Sympos. Digest. Tech. Pap. Oxford, UK: Blackwell Publishing Ltd. 38(1): 680–683.
- 45 Akashi, Y., Rea, M.S., and Bullough, J.D. (2007). Driver decision making in response to peripheral moving targets under mesopic light levels[J]. Light. Res. Technol. 39(1): 53–67.
- 46 https://flipdots.com/en/products‐services/status‐indicators/
- 47 https://flipdots.com/en/products‐services/custom‐made‐flip‐dot‐wall/
- 48 Jones, J.C. (2008). The zenithal bistable display: from concept to consumer[J]. J. Soc. Inform. Disp. 16(1): 143–154.
- 49 Jones, J.C. (2017). Defects, Flexoelectricity and RF communications: the ZBD story[J]. Liq. Cryst. 1–28.
- 50 Kay, A. and Goldberg, A. (1977). Personal dynamic media. Comput. 10(3): 31–41.
- 51 Davey, W. P. 1919. Process for making and applying Japan. US 1294627.
- 52 Archibald, M. K. 1959. Process for Developing Electrostatic Image with Liquid Developer. US 62936356A.
- 53 Evans, P. F., Lees, H. D., Maltz, M. S., and Dailey, J. L. 1971. Color Display Device. US 3612758.
- 54 Ota, I. 1972. Electrophoretic Display Device. US 3668106.
- 55 Ota, I., Ohnishi, J., and Yoshiyama, M. (1973). Electrophoretic image display (EPID) panel. Proc. IEEE 61(7): 832–836.
- 56 Goodman, L.A. (1975). Passive liquid displays: liquid crystals, electrophoretics, and electrochromics. IEEE Trans. Consum. Electron. 3: 247–259.
- 57 Lewis, J.C., Garner, G.M., Blunt, R.T. et al. (1977). Gravitational, inter‐particle and particle‐electrode forces in electrophoretic display. In: Proceedings of the SID. 18(3–4): 235–242.
- 58 Mürau, P. and Singer, B. (1978). The understanding and elimination of some suspension instabilities in an electrophoretic display. J. Appl. Phys. 49(9): 4820–4829.
- 59 Croucher, M.D. and Hair, M.L. (1981). Some physicochemical properties of electrophoretic display materials. Ind. Eng. Chem. Prod. Res. Dev. 20(2): 324–329.
- 60 Novotny, V. and Hopper, M.A. (1979). Optical and electrical characterization of electrophoretic displays. J. Electrochem. Soc. 126(12): 2211.
- 61 Dalisa, A.L. (1977). Electrophoretic display technology. IEEE Trans. Electron Devices 24(7): 827–834.
- 62 Dalisa, A.L., Singer, B., and Liebert, R. (1977). Matrix addressed electrophoretic displays. In: 1977 International Electron Devices Meeting. IEEE, 74–77.
- 63 Novotny, V. and Hopper, M.A. (1979). Optical and electrical characterization of electrophoretic displays[J]. J. Electrochem. Soc. 126(12): 2211.
- 64 Hopper, M.A. and Novotny, V. (1979). An electrophoretic display, its properties, model, and addressing[J]. IEEE Trans. Electron Devices 26(8): 1148–1152.
- 65 Harbour, J.R. (1979). Subdivided electrophoretic display. Xer. Disclos. J. 4(6): 705.
- 66 Vance, D.W. (1977). Optical Characteristics of Electrophoretic Displays[C]. Proceed. of the SID. 18(3): 267–274.
- 67 Fitzhenry‐Ritz B. (1981). Optical properties of electrophoretic image displays[J]. IEEE Transactions on Electron Devices 28(6): 726–735.
- 68 Werner, K. and Kmetz, A.R. (1986). Whatever happened to electrophoretic displays?[J]. IEEE Spectr. 23(7): 28–29.
- 69 Castellano, J.A. (2005). Liquid gold: the story of liquid crystal displays and the creation of an industry[M]. World Scientific.
- 70 Ota, I. (2009). History of Electrophoretic Displays and Proposal of a Novel Cell Structure for Lateral Particle Movement Display Devices[C]. International Display Workshop. EP1‐1, 525.
- 71 Murau, P. (1984). Characteristics of an X‐Y addressed electrophoretic image display SID Technical Digest. 141.
- 72 Chiang, A. (1981). A matrix addressable electrophoretic display. Eur. Secur. 107–110.
- 73 Chiang, A., Curry, D., Zarzycki, M. (1979). A stylus writable electrophoretic display device. SID. 79: 44–45.
- 74 Shiffman, R.R. and Parker, R.H. (1984). An electrophoretic image display with internal NMOS address logic and display drivers. Proc. Soc. Inf. Disp. 25(2): 105–115.
- 75 Beilin, S., Zwemer, D., and Kulkarni, R. (1986). 2000‐character electrophoretic display. SID Technical Digest. 136.
- 76 Chiang, A. (1980). Electrophoretic displays: the state of the art, Proceedings of Biennial Display Research Conference. 10–12.
- 77 Chiang, A. and Fairbairn, D.G. (1980). A high speed electrophoretic matrix display. SID Tech. Digest. 1–2.
- 78 Chiang, A. (1980). Electrophoretic Display Technologies and Characteristics, Seminar Notes, SID Technical Symposium. 1–32.
- 79 https://www.nytimes.com/1992/09/20/nyregion/a‐stock‐thrives‐without‐a‐product.html.
- 80 Drzaic, P., Comiskey, B., Albert, J.D. et al. (1998). 44.3 L: A Printed and Rollable Bistable Electronic Display[C]. SID Sympos. Digest. Tech. Pap. Oxford, UK: Blackwell Publishing Ltd. 29(1): 1131–1134.
- 81 Osamu, I., Tadakuma, A., Mori, T., and Naoyuki, M. (1996). Electrophoretic display device[P]. JPS 6486116A.
- 82 Nakamura, E., Kawai, H., Kanae, N. et al. (1998). 37.3: Development of Electrophoretic Display Using Microcapsulated Suspension[C]. SID Sympos. Digest. Tech. Pap. Oxford, UK: Blackwell Publishing Ltd. 29(1): 1014–1017.
- 83 Inoue, O. A., Tadakuma, T., Maida, N. M. (1987). Electrophoretic display device [P]. JP 62244679A.
- 84 Jacobson, J., Comiskey, B., Turner, C. et al. (1997). The last book[J]. IBM Syst. J. 36(3): 457–463.
- 85 Vinzant, C. (1998). Fortune; New York. 138(1): 76–77.
- 86 Burdick, A. (2000). The Only Book You'll Ever Need to Read[J]. New York Times Magazine.
- 87 Honeyman, C. H., Moran, E. A., Zhang, L. et al. (2004). Electrophoretic particles and processes for the production thereof. US 6822782.
- 88 Bouchard, A., Suzuki, K., and Yamada, H. (2004). P‐102: High‐resolution microencapsulated electrophoretic display on silicon. SID Sympos. Digest. Tech. Pap. Oxford, UK: Wiley Blackwell. 35(1): 651–653.
- 89 Albert, J. D., Crossley, G., Geramita, K., et al. (2005). Encapsulated electrophoretic displays having a monolayer of capsules and materials and methods for making the same[P]. US 6839158.
- 90 Pitt, M G. (2002). 53.2: Power consumption of Micro‐encapsulated electrophoretic displays for smart handheld applications. SID. 1: 1378–1381
- 91 Webber, R.M. (2002). 10.4: Image Stability in Active‐Matrix Microencapsulated Electrophoretic Displays[C]. SID Sympos. Digest. Tech. Pap. Oxford, UK: Blackwell Publishing Ltd. 33(1): 126–129.
- 92 Jenkins, P. and Snowden, M. (1996). Depletion flocculation in colloidal dispersions. Adv. Colloid Interface Sci. 68: 57–96.
- 93 Kazlas, P., Au, J., Geramita, K. et al. (2001). 12.1: 12.1′ SVGA Microencapsulated Electrophoretic Active Matrix Display for Information Appliances[C]. SID Sympos. Digest. Tech. Pap. Oxford, UK: Blackwell Publishing Ltd. 32(1): 152–155.
- 94 Chen, Y., Denis, K., Kazlas, P. et al. (2001). 12.2: A conformable electroniciInk display using a foil‐based a‐Si TFT array. SID Sympos. Digest. Tech. Pap. Oxford, UK: Wiley Blackwell. 32(1): 157–159.
- 95 Amundson, K., Ewing, J., Kazlas, P. et al. (2001). 12.3: Flexible, Active‐Matrix Display Constructed Using a Microencapsulated Electrophoretic Material and an Organic‐Semiconductor‐Based Backplane[C]. SID Sympos. Digest. Tech. Pap. Oxford, UK: Blackwell Publishing Ltd. 32(1): 160–163.
- 96 Rogers, J.A., Bao, Z., Baldwin, K. et al. (2001). Like electronic displays: large‐area rubber‐stamped plastic sheets of electronics and microencapsulated electrophoretic inks. Proc. Natl. Acad. Sci. 98(9): 4835–4840.
- 97 Gates, H., Ohkami, T., and Au, J. (2006). 37.2: Improved Electronic Controller for Image Stable Displays[C]. SID Sympos. Digest. Tech. Pap. Oxford, UK: Blackwell Publishing Ltd. 37(1): 1406–1409.
- 98 Henzen, A., Van de Kamer, J., Nakamura, T. et al. (2004). Development of active‐matrix electronic‐ink displays for handheld devices. J. Soc. Inf. Disp. 12(1): 17–22.
- 99 Johnson, M.T., Zhou, G., Zehner, R. et al. (2006). High‐quality images on electrophoretic displays[J]. J. Soc. Inform. Disp. 14(2): 175–180.
- 100 https://en.wikipedia.org/wiki/Amazon_Kindle.
- 101 Cao, L., Gates, E., Miller, D. et al. (2007). Electrophoretic media and displays with improved binder. US 20070091417A1.
- 102 Wilcox, R. J., Whitesides, T. H., Amundson, K. R. et al. (2013). Electro‐optic displays with reduced remnant voltage[P]. US 8558783.
- 103 LeCain, R. D., Knaian, A. N., O'Neil, S. J. et al. (2006). Components and methods for use in electro‐optic displays. US 6982178B2.
- 104 https://goodereader.com/blog/electronic‐readers/the‐sony‐librie‐ebr‐1000‐was‐the‐first‐e‐reader‐with‐e‐ink
- 105 Dvorak, P. (2004). Electronic Readers, Now on Sale in Japan, Still Don't Beat Paper. Wall Street Journal. (Eastern edition). New York, NY: Jul. 15: 13.1.
- 106 https://goodereader.com/blog/electronic‐readers/the‐evolution‐of‐the‐sony‐e‐reader‐in‐pictures
- 107 https://techcrunch.com/2014/02/06/sony‐closing‐reader‐store/
- 108 Chiu, J. (2012). How does financial strategy help to provide a win‐win merger and acquisition solution? The case of PVI and E Ink[J]. Appl. Fin. 1314.
- 109 Liang, R.C., Hou, J., Zang, H. et al. (2003). Microcup® displays: Electronic paper by roll‐to‐roll manufacturing processes[J]. J. Soc. Inform. Disp. 11(4): 621–628.
- 110 Yang, B.‐R., Lin, C., and Yih‐Ming, K. (2014). Microcup Designs for Electrophoretic Display[P]. US 8891156B2.
- 111 Toyama, J., Akatsuka, T., Takano, S., Tadakuma, A., Mori, T., Suga, S., Sano, Y., (1994), An Electrophoretic Matrix Display with External Logic and Driver Directly Assembled to the Panel, SID Sympos. Digest Tech Paper 25:588–590.
- 112 Comiskey, B., Albert, J.D., Jacobson, J. (1997) 7.4L: Late‐News Paper: Electrophoretic Ink: A Printable Display Material, SID Sympos. Digest Tech Papers, 28:75–76.
Notes
- i The reputation for EPD displays remained poor into the late 1990s. One of this chapter's authors (PSD) was introduced to display technology luminary Sir Cyril Hilsum at an SID event in 1998. When Hilsum learned that he was planning to join a new start‐up company (E Ink) as Director of Technology to work on EPDs, Hilsum's response was “I'm so sorry.”
- ii The E Ink‐IBM collaboration was mentioned briefly in a 2000 article in the Wall Street Journal. Interestingly, the reporter noted that IBM had a longstanding interest in newspapers, and was “supplying E Ink with millions of its laptop transistors for testing.” A. Klein, “Will the Future Be Written in E‐Ink?,” The Wall Street Journal, pp. 1–4, 04 Jan 2000.