12
Optical Measurements for E‐Paper Displays
Karlheinz Blankenbach
Pforzheim University, Display Lab, Tiefenbronner Str. 65, 75175 Pforzheim, Germany
12.1 Introduction
There are two types of direct view display technologies (beside projection): Displays that modulate their reflection of ambient light and emissive or permanently backlit displays which convert electrical power to light. The fundamental characteristics of emissive displays like luminance and color are measured under darkroom conditions. That is relatively easy to perform compared to measurements on reflective displays, which must be illuminated. The main challenge here is that the results depend on the actual set‐up and geometry of the illumination, the display (e.g. angular reflection characteristics), and the measurement device. This applies as well for emissive displays when measuring their ambient light performance. A very widely used and comprehensive display measurement standard is the SID IDMS [1] (especially Chapter 11 “Reflection Measurements”). For example, additional background information on display measurements with explanations can be found in, e.g. [2]. These two references contain all the information necessary to understand and perform detailed reflective display measurements.
The structure of this chapter is as follows:
- The fundamentals of the physics of reflection are the basis for understanding the procedures for reflective measurements.
- Examples of measurement set‐ups such as those using a sampling sphere point out challenges and solutions for performance data acquisition.
- The section “Display Quality Parameters” introduces the most essential criteri for judging display quality: Luminance, contrast ratio, graygrey scale, and color reproduction.
- Application relevant parameters such as switching speed, lifetime, viewing angle, and front‐light are briefly listed with some references.
There is a wide range of reflective display technologies with different principles and optical characteristics, typical sample data and references are provided here. An example is switching speed, which is relatively slow for electrochromic and electrophoretic technologies compared to, e.g. electro‐wetting displays that can achieve video speed.
12.2 Fundamentals of Reflection
When incident light hits a (reflecting) object, a portion of this light is reflected. The parameter “reflectance” refers to the ratio of reflected incident optical power. The simplest case illustrating the reflection characteristics is a narrow beam that hits an ideal mirror: The incident angle is equal to the angle of the outgoing (specular reflected) ray (see Figure 12.1 left). However, typical surfaces of reflective displays have diffuse to semi‐glossy characteristics. Therefore, the incident light is reflected in various directions with different intensities. For an ideal diffuse surface, the intensity of the reflected light is independent of the incident and outgoing angles (visualized as semicircle). Please note that reflections happen not only in two‐dimensions as illustrated but also all directions (3D) as illustrated in Figure 12.1 right: A tiny ray of a laser is reflected in all directions (hemisphere). The reflected light is represented by a polar plot, in which the distance from the origin to the plot line at any angle θ The intensity measured is measured in all (3D) directions and coded by grayscale (no reflection: black; maximum: white). Semi‐glossy surfaces reflect more light in the specular direction (center of the plot) than at other angles.
Figure 12.2 shows the typical reflectance characteristics of diffuse e‐paper for white and black (lower reflectance as for white). The semi‐glossy curve is typically due to the front surface (glass, plastic). However, the actual behavior of displays is more complex as they consist of many different layers with different optical characteristics that contribute to the reflectance characteristics [3]. That is why it is usual to present the results of measurements on a complete display. Other geometric optical effects occur when the display is curved (e.g. flexible displays).
A typical set‐up for measuring the angular reflection distribution is illustrated in Figure 12.3 left: The light from a small source strikes the surface at an angle θs measured relative to the normal line (dashed). The reflected light is captured by an optical detector (typically a luminance meter for displays), which can be moved around the point of incidence; its (actual) angle is θd. The result is plotted as reflectance (percentage of luminance referring to a standard, e.g. diffuse white standard or black glass) over the angular difference θs‐θd. Such measurements are often termed a Bi‐directional Reflectance Distribution Function (BRDF, [4, 5]). The region around 0° is called the specular range. Next to the specular peak is the “haze” range, and toward larger angles from specular, we are in the diffuse region.
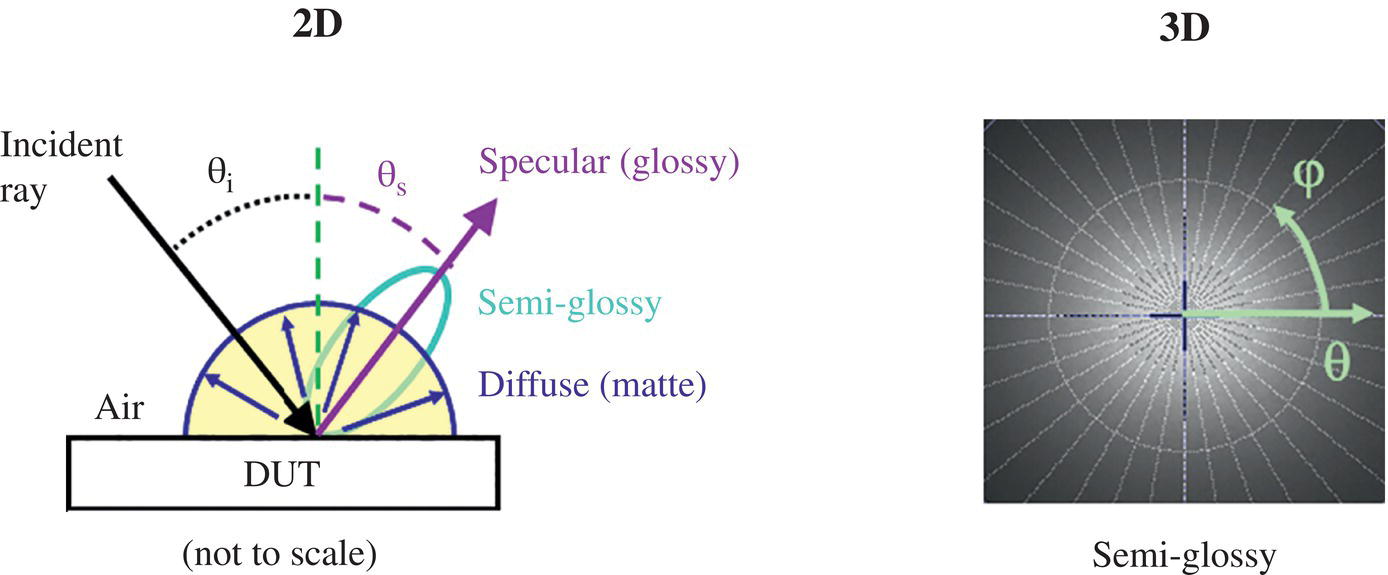
Figure 12.1 Fundamentals of reflection for incident and reflected light in two‐dimensional view (left) and a measurements of a semi‐glossy surface in 3D (right) as polar plot with intensity represented by gray levels.

Figure 12.2 Examples for bright (left) and dark (right) state of diffuse flat e‐paper display material with semi‐glossy surface. The reflections are illustrated as 2D but occur in 3D (hemisphere) for diffuse case.
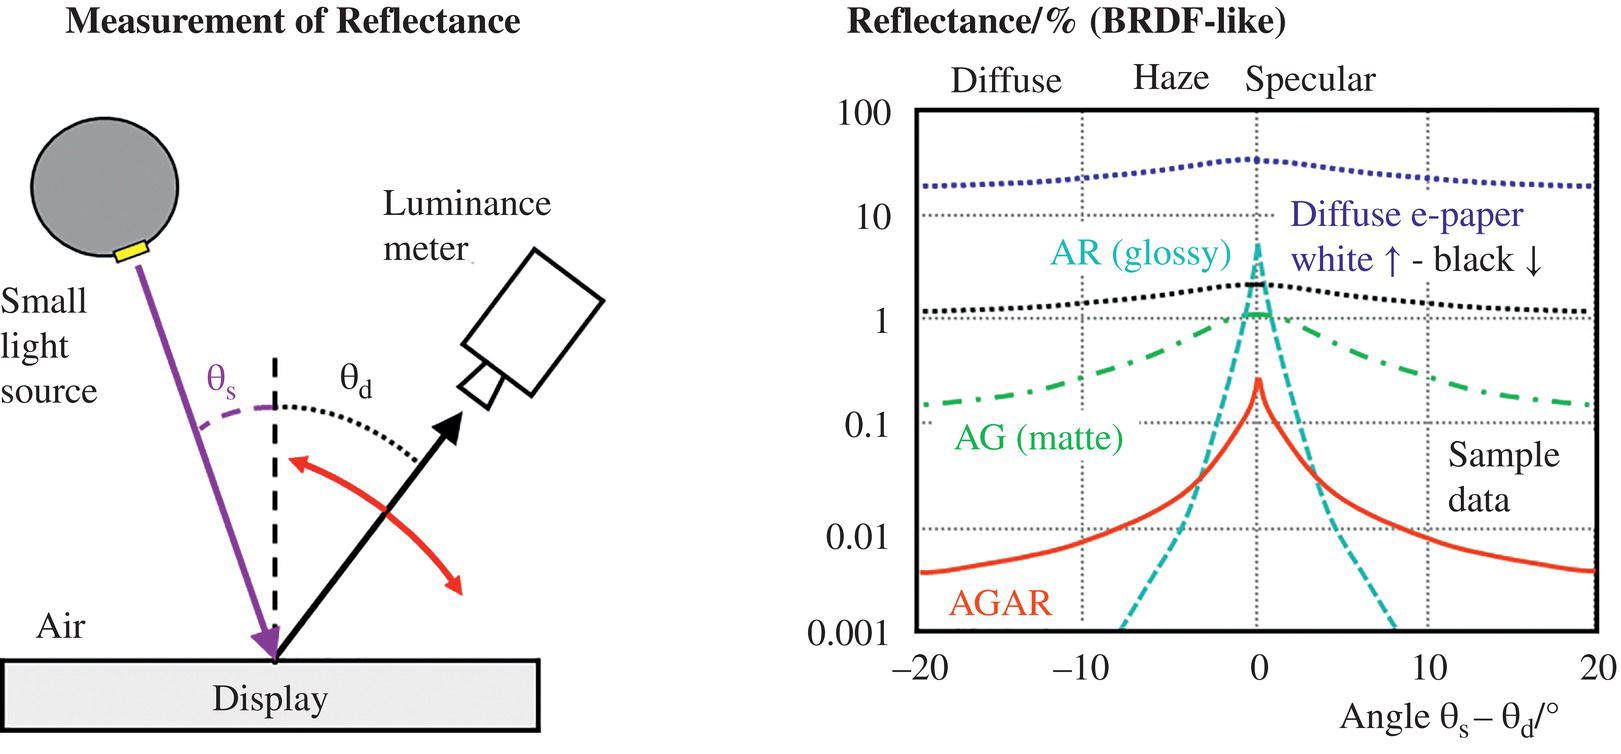
Figure 12.3 Measurement set‐up for angle resolved reflectance measurement (left) and typical characteristics (right) for various surfaces and a diffuse display.
This results in the sample curves in Figure 12.3 right (top to bottom): A diffuse e‐paper in its white state (blue/dotted curve) with a reflectance r in the range of 30% and a small glossy peak, for e‐paper in the black state (black/dotted curve) the reflectance is smaller, but the character is typically the same. A glossy display (cyan/dashed curve – for example, most smartphone screens) has a narrow peak in the specular range whose height can be reduced by anti‐reflection (AR) coatings like those used for glasses. A larger half‐width is the characteristic of a matte surface, which acts as an anti‐glare layer (green/dotdash curve, AG). When AR and AG are combined, the reflection reduction is highest (red/solid curve, AGAR). A perfect mirror has a narrow peak at 0°.
Therefore, it is evident that the total reflection properties of reflective displays are given by the characteristics of the electro‐optic material (e.g. electrophoretic) and all the other surfaces of the display (such as reflection reduction coating, glass, transparent semiconductors). The reflectance value is a major parameter by which to judge the legibility of reflective displays (see below). When a display is in use, dirt, dust, and fingerprints will change its reflection characteristics. The front surface coating can also degrade through damage (abrasion testing). To summarize, the reflectance characteristics must be measured for a given display, as there is hardly any simulation or extrapolation from other displays possible.
12.3 Reflection Measurements Set‐Ups
Measuring the reflectance of displays over a range of angles as described above is not practical for characterizing, e.g. the legibility on a reflective display. The performance of displays under ambient light can be measured using set‐ups such as those shown in Figures 12.4, 12.6, and 12.8. It is inevitable that the results of these measurements strongly depend on the set‐up geometry, of which many other variations exist as well [1, 6, 7]. Therefore, only values acquired using the same setup can be compared. The examples described here refer to flat displays: the measurement of curved ones is more complex, see, e.g. [8].
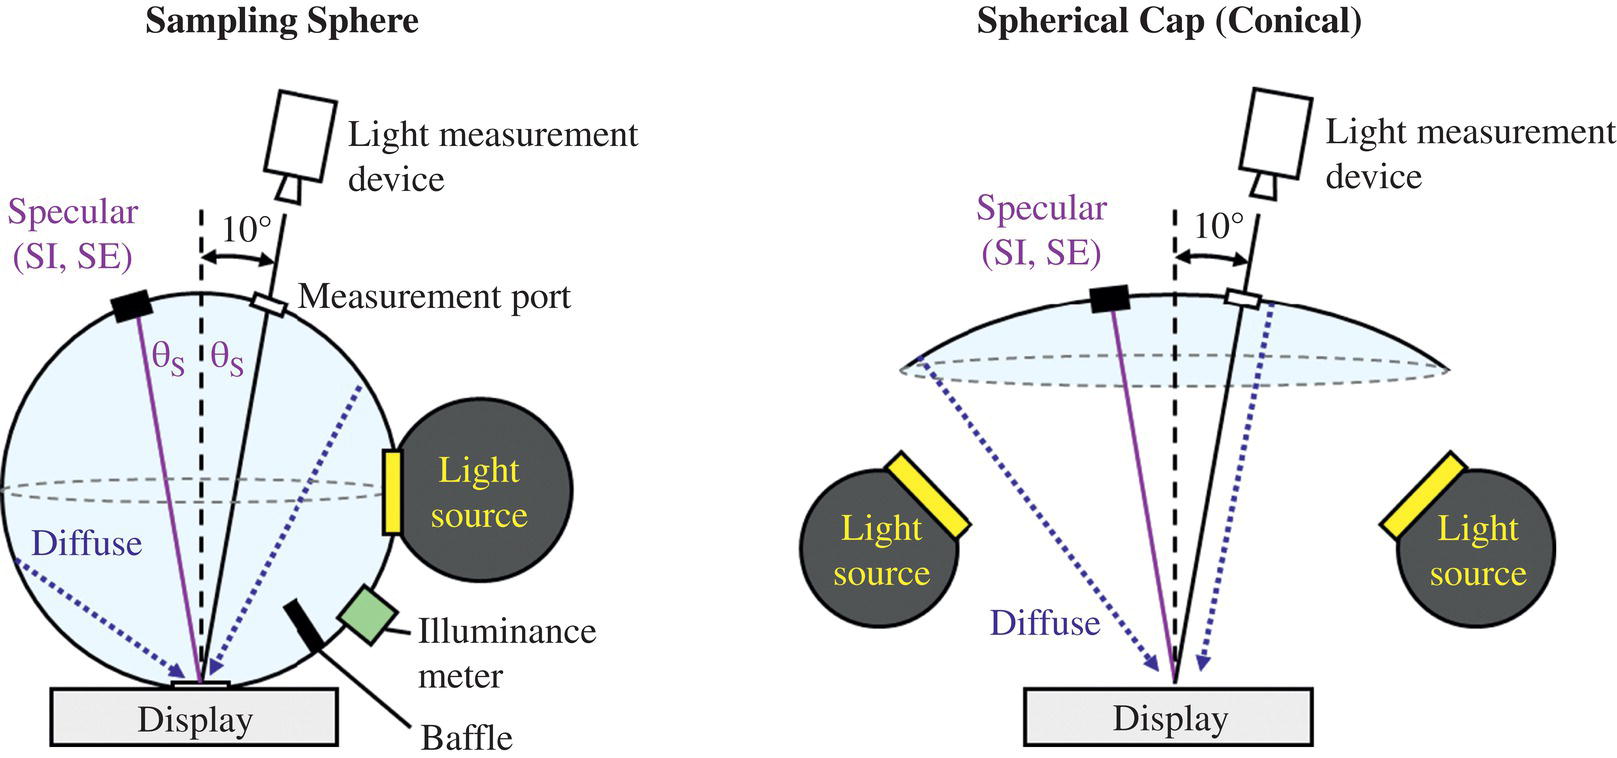
Figure 12.4 Reflective displays measurement set‐ups: Sampling sphere (left) and spherical (conical) cap (right). The light measurement device “points” to the specular port, whose surface has a huge impact in the result (see Figure 12.5).
The most widespread set‐up for measurements with simulated ambient light is a sampling (or integrating) sphere (Figure 12.4 left) with a diameter in the range of 25 cm. Its interior consists of a diffuse white coating, which homogenizes the light from the source to provide near‐ideal diffuse illumination. The baffle blocks light from the source from hitting the display directly. The illuminance is measured either by a fixed meter (as shown) or indirectly by using a white diffuse reflectance standard in place of the display under evaluation, and the same a luminance meter at the measurement port as used for the display evaluation.
A small port (e.g. 3 cm diameter) at the bottom of the sphere allows the light to illuminate the display under test. Light reflected from the display is measured by luminance or a color meter (imaging detectors are also possible) at an angle of 5–10° off normal to avoid specular reflections of the detector lens on display. There is an exchangeable port on the opposite side with either white (specular included, SCI) or black matte (specular excluded, SCE) finish; the impact is discussed below. The influence of the diameter of the specular port is significant, as can be understood from Figure 12.3 right.
The “spherical cap” is similar but less costly approach is the “spherical cap” (Figure 12.4 right). A major difference compared to the integrating sphere is that only light within a cone of about 30° falls onto the display. An advantage is that there is more flexibility on the display arrangement than the sampling sphere. For example, as there is no physical contact between the measuring equipment and the display, curved displays and displays integrated in housings are more easily handled using the spherical cap.
In contrast to reflective displays that do not generate light, emissive displays or those with an amount of light emitted by the display raises the illuminance inside the sampling sphere. Therefore, the light source has to be adjusted when defined illuminance values are required, as may be the case for full‐screen black and white contrast ratio measurements.
The effect of placing the SCI and SCE caps onto the specular port is pictured in Figure 12.5 for a glossy, a semi‐glossy, and matte display. The outer (black) circle denotes the border of the measurement port from the viewpoint of an imaging photometer from outside the sphere. The gray area is the display behind its corresponding port. Let us start with the “specular included” cap in place, with a glossy (mirror‐like) display surface: The coating of the port is the same as the interior of the sampling sphere. The faint gray ring arises from the cap's imperfect join and port. Therefore there is no noticeable difference between the reflections inside and outside of the specular direction of the cap (top). Now we change the cap to one with a black coating or a light trap (SCE): The specular reflection in the glossy (or “mirror‐like”) display surface is now dark (bottom) as a result of pointing to the black area of the sphere.

Figure 12.5 Effect on the measured reflections of typical surface characteristics depending on the specular port paint (c.f. Figure 12.4): White diffuse (top, same as, e.g. sampling sphere) and black diffuse (bottom) material.
The outcome is that the contrast ratio (see below) is lower for SCI as the glossy reflection of the front surface adds to the (diffuse) reflection of the display. This is not the case for SCE. The more matte (or “diffuse”) the surface is, the less noticeable is the effect of the black area of the sphere. Reflections of objects with a small angular size can also be used to visually judge the reflection characteristics: A glossy (mirror‐like) display shows sharp edges which will be blurred for semi‐glossy and are hardly noticeable for matte (diffuse) surfaces. Summarizing: It is essential to report on the nature of the specular port for sampling sphere and corresponding measurements.
Another configuration for measuring reflections from displays is provided in the standard MIL‐L‐86762 and illustrated in Figure 12.6 left: The values for the diffuse illuminance E and the specular luminance Ls can be individually adjusted to the typical requirements of the application such as E = 50,000 lx and Ls = 25 000 cd/m2. This makes this set‐up suitable for “simulating” light conditions encountered in various applications. Please note that for this set‐up and most other ambient light measurements, the reflected light is measured as luminance (unit: cd/m2, a photometric unit) used below for image quality evaluation.
A luminance (or color) imager, as shown in Figure 12.6 left, is recommended for all measurements with ambient light, as the image‐like acquisition (see inset) documents the whole measurement, and the analysis is performed using this “image” and placing measurement areas or line profile. This reduces the risk of unwanted effects such as non‐uniform illuminance over the display area or specular stray light. Those devices consists of an imaging chip (similar to a digital camera), dedicated color filters, and calibration to achieve absolute measurements [9].
The photo in Figure 12.5 right shows a display with reflections of various types of light sources. Information on the display modulates a diffuse reflection and can be read in areas where it is not overwhelmed by bright light sources' mostly glossy (specular) reflections. Those specular reflections typically originate from the front surface (front‐plane), and the contrast can be optimized by reflection reduction methods like anti‐reflective or anti‐glare coatings.
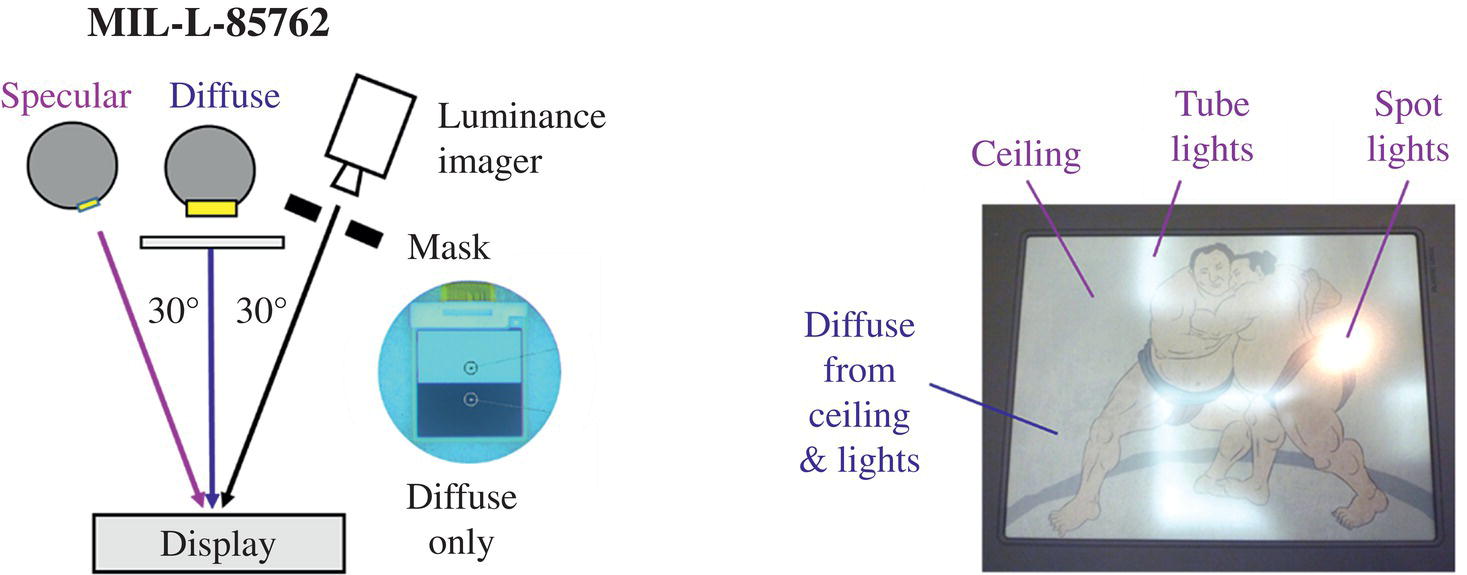
Figure 12.6 Measurement set‐up (left) with luminance (or color) imager and sample photo for diffuse and specular conditions; reflection on s semi‐glossy e‐paper display (center).

Figure 12.7 Visual comparison of an electrophoretic display and a reflective LCD for diffuse (top) and mainly oblique (bottom, from the right) lighting conditions.
Figure 12.7 illustrates the difference in white state reflectance of an electrophoretic e‐paper display (left) and a reflective LCD (right). The white reflectance of the latter is significantly smaller than that of the electrophoretic display. The white paper at the background (above or beneath the e‐paper display) appears brighter than either of the two displays. The photos show that a higher reflectance value is preferable for many applications, e.g. appearance.
12.4 Display Image Quality Parameters
To ease the description of image quality, the following paragraphs refer to luminance (as for emissive and front‐ or backlighted reflective displays) instead of reflectance. The optical appearance of displays is mostly measured by luminance (and derived parameters) and color (if applicable). Common references for all‐optical measurements are, e.g. [1, 2]. It is essential for image quality measurements for reflective displays to use the same setup, such as a sampling sphere with the specular included condition. Comparisons can only be made for exactly the same setup.
12.4.1 Luminance
Illuminance E (unit lx), reflected luminance LReflected (unit cd/m2) and the diffuse reflectance factor rD (dimensionless, see Figure 12.7), also referred to as the luminance factor) are related for diffuse reflective displays by the following equation:
Luminance measures the amount of light into a certain direction (here, measurement device or eye) emitted or reflected by a display or surface. The luminance of a display has to be adjusted to the eye adaptation to avoid dazzling or too dark images. The advantage of reflective displays is that this condition is fulfilled automatically (except for dark environments) when their reflectance is above 20% (the higher, the better) of a diffuse white standard or white paper. If the reflectance is low, e.g. 10%, the displayed image appears dark, and colors are hardly perceived or distinguished. The challenge for reflective color displays is to achieve a high reflectance in combination with a large color gamut (see below, [10]).
12.4.2 Contrast Ratio
A widely used measure for legibility is the contrast ratio [11]. It is defined by the luminance ratio of white (bright) to black (dark) content under darkroom conditions. If we illuminate the display under test, luminance is reflected from the display (mainly front surface but also transparent electrodes, etc.). This adds to both the bright and dark luminance:
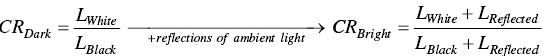
If we assume that the black luminance is significantly smaller than the value for white and the reflected luminance (here: of the surface, see Figure 12.2), Eq. (12.2) simplifies to
For displays with diffuse reflection characteristics as is typical for most e‐paper technologies, we can now substitute Eq. (12.1) into (12.2):

The goal is to design the contrast ratio as high as possible or reasonably. Therefore, the reflectance of the display (here: diffuse reflectance factor rD) should be maximized (e.g. 0.5 or 50%, this determines as well the visual appearance, see Figure 12.7) and the reflected luminance LReflected (of the front surface) minimized. The latter strongly depends mainly on the measurement geometry (see above), the front surface's reflectance characteristics, and reflection reducing layers. The contrast ratio can be measured from sequential measurements made on the same display area (e.g. first white than black) or at neighboring locations, which is more similar to human perception (see inset Figure 12.7 left). An imaging luminance (or color) meter is required for the latter. The typical contrast ratio CR for reflective displays is in the range of 10 : 1. ISO standard 15008 specifies a minimum CR of 2 : 1 for readability in the presence of bright ambient light.

Figure 12.8 Example of a character contrast ratio measurements using an imager (left) and the result plotted as relative luminance (right) compared to white paper.
Figure 12.8 illustrates the reflectance – luminance relationship for a numeric electrophoretic display and a measurement set‐up (left) similar to the daylight case of ISO 15008. Only diffuse (non‐specular) light is captured by the luminance imager. The graph on the right shows the measurement result as relative luminance as a function of position along the line from P to P (red, left). The display is surrounded a by white paper at each side, which acts as a reference with a measured reflectance of 90% of a white diffuse standard. The peaks at the left and right sides are caused by glossy reflections from the, display's edge seal. At bottom, the “modulated” waveform results from successive white and black regions with differing reflectance. The white state reflectance is about 30% (0.3), and the black is ~5%. This results in a measured intra‐character contrast ratio of about 6 : 1. The graph also demonstrates the advantages of using an imaging device: Inhomogeneities incl. Those from the illumination are easier to detect than when a spotmeter is used. If the measurement area of the black segments is small, viewing glare can significantly reduce the measured contrast ratio.
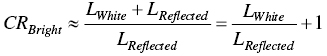
For a pure diffuse illumination as used in Figure 12.8, Eq. (12.2) has to be modified as the specularly reflected luminance is zero. Therefore, only the different luminance values for black and white have to be considered. They depend according to Eq. (12.1) on the diffuse reflectance factor rD, which has then to be indexed for black rD, K (K for black to avoid confusion with blue), and white rD, W. As the illuminance E is the same for both cases, the fraction reduces to

This proves that the contrast ratio for diffuse illumination of reflective displays is independent of the illuminance value.
The next step is to measure the contrast ratio for different illuminance levels, as shown in Figure 12.9. According to the equations above, CR should be independent of the illuminance E. This is proven by the measurements of the reflective e‐paper display. The slightly lower value for 50 lx is caused by reduced measurement accuracy for the black‐state luminance under dark conditions.
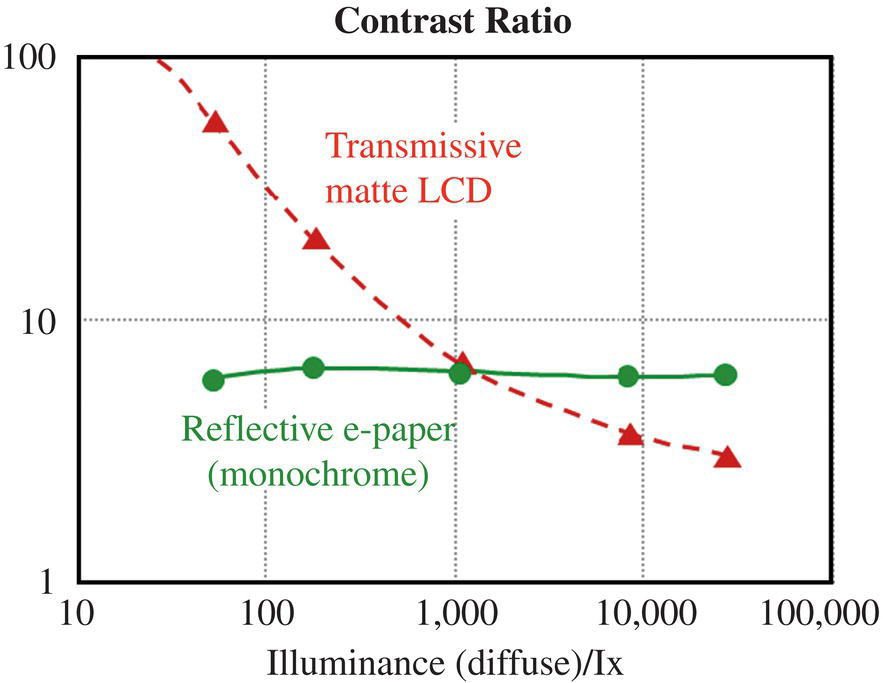
Figure 12.9 Comparison of the contrast ratio for diffuse illumination of a color LCD (red/dashed curve, “emissive”) and a reflective electrophoretic display (green/solid curve) at various illuminance levels.
So, reflective displays are even readable in bright sunlight. Emissive displays, exemplified here by a color LCD, show high CR values under dark conditions, but the reflected luminance increases with the illuminance. Therefore, the contrast ratio drops as illuminance rises, and in this case, is lower than for the reflective display when the illuminance is above 1,000 lx.
12.4.3 Gray Scale
Many reflective displays can render (color) gray scales. To match human perception, the luminance L – gray level GL relation has to be non‐linear. A typical function is L ~ (rel. GL)γ with γ termed the gamma coefficient. Its typical value is 2.2 and has to be measured for evaluation. This is done by measuring the luminance of 10 or more equidistant gray levels; it is recommended to make successive measurements at the same point on display to avoid the effects of illumination or inhomogeneity of the display. Luminance and gray levels are normalized to 1 and, e.g. plotted on a double logarithmic chart. The slope is the gamma value. This procedure is described in detail in [1, 2]. Deviations of the gamma curve result in the incorrect rendering of gray levels on display, which is most significant for graphic images and GUI elements
The number of available gray levels is a key issue for monochrome and color images. The gray scale resolution of reflective displays is typically lower than for emissive shows. Many reflective display technologies have 4 to 5‐bit resolution instead of 8 bit for emissive displays. The impact on color is discussed below.
12.4.4 Color
Most modern content to be reproduced by displays is colored. Monochrome displays are only accepted for a few applications such as meters or e‐books. The number of colors is typically between 4096 (3 × 4 bit, see above) and 32768 (3 × 5 bit), either of which is significantly fewer than for emissive displays for which a 24‐bit color depth is standard, resulting in 16.7 million colors. The other challenge for reflective displays is to render vivid colors, expressed by a large gamut in color measurements. The gamut and color coordinates are described in CIE (Commission International de l'Eclairage) color spaces such as CIE 1931, 1976 UCS, and CIE LAB. The principles, definitions, equations, charts, and measurement methods can be found in, e.g. [1, 2, 12].
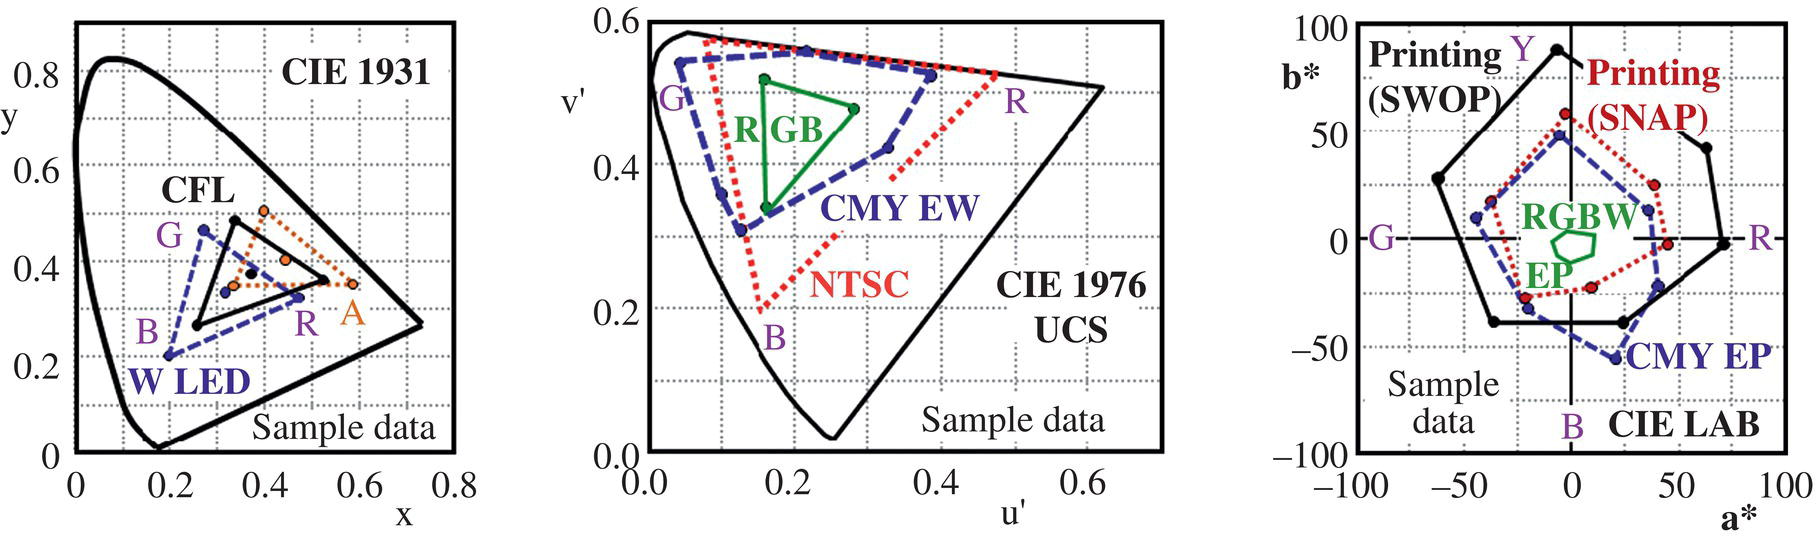
Figure 12.10 Color performance of reflective displays in various color spaces (here two‐dimensional): Left: Dependency of display RGB color co‐ordinates on the light source, plotted in the CIE 1931 color space; see main text for details of the sources. Center: Color gamut of RGB and CMY e‐paper in CIE 1976 UCS. Right: Color gamut of RGBW and CMY e‐paper in comparison with printing standards plotted in the CIE LAB color space.
The method to render color is very different for e‐paper displays compared to emissive types. An extended overview and comparison were published by Heikenfeld et al. [10]. Basically, the use of an RGB color filter (like for color LCDs) in an e‐paper panel results in low reflectance or low gamut (see Figure 12.6 right) when the density of the filters is lowered. Vertically stacked CMY (printer‐like, [13, 14]) displays achieve a larger color gamut at the expense of increased cost since three switchable layers are needed instead of one. Electrophoretic and similar displays can use either a color filter array (RGB, W) or colored particles; the latter currently results in a long image update duration (~10 seconds).
Figure 12.10 shows three examples demonstrating various aspects of color reproduction of reflective displays. The left chart uses the CIE 1931 color space, and the color coordinates x, y are plotted for the red (R), green (G), blue (B), and white (filled circles) points of the display, here RGB electrokinetic samples were used. All color measurement devices provide such x, y co‐ordinates as an output option. The co‐ordinates of RGB are connected by lines for each light source. The white point is represented by a circle inside the corresponding triangle of the same color/filled circle. The chart clearly shows that the color reproduction of reflective displays depends strongly on the light source. Three examples are provided here: A white LED (W LED), a cold cathode fluorescent tube (CFL, neon lamp), and an incandescent light source (A, CIE illuminant A). The third co‐ordinate is the luminance, which is usually not plotted.
The CIE 1976 uniform color space (UCS) (white point 0.20/0.47, luminance not shown) is recommended for modern display evaluation and is shown as a 2D plot in the centre panel of Figure 12.10. The red/dotted triangle illustrates the NTSC color TV standard. The blue/dashed hexagon show the color gamut of an electro‐wetting display where cyan, magenta, and yellow layers are stacked (subtractive primary colors parallel those used in printing). The green/solid triangle refer to a reflective display that incorporates an RGB mosaic filter. The measured points span a triangle or hexagon, whose size corresponds to the gamut and is often expressed as a percentage of the NTSC area. The larger the gamut (area) is, the more vivid are the reproduced colors.
CIELAB is better suitable for judging the color performance of reflective displays and conventionally printed products than CIE 1931 or CIE 1976 UCS: It is based on lightness L* (equals the perceived brightness) instead of luminance L. The color coordinates are expressed by a* and b*. Figure 12.10 right plots CIE LAB as two‐dimensional (2D) graph for a* and b*. Also, three‐dimensional (3D) charts, as provided in, e.g. [13], are used to compare color gamut. However, 3D plots are difficult to compare by vision except for their size.
The printing standards SNAP (Specification for Newsprint Advertising Production, red/dotted) and SWOP (Specification for Web Offset Publications, black/solid) are used in Figure 12.10 right to compare printing requirements to the color gamut of reflective displays. The sample data show that RGBW color filter (CFA) displays (green/solid line) have a smaller gamut compared to stacked CMY (blue/dashed) approaches and to printing standards.
All color measurements must take into account the spectral characteristics of reflective displays and light sources. However, the spectral dependencies cannot by derived “backward” from CIE coordinates. For example, a white point of 0.33/0.33 can be achieved with various light sources like a white LED, RGB LED, fluorescent tubes, and RGB lasers. However, the three lasers (RGB) do not emit any light in, e.g. the yellow region, so any yellow particle of a reflective display appears black. Another example is white (W) LEDs: They consist of a blue LED as emitter and phosphors which (activated by blue) emit either yellow or red and green light. The CIE color coordinates of different W LEDs can be the same, but the spectral characteristics are different. Therefore, spectral corrections must be made if reflective displays are evaluated using reference light sources different from those practical lights used for illumination of those displays in ordinary use.
Summarizing: The color image quality of reflective displays is typically lower than for emissive displays. However, the color performance of reflective displays should preferably be expressed by 3D color spaces such as CIE LAB (used in the printing industry)nd lightness as a parameter. Many improvements are underway to reach applications currently occupied by LCDs and LEDs.
12.5 Temporal Parameters
Another important characteristic of displays is their temporal behavior. This extends from the short durations required for image update to a timespan of years for the lifetime of a display in an application. The references [1, 2] provide details on definitions and measurements.
12.5.1 Switching Time
An update of content on display should not be noticeable. The switching time (often called response time) is usually measured by a photodiode and an oscilloscope. The duration is defined for an It is defined as the time required to switch the content from black (K) to white (W) or vice versa (W ↔ K) for the optical transition between 10% and 90% of the white luminance. A response time in the range of 10 ms or less is labeled as “video speed” and can be achieved by several reflective display technologies such as electro‐wetting [15] as well as by emissive technologies. Reflective LCDs (mostly Twisted Nematic type) are mostly monochrome and show switching speeds in the range of 50 ms at 25 °C and 1,000 ms at −20 °C.
Display technologies using moveable particles show mostly longer update durations, partly due to complex driving waveforms used in electrophoretic devices to avoid any retention of “ghost” images carried over from the previous frame. Figure 12.11 shows the two image update methods for an industrial electrophoretic display: Full (left) and partial (right) refresh. A complete update without accumulating artifacts over time requires multiple different images with “opposite color” (here black or white) and lasts several seconds. This “flashing” or “flickering” is rated as annoying by observers. E‐book readers perform this task in the range of 0.5 seconds, some of them without switching to the inverse image. This can be achieved for parts of the image for industrial displays and is called “partial image update” (right). Depending on the technology and the quality of the waveforms, previous content is not fully “deleted,” so a complete refresh is needed after several partial image updates. Color electrophoretic displays with many different particles (e.g. CMYWK) require about 10 seconds to complete an image update.
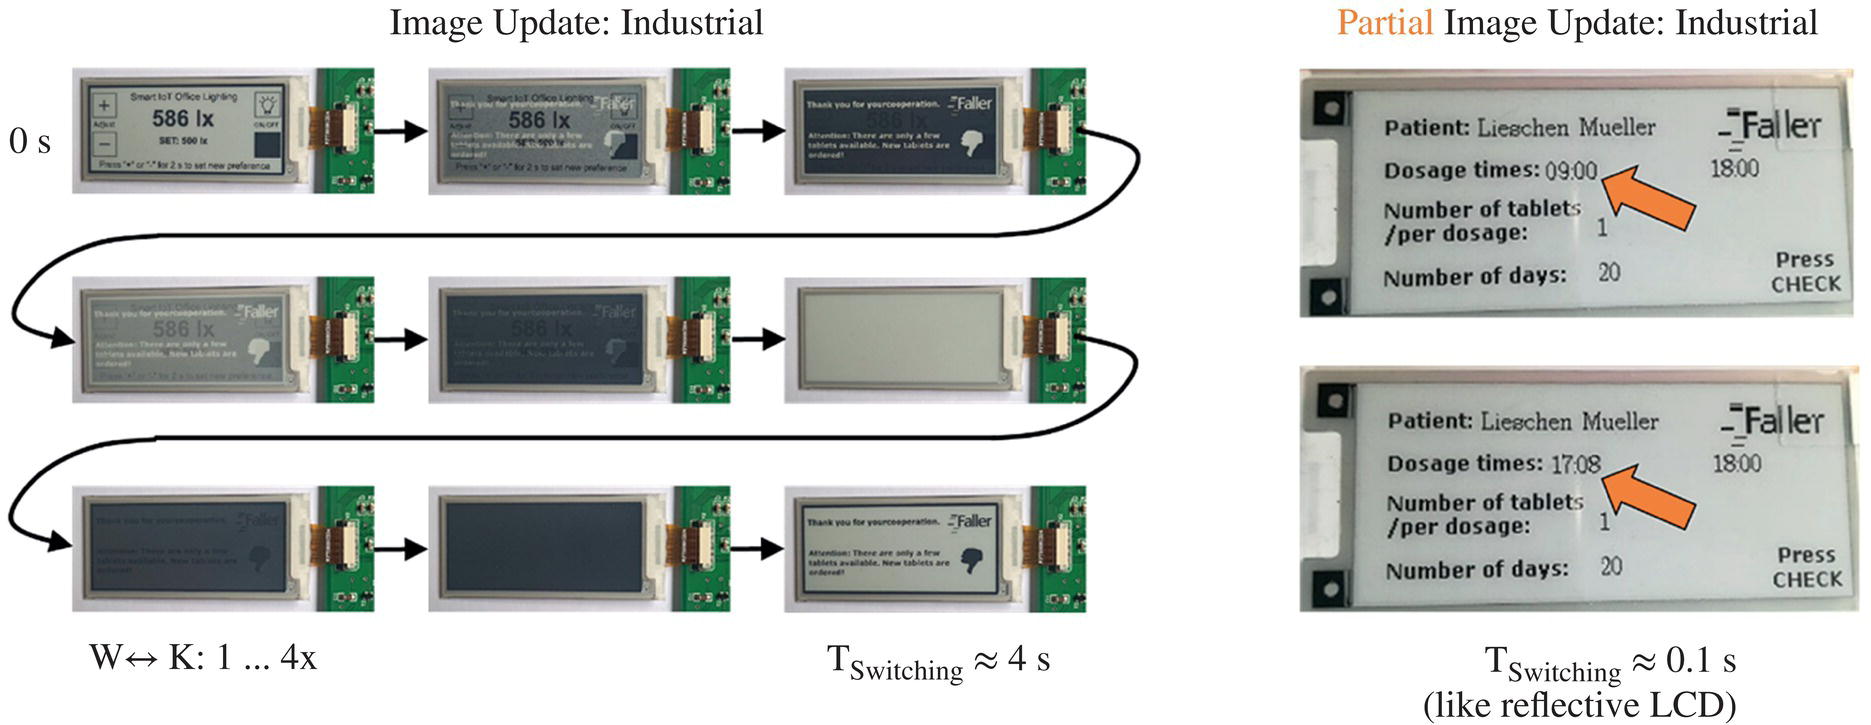
Figure 12.11 Standard updating of a professional electrophoretic display (left, whole content) and partial image update (right, orange arrow: time).
12.5.2 Bi‐stability
Some e‐paper technologies such as electrophoretic are bi‐stable: The content is written to the display once and persists over hours to years without any power or refresh (see above); emissive displays are usually updated at 60 Hz even when the content does not change. This makes the e‐paper displays “green” as no power is required, either for light generation or image data update by, e.g. the graphics adapter or panel electronics.
Some applications need to measure the temporal characteristic of the bi‐stability, e.g. the time taken for the contrast ratio of a character (e.g. white background vs. black character, see above and insets “1” in Figure 12.12) to fade to a defined threshold, e.g. 2 : 1. Furthermore, the color of bi‐stable displays can change over time without refresh. A typical effect of tri‐color (black, white, and, e.g. red) electrophoretic displays is that the white background becomes reddish over 100's of hours without refresh.
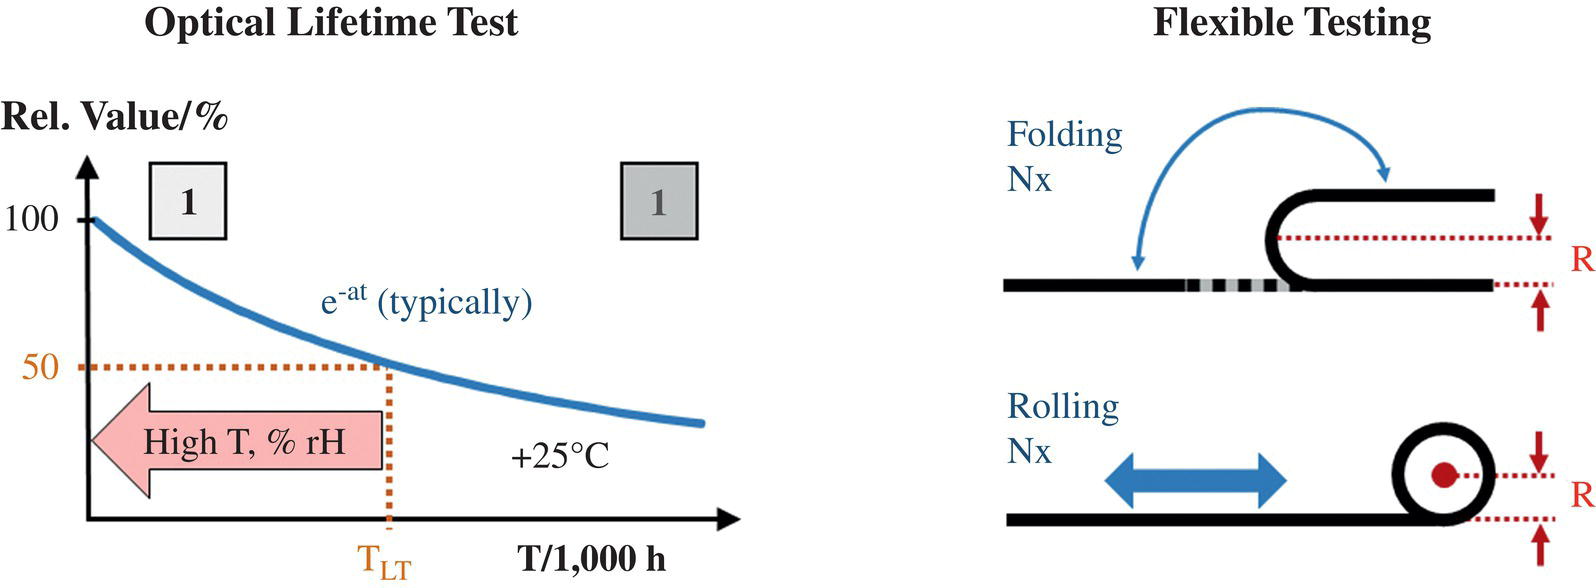
Figure 12.12 Lifetime testing: Left: Typical reduction of reflectance (e.g. measured as luminance) over time Right: Repeated folding and rolling of flexible display.
12.5.3 Lifetime
Like all other technical products, displays should reach a defined lifetime or operational time required for the intended application within the defined temperature and humidity range. As there is a huge variety of e‐paper display technologies, the fundamental principle is illustrated in Figure 12.12 left: The lifetime is defined as the duration taken for a chosen parameter to reach half of its initial value. This could refer to, e.g. reflectance, luminance, or contrast ratio. The insets with a black “1” in a square show a potential degradation mechanism: The light gray (white) background darkens over time, e.g. due to chemical processes. So the essential image quality parameters degrade. Typical lifetime data refer to operation at 25 °C and under moderate humidity (25 °C, ~50% rH, also named “room conditions”). Many degradation effects follow an exponential decay. The lifetime is significantly reduced compared to room conditions by high temperatures (e.g. 60 °C) and/or high humidity (e.g. 90%) [16].
12.5.4 Flexible Displays
Many e‐paper displays can be made flexible, in which category we include foldable or rollable devices (Figure 12.12 right). When the display is repeatedly mechanically flexed, degradations are likely to occur. Examples are cracks in the sealing and layers, leading to the breakage of data lines to pixels. The smaller is the bend radius R, the more challenging is the development and manufacturing of flexible displays. The quality criterion is the number N of folding or rolling operations until a failure occurs or the minimum number without failure.
12.6 Further Topics
Besides the above‐described methods and criteria for display and image quality, many other measurements and tests (see [1, 2]) exist, such as
- Uniformity of the displays in terms of reflectance, luminance, color, etc.
- Ghosting of content into neighboring areas
- Luminance and color of potential front‐ and backlights [17]
- Viewing angle degradation when the display is observed from oblique angles incl. stacked displays [8, 18]
- Defective pixels of a display
- Power consumption
- Operation in a harsh environment incl. vibration and shock
12.7 Summary
Optical measurements of reflective displays are more challenging than for emissive technologies. That is because reflective displays, must be illuminated, and the results depend on the measurement set‐up. Therefore, comparisons of datasheets and measurement results require special attention. The most important parameter of the reflective display is their reflectance, which affects the perceived image quality. The reproduction of color images is, for many technologies, not so good compared to emissive displays. It is often not required to perform all possible evaluation methods and measurements but concentrates on the most essential application.
Glossary incl. Abbreviations
- BRD
- FBi‐directional Reflectance Distribution Function
- CIE
- Commission International de l’Eclairage
- CR
- Contrast ratio
- E
- Illuminance
- Gamma
- Exponent of luminance gray level dependency
- Gamut
- Area within a 2D color space which can be rendered by a display
- GL
- Gray level (digital value)
- L
- Luminance
- R
- Reflectance (factor)
- SE
- Specular excluded
- SI
- Specular included
References
- 1 Society for Information Display (SID). (2012). Information Display Measurements Standard. https://www.sid.org/Publications/ICDM.aspx.
- 2 Blankenbach, K. (2016). Section XI display metrology. In: Handbook of Visual Display Technologies, (ed. J. Chen, W. Cranton and M. Fihn), 3071–3226, 3263–3282; 3313–3334. Heidelberg: Springer.
- 3 Becker, M.E. (2006). Display reflectance: basics, measurement, and rating. J. Soc. Inf. Disp. 14: 1003–1017. https://doi.org/10.1889/1.2393025.
- 4 Kelley, E.F., Jones, G.R., and Germer, T.A. (1998). Display reflectance model based on the BRDF. Displays 19 (1): 27–34.
- 5 Hertel, D. and Penczek, J. (2020). Evaluating display reflections in reflective displays and beyond. SID Inf. Disp. 2: 14–24.
- 6 Hertel, D. (2018). Application of the optical measurement methodologies of IEC and ISO standards to reflective E‐paper displays. SID Symp. Dig. Tech. Pap. 49: 161–164. https://doi.org/10.1002/sdtp.12509.
- 7 IEC 62679‐3‐1. (2014). Electronic Paper Displays: Optical measuring methods, part 3‐1.
- 8 Hertel, D. (2012). Viewing angle measurements on reflective E‐paper displays. SID Symp. Dig. Tech. Pap. 43: 46–49. https://doi.org/10.1002/j.2168‐0159.2012.tb05705.x.
- 9 Becker, M.E. and Neumeier, J. (2016). Imaging light measurement devices. In: Handbook of Visual Display Technologies (ed. J. Chen, W. Cranton and M. Fihn), 3285–3312. Heidelberg: Springer.
- 10 Heikenfeld, J., Drzaic, P., Yeo, J.‐S., and Koch, T. (2011). Review paper: a critical review of the present and future prospects for electronic paper. J. Soc. Inf. Disp. 19: 129–156. https://doi.org/10.1889/JSID19.2.129.
- 11 Kelley, E.F., Lindfors, M., and Penczek, J. (2006). Display daylight ambient contrast measurement methods and daylight readability. J. Soc. Inf. Disp. 14: 1019–1030. https://doi.org/10.1889/1.2393026.
- 12 Nose, M. and Yoshihara, T. (2012). Quantification of image quality for color electronic paper. J. Soc. Inf. Disp. 20: 624–631. https://doi.org/10.1002/jsid.128.
- 13 Henzen, A., Zhou, G., and Zhong, B. (2020). Color reproduction in reflective displays: stacked CMY. SID Symp. Dig. Tech. Pap. 51: 719–721. https://doi.org/10.1002/sdtp.13969.
- 14 Blankenbach, K., Rawert, J. (2011). Bistable electrowetting displays. In Proceedings of SPIE 7956, Advances in Display Technologies; and E‐papers and Flexible Displays, 795609 (3 February 2011). https://doi.org/10.1117/12.871039.
- 15 Deng, Y., Tang, B., Henzen, A., and Zhou, G.F. (2017). Recent progress in video electronic paper displays based on electro‐fluidic technology. SID Symp. Dig. Tech. Pap. 48: 535–538. https://doi.org/10.1002/sdtp.11695.
- 16 Wu, M., Luo, Y., Wu, F. et al. (2020). Lifetime prediction model of electrophoretic display based on high temperature and high humidity test. J. Soc. Inf. Disp. 28: 731–743. https://doi.org/10.1002/jsid.869.
- 17 Wang, X., Qin, G., Tan, J. et al. (2015). A study on the front light guide used in color reflective LCDs. SID Symp. Dig. Tech. Pap. 46: 466–468. https://doi.org/10.1002/sdtp.10424.
- 18 Hertel, D. (2013). Viewing direction measurements on flat and curved flexible E‐paper displays. J. Soc. Inf. Disp. 21: 239–248. https://doi.org/10.1002/jsid.163.