
Intel® VTune™ Amplifier XE
Abstract
This chapter covers the Intel® Vtune™ Amplifier XE performance analyzer. The first section covers the installation and configuration of the system and kernel drivers. The second section covers how to use this tool for data collection and reporting. Both the command-line and graphical user interfaces are covered.
Intel® VTune™ Amplifier XE is a powerful cross-platform profiler capable of performing algorithmic analysis, PMU sampling, and power analysis. The tool is comprised of a few different components, including a set of Linux kernel drivers, which are responsible for performing the actual data collection, as well as both command-line and GUI tools for controlling the drivers and generating reports.
By default, VTune installs a significant amount of documentation into ${VTUNE_INSTALL}/documentation. This includes detailed walkthroughs and guides for collecting data and analyzing the result. Additionally, the documentation also provides a series of reference documents, including a reference of event metrics and their meanings, as well as a copy of the second volume of the Intel® Software Developer Manual, listing all of the instructions and their encodings.
Once installed, updates to VTune are conducted through the Intel® Software Manager, which is typically installed to /opt/intel/ism. Through this Java application it is possible to download and install updates to all Intel software products as soon as they are released. Typically, VTune releases are grouped into optional and recommended updates. Optional updates occur more frequently and provide earlier access to new features. On the other hand, recommended updates occur less frequently, and combine all of the previous optional updates. As a result, the optional updates are designed for users interested in the latest functionality, while recommended updates are designed for users interested in only updating occasionally.
At the time of this writing, a VTune license for noncommercial use on Linux can be obtained for free. For more information about both the tool and the commercial and noncommercial licensing, visit the VTune website at https://software.intel.com/en-us/intel-vtune-amplifier-xe.
7.1 Installation and Configuration
VTune provides its own out-of-tree Linux kernel drivers for collecting system information and programming the PMU. The source code for these drivers is shipped with VTune and can be found in the ${VTUNE_INSTALL}/sepdk/ directory. This allows for the driver modules to be built for the system’s current kernel version.
As part of the default installation process, the installation script will automatically build the driver modules and will install an init script that inserts the modules into the kernel at boot. One or both of these steps can be skipped during the installation by selecting to customize the installation and then deselecting the desired steps. In order to be as portable across as many distributions as possible, the init script generated is designed to be compatible with the legacy sysv init system. Modern init systems, such as systemd, provide backward compatibility with these old style scripts, and therefore work as well.
There are three driver modules that must be loaded before collection can begin. The first module, pax, handles multiplexing a single PMU between multiple processes. This driver creates a pax special device file in /dev/pax. Each VTune process that needs to access the PMU will first open this device file and use its ioctl(2) interface to reserve and unreserve the PMU for the given process. This locking mechanism prevents one process from interfering with the profiling of another.
The second module, sep, handles the actual PMU event programming. It is often referenced as sepX_Y, where X and Y represent the major and minor driver version numbers. The sep driver provides its own APIC interrupt handler for handling PMU events and also handles all of the architectural-specific aspects of programming events and configuring the system for profiling. This driver creates a directory, /dev/sepX_Y/, where a special device file is created per-cpu for sampling. For example:
The third module, vtsspp, is responsible for monitoring process execution. This driver records the specifics of the process being monitored, such as the stack traces, the registers, and so on. This information is then correlated with the information from the PMU interrupts in order to attribute PMU events to ELF files, functions, and lines of code. This driver exposes a configuration directory within the proc filesystem. For instance:
In earlier versions of VTune, there was also a fourth driver, apwr.ko, which was part of the powerdk, as opposed to the sepdk, to which the other three drivers belong. This driver was used for measuring some power metrics, but was recently removed due to lack of usage. If the reader depends on this driver, the author recommends contacting Intel support.
7.1.1 Building the Kernel Modules
In order to build the three sepdk drivers manually, there is a script entitled build-driver located at ${VTUNE_INSTALL}/sepdk/src. Before running this script, ensure that the proper development tools, including GCC, GNU make, and the kernel development package, are installed. Additionally, check the VTune release notes to determine whether the kernel version is supported. Typically VTune tracks the latest distros, such as Fedora, Ubuntu, and RHEL.
Running the build-driver script will build all three drivers, although there are also build-driver scripts within the vtsspp and pax subdirectories. By default, these scripts are all interactive, prompting the user for which compiler to use, the path to the kernel source tree, and where to install the results. The script can also be run noninteractively with the --non-interactive command-line argument. In non-interactive mode, the defaults for each option will be used, unless a different value is specified via command-line arguments. A full list of these arguments, such as --c-compiler=, --kernel-src-dir=, or --install-dir, can be obtained by running build-driver --help. In the case where the build fails on a newer kernel, contact Intel support.
Once the driver modules are successfully built, they can be manually inserted into the kernel, or the init system can be configured to automatically insert them at boot. In the same directory as the build-driver script, there is also a script named boot-script. This script will automatically generate an sysv-style init script and then add it to the default runlevel for the system.
Since the drivers are modules, it’s simple to test if the boot script works. Simply reboot and then check whether the modules were automatically loaded. This can be done by checking the list of currently inserted modules and looking for the three belonging to the sepdk. For example:
7.1.2 System Configuration
Due to the visibility into the system provided, access to these drivers is restricted to a specific group. This groups is typically named vtune, although that name can be overridden when creating the boot script. All user accounts that want to use VTune will need to be added to this group. The simplest method for determining the group name is to check the log generated by the kernel drivers as they are inserted. An example of this log is presented in Listing 7.1

.
Notice, on line 10 of this listing, that the group name is given as “vtune,” the default. Therefore, any uses wishing to perform data collection with these drivers will need to be a member of the vtune group. For instance, in order to add a user, jtk, into the vtune group:
Remember that a user must completely log out of the system before any group updates take effect.
Additionally, data collection requires that the kernel’s NMI watchdog and kernel pointer hiding functionality are disabled. The NMI, nonmaskable interrupt, watchdog timer programs a reoccurring APIC timer in order to detect if the kernel has become unresponsive. From the generation of the interrupt, the kernel has a certain time threshold to handle the interrupt. If this threshold is exceeded, the kernel is considered to be deadlocked, and the system is rebooted. Since the NMI watchdog uses the PMU to measure this threshold, it conflicts with any application that uses the PMU. This feature can be disabled either by adding nmi_watchdog=0 to the kernel boot command-line, by writing a zero character to the file /proc/sys/kernel/ nmi_watchdog, or by setting the kernel.nmi_watchdog sysctl property to zero.
The kernel pointer hiding functionality controls how the kernel prints addresses, both in logs and system files. With this feature enabled, unless the user has the necessary privileges, all kernel pointer addresses are printed as NULL. This is designed to improve security by hiding the exact location of some of the kernel’s data structures. At the same time, this makes it difficult to correlate the collected instruction pointers to kernel functions. This feature can be disabled either by setting the kernel.kptr_restrict sysctl property to zero, or by writing a zero character to the file /proc/sys/kernel/kptr_restrict. For example:
The status of both of these features can quickly be queried with the sysctl command:
The final step of configuration is to modify the system’s environment variables to reflect the new binaries, man pages, and so on. This step is automated by the amplxe-vars.sh and amplxe-vars.csh scripts, which should be sourced in the shell’s startup file. The amplxe-vars.sh script is designed for shells based on the POSIX sh shell, including the popular bash shell. The amplxe-vars.csh script is designed for shells based on the C shell, such as tcsh.
7.2 Data Collection and Reporting
Once the kernel drivers are installed and the system has been configured accordingly, data collection and reporting are now possible. There are two primary interfaces for interacting with the VTune data collection drivers, a command-line interface, amplxe-cl, and the GTK GUI, amplxe-gui. Both of these interfaces are fully functional, as typically the GUI just invokes the command-line interface for data collection anyway, although data reporting with the command-line interface is more Spartan and lacks the guidance the GUI provides when interpreting results.
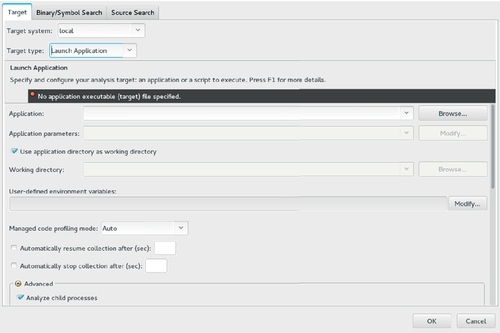
For the graphical interface, all configurations are controlled through a XML project file, suffixed with .amplxeproj. When a new project is created, a dialog box prompts the user with the available configuration options. These results are saved into the project XML file and then utilized across each analysis session. Figure 7.1 is a screenshot of this dialog box. These configuration options can be changed at any time by right clicking on the project name within the Project Navigator window and selecting the Properties context menu item. Any change made to the project’s configuration will not be reflected within the preexisting analyses until those results are reanalyzed. Within the GUI, this is performed by right-clicking on the analysis name in the Project Navigator window and selecting the Re-resolve action context menu item.
On the other hand, the command-line interface does not use the project files created by the GUI, nor does it create its own. Instead, each configuration option must be specified as a command-line argument. The author assumes this is because the command-line interface yields itself well to scripting, so any functionality provided by a project file can be replicated, with less effort, through the creation of a shell script.
The comprehensive list of available configuration options and their meanings can be found in either the VTune documentation, the man pages for each command, or through the help command built into the command-line tool. For example, executing amplxe-cl -help will list the available actions, while executing amplxe-cl -help collect will list all of the possible configuration options for that specific action.
At the time of this writing, there are eight actions available in the command line interface. For most profiling situations, knowledge of only two of these actions is necessary. These include the collect action, which performs the actual data collection, and the report action, which summarizes the data collected during the collect action in a human readable format.
7.2.1 Collect Action
The data collected is determined by the specified analysis type. In order to simplify data collection, VTune combines the basic building blocks of data collection into a high-level structure known as an analysis type. An analysis type is comprised of one or more data points, typically PMU events although other metrics are supported, along with “knobs” for controlling the behavior of the data collection. Through the use of analysis types, VTune simplifies the process of creating, running, and sharing complicated performance analyses.
VTune provides a set of predefined analysis types designed by Intel engineers to cover the most common profiling situations. Additionally, the user is free to create their own custom analysis types. Each analysis type is defined in an XML file. The predefined types are located at ${VTUNE_INSTALL}/config/analysis_type, while the user’s custom types are defined in ${HOME}/.intel/amplxe/analysis_type.
Each analysis is categorized as either an algorithmic analysis or a microarchitectural analysis. In general, the algorithmic analyses are available for most x86 processors, while the microarchitectural analyses depend on features present in only some PMUs. As a result, the microarchitectural analyses are further divided into Intel hardware generations. Not all processor SKUs within a hardware generation support all of the PMU features required for every analysis within that generation’s category. When performing microarchitectural analysis, the general-exploration analysis type is a good starting point, since it is designed to automatically perform the Top-Down profiling methodology described in Section 6.2.
The analysis type is a required argument for the command-line interface and should immediately follow the -collect argument. The last argument provided should be the command to profile. For instance, if the bandwidth analysis type was desired to be run on the executable foo, the command invocation, without any further configurations, would be amplxe-cl -collect bandwidth foo. Additionally, VTune is capable of attaching to an existing process. In lieu of providing the command to execute, the -target-pid or -target-process arguments specify the pid or name of the existing process to attach to.
Once the collection has completed, a results directory will be created. The name of this directory will be comprised of three separate components. The first component is the lower case letter “r.” The second component is a three-digit number, representing the analysis number. Finally, the third component is an abbreviation of the analysis type. Continuing the previous example with the knowledge that the bandwidth analysis is abbreviated as bw, the first run would produce a directory named r000bw, the second run would produce a directory named r001bw, and so on.
In the graphical interface, data collection begins by right-clicking on the project name in the Project Navigator window and selecting the New Analysis context menu item, or by clicking on the menubar shortcut that resembles an orange triangle pointing to the right. This will then open a hierarchical list of the available analysis types and their subsequent configuration options. Figure 7.2 illustrates this window.

Notice that in the bottom right side of the window is a button labeled Command Line. Selecting this button will display the exact amplxe-cl command that will be executed. This can be used to determine how the GUI is performing some actions.
Configuration
Between the -collect argument and the final argument, the application to profile, are the configuration options that control how the analysis occurs and is interpreted. In the graphical interface, all of these configuration items are set within the project properties.
Typically, the user wants to correlate data samples from memory addresses to lines of source code. In order for this to work properly, the user needs to specify where the source and binary files are located. The -source-search-dir=dir argument adds dir to the source search path. The -search-dir=dir argument adds dir to the binary search path. Both of these arguments may be duplicated as many times as necessary.
As discussed in Chapter 6, the PMU can only monitor a limited number of events simultaneously. As a result, there are a number of techniques for handling the situation where more events are specified to be collected than can be enabled simultaneously. In this situation, the set of events is partitioned into a series of subsets capable of being programmed together. If the program can execute only once, as is the case with the default VTune data collection, these subsets take turns being enabled on the PMU. The -allow-multiple-runs argument allows for the data collection to run multiple times, each time with a different subset of the events active. As a result, this option minimizes the error of multiplexing the events. Obviously for this to work correctly, the executable must be capable of executing repeatedly without user interaction between runs.
When profiling with sampling, it is necessary to determine an appropriate sampling frequency, that is, how frequently the PMU events should be collected. Some analysis types support a configuration option, referred to as a knob, that controls the sampling interval. This knob, sampling-interval, specifies the number of milliseconds between collections, ranging from 1 to 1000 ms. The default interval is 10 ms. Not all analysis types support the sampling-interval knob. This, along with other knobs supported by the analysis type, can be configured via the -knob name=value command-line argument. For example, in order to increase the sampling interval to 100 ms for an advanced-hotspots analysis type, the command would look like amplxe-cl -collect advanced-hotspots -knob sampling-interval=100.
In order to simplify the configuration of the sampling interval, VTune also exposes a -target-duration-type=category command-line argument. This argument is supported for all analysis types, regardless of whether they support the sampling-interval knob. Rather than specifying an exact interval, the user categorizes the estimated duration of the application’s execution. Based on this category, VTune automatically configures the internal collection intervals. There are four duration categories. The first category, veryshort, specifies that the program executionis shorter than 1 min. The second category, short, specifies that the program execution is longer than 1 min, but shorter than 15 min. This category is the default. The third category, medium, specifies that the program execution is longer than 15 min, but shorter than 3 h. The fourth category, long, specifies that the program execution is longer than 3 h. For example, rather than worrying about specifying the exact sampling interval, selecting the proper sampling interval for an advanced-hotspots analysis on an application that takes 5 min to run is as simple as specifying amplxe-cl -collect advanced-hotspots -target-duration-type=short.
The default data collection configuration only monitors the process given on the command-line. For some cases, this is acceptable, but for other cases a more global view of the system is required. In this case, the -analyze-system argument expands data collection to every process on the system. This argument can be combined with a nop executable, like sleep(1), in order to ascertain which processes on the system are consuming CPU time. Additionally, VTune supports a -duration=nsec argument that essentially does the same thing. In other words, amplxe-cl -collect bandwidth -analyze-system sleep 15 is essentially the same as amplxe-cl -collect bandwidth -analyze-system -duration 15.
The -call-stack-mode=mode argument filters which functions should appear in the stack traces. There are three valid values for mode. The first mode, user-only, only records functions present within the profiled executable. As a result, kernel functions won’t appear in the trace. This is the default mode. The second mode, user-plus-one, records all of the functions that would be recorded in user-only mode, but also any kernel functions directly invoked by the application. As a result, this mode shows where the call stack invokes the kernel, but filters out any of the internal kernel function call chains. The third mode, all, records all functions, both within the application and the kernel.
Additionally, inlined functions can be included within the call stack via the -inline-mode=on, or excluded via -inline-mode=off, command line argument.
By default, all data collection is performed on the local system; however, VTune also supports remote data collection over the SSH and ADB (Android Debug Bridge) protocols. At the time of this writing, the ADB protocol is only supported in the version of VTune provided with Intel® System Studio. With remote data collection, the collect action will be specified on the host system, the data will be collected on the remote system, and then the results will be copied back to the host system for local analysis.
In order for remote data collection to work, the data collection kernel modules that were described in Section 7.1 must be installed and enabled on the remote system. When profiling a remote embedded device, it’s probably easier to build the data collection drivers on the host system, and then add them into the system image that will be provisioned on the device. Additionally, in order to fit within size constraints, it is possible to skip the installation of the graphical interface tools and libraries. Within the VTune install tarball, there is a directory named CLI_Install. This directory contains the install scripts and files required for a minimal installation, consisting of only the command-line tools and data collection drivers. These files can either be installed directly into the system image for the remote device before provisioning, or physically copied onto the remote device and installed manually.
Once the remote system is configured for data collection, and for the remote protocol, data collection can begin on the host system by specifying the protocol, username, and hostname or IP address of the remote system via the -target-system argument. For SSH, the argument is formatted as ssh:user@hostname. For ADB, the argument is formatted as android:devicename.
7.2.2 Finalize Action
Once data collection has finished, there is an intermediate step required before the results can be translated into a human readable report. First, the results must be finalized or, in the parlance of the GUI, resolved.
During this stage, the raw data that was collected is cooked, attributing data samples to specific ELF symbols and calculating the associated metrics for the report phase. Typically, this step is automatically run at the end of the collect action, unless the -no-auto-finalize argument was provided. Regardless, there are situations where it may be desirable to refinalize the results manually. The most common of these situations is the case where the previous finalization did not have the proper symbol information, leading to a less than optimal report.
Because finalization typically happens automatically after the collect action, most of the collect arguments relating to correlating or reporting data are also supported by the finalize command. These include the -search-dir and -source-search-dir commands for choosing the source and binary files for analysis. Additionally, arguments like -inline-mode and -call-stack-mode can be selected in order to further filter the data results.
The -result-dir argument specifies the result directory to finalize. If this argument is omitted, the latest result is selected. For example, if the result r000bw needed to be refinalized to add the source directory foo/src, the command would look like amplxe-cl -finalize -result-dir r000bw -source-search-dir foo/src.
7.2.3 Report Action
Once the results have been collected and finalized, they are ready to be converted into a human readable format. While reporting is an area where the graphical interface really excels with advanced features, both the graphical and command-line interfaces are sufficient for conducting analysis on results.
Command-line interface
With the command-line interface, the various result metrics are viewed with text reports. Each of these reports utilize a predefined set of metrics, and therefore are only useful when applied to the results of an analysis type that collects those metrics. Just like the finalize command, a specific result can be specified with the -result-dir argument. If multiple -result-dir arguments are present, the results are compared, and each report, along with their deltas, are reported. The reports that ship with VTune can be found in ${VTUNE_INSTALL}/config/report, and custom user reports can be created in ${HOME}/.intel/amplxe/report. The list of currently available reports can be found with the built-in help command, as seen in Listing 7.2.

Further details about each of these reports can be found either in the VTune documentation or with the built-in help command. For instance, in order to get more information about the callstacks report, and its supported options, execute the command amplxe-cl -help report callstacks.
The summary report type is a good starting point for most analyses. It displays the metrics calculated by the analysis type, and a summary of the event counts. For example, when run on a general-exploration analysis, the summary report will print the percentages for each Top-Down category. This can be seen in Listing 7.5.
For analysis types that perform sampling, there are four useful reports for identifying which functions consumed the most CPU time. The first, the hotspots report type, displays the time accounted to each function, excluding functions called from within that function. This report is sorted so that the functions that consume the most time are toward the top of the list. The second, the top-down report type, displays both the time spent within each function, and the percentage of total time spent within that function, including functions called from within that function. This report is sorted so that the functions responsible for the greatest percentage of total CPU time are toward the top of the list. The third, the callstacks report type, and the fourth, the gprof-cc report type, provide additional information about the stack traces associated with the hotspots.
By default, reports typically group items at a function-level granularity. The grouping can be changed with the -group-by argument. The available groupings supported by each report type will be listed in their respective help page. One of the most useful of these is the source-line grouping, which correlates each hotspot to a specific line of code. When interpreting this information, remember to account for potential PMU skid. Listing 7.3 illustrates the default function grouping for a hotspots report run on data collected with a general-exploration analysis type. On the other hand, Listing 7.4 illustrates the same data and report, but grouped by source code line.


Graphical interface
In general, the graphical user interface is very flexible, with reporting formats changing depending on the data collected, the viewpoint, and many other user configurable options. As a result, it is not productive to attempt to document all of these interfaces and their meanings. Instead, this section attempts to highlight some important points and explain the general concepts. If more detail is required, either check the VTune documentation or contact Intel support.
As mentioned earlier, reporting is an area where the graphical interface really excels. VTune is programmed with the normal thresholds for each metric and will use these thresholds to automatically highlight any abnormalities. Additionally, almost every metric and category provides a detailed explanation on mouseover. As a result, the graphical interface provides a lot more guidance, in terms of making suggestions to the analyst about what to investigate.
Consider the example Bottom-Up report displayed in Figure 7.3. The graphical interface is partitioned into two parts, the data table at the top of the screen, and a timeline at the bottom of the screen.

Within the data table, the results of the report are summarized. The data fields displayed vary, depending on what data was collected by the analysis type. How the data is summarized depends on the viewpoint. The current viewpoint, which in Figure 7.3 is the “General Exploration viewpoint,” is displayed below the top toolbar, but above the individual report windows. Selecting the “change” button next to the viewpoint will show the list of available viewpoints for the current analysis type. For example, during this General Exploration analysis, the collect-memory-bandwidth knob was enabled. As a result, a memory bandwidth view is available, and can be seen in Figure 7.4. This viewpoint is completely different from the previous one, with graphics highlighting the total, read, and write memory bandwidth measured during data collection. Below this graph is a different data table, with fields relevant to the memory analysis.

Some data fields have an arrow in the top right corner of their header. An arrow pointing to the right indicates that this field contains subcategories. Clicking the right-pointing arrow will expand the field, thereby exposing the subfields. An already expanded field will have an arrow pointing to the left. Clicking the left-pointing arrow will contract the fields, leaving only the parent field exposed.
Other data fields have a yellow star in the top right corner of their header. This indicates a column of interest, which is utilized by various views to organize the display. The rows in a column of interest have a yellow background. A column can be set as the field of interest by right-clicking on the header, and selecting the “Set Column as Data of Interest” context menu item. Grouping and filtering are controlled through drop down boxes above and below the data table.
Double-clicking on a function will open up an annotated version of the source code, showing the same table fields, but at an instruction or source-line granularity. Remember to account for skid when interpreting these results.
The fields within the tables can either be displayed as a number, as a bar, or both. Fields that are outside the predefined thresholds will be highlighted with a red background. This can be set per-column by right-clicking on the field header or row, and then selecting the “Show Data As” context menu item.
The timeline at the bottom of Figure 7.3 allows for events to be traced as the process migrates between threads. The events displayed can be configured by using the dialog box on the right side of the timeline. Notice that the timeline corresponds to the time of data collection. While the default setting is to display the entire data collection, it is also possible to zoom the timeline in on specific time intervals. This can be used to correlate data between multiple analyses. Additionally, during data collection it is possible to mark instances in time. This is accomplished either with the amplxe-cl -command mark command or through the graphical interface. These marks will be displayed in the timeline, allowing for events important to the analyst to be correlated with collection events.
