
Branching
Abstract
This chapter covers the fundamentals of branching instructions and their impact on performance. Section 13.1 provides techniques for reducing the number of branches executed. Section 13.2 provides techniques for improving branch prediction.
As discussed in Chapter 1, the instruction pointer contains the address of the next instruction to be executed. After the current instruction is executed, the instruction pointer increments to the next instruction, and so on. A branch introduces a deviation from this incremental behavior. Instead of incrementing to the next instruction, the branching instruction loads the instruction pointer with the address of an instruction at a different code region.
Every branch can be classified as either conditional or unconditional. As the names imply, a conditional branch may or may not change the instruction flow, while an unconditional branch will always alter the flow. Most programmers tend to associate the concept of branching with the first category, conditional branches, since these are the most visible forms. This kind of branch corresponds to the conditional and looping constructs exposed by programming languages, such as if or for statements. The other kind of branch, an unconditional branch, corresponds to control flow changes, such as calling into or returning from a function.
Due to the superscalar nature of the execution pipeline found in Intel® processors, comprised of many different parallel execution units, it is more efficient to keep the pipeline full, executing multiple instructions simultaneously, than to let instructions trickle in, executing the instructions serially. In an attempt to keep the execution pipeline fully utilized, the processor, in hardware, performs an optimization referred to as speculative execution. With speculative execution, upon approaching a branch, the processor predicts which branch will be taken. It will then use this guess to begin, possibly prematurely, executing the instructions from the predicted branch path. In the case of a correct guess, referred to as a branch hit, the instructions from both code paths can be interleaved, utilizing any idle execution units. This not only leads to more efficient pipeline usage, but also the branch is effectively free.
In the case where the guess was incorrect, referred to as a branch miss, the prematurely executed instructions from the incorrect branch path amount to wasted work. The execution pipeline is flushed to remove the partially executed instructions, and the typical branch overhead is experienced. It’s important to note that speculative execution doesn’t hurt performance in a branch miss, since it merely tries to fill idle execution resources with potentially beneficial work. Without it, every branch would suffer from overhead.
Despite some popular beliefs, branch misses are not restricted to conditional branching. Each processor contains a ring-buffer cache, which is responsible for storing the return address of each function call. While a CALL instruction pushes the return address onto the processes’ stack, it also places the return address into this buffer. When a RET instruction is found, the last pointer inserted into this ring buffer is used as the guess for speculative execution. In the case where either the cache overflows, that is, the function call stack exceeds the number of entries in the buffer, or where a CALL instruction doesn’t have a corresponding RET instruction, this pointer is incorrect, leading to a branch miss on the function return. In order to avoid this, ensure that each CALL instruction has a corresponding RET instruction, and vis-versa. The toolchain should handle this automatically, but it is something to be cognizant of when writing assembly. This mistake is especially common when writing a thunk to get the program counter for 32-bit PIC!
Also, and perhaps more importantly, avoid writing code that results in deep stack traces. This is especially problematic for recursive code. The typical number of entries in the processor’s ring-buffer cache is sixteen return addresses, so be wary of going much deeper. If possible, inline small functions to reduce the stack depth. To determine the balance between the cost of increased code size due to excessive function inlining and the cost of unconditional branch misses, measure.
While speculative execution never hurts performance, it can be poorly utilized by software, leading to a high performance opportunity cost, that is, the performance that could have been achieved had the code been tuned better. In general, the optimizations discussed in this chapter focus on avoiding the overhead associated with a branch. Granted, on modern Intel® Architectures, this overhead is minute, but bad speculation can still cause performance to suffer. The fastest branch is the branch that never occurs, either by not being present within the code, or by being correctly predicted.
13.1 Avoiding Branches
This section focuses on optimizing branching by reducing the number of overall branches. Obviously, the overhead of a branch miss can’t be felt if the branch is missing from the code. Additionally, the branch prediction logic within each processor core maintains a cache of the recent branches encountered and their resulting targets. As the number of branches in an application increases, the pressure on this cache also increases, potentially reducing branch prediction accuracy. Conversely, as the number of branches in an application decreases, the pressure on this cache also decreases, potentially leading to more accurate predictions.
13.1.1 Extra Work and Masking
By definition, a conditional branch optionally executes a segment of code. In some cases, this optional code must only execute in certain circumstances, that is, it has side effects that would affect correctness. In other cases, this optional code has no consequences to correctness, but just simply doesn’t need to be executed in every circumstance. Obviously in the former case the branch is unavoidable; however, in the latter case, the branch itself may be more expensive than performing the actual work contained within that branch. This is a result of the highly parallel nature of the execution pipeline, as described in Section 2.2.3 of Chapter 2.
Remember though, a correctly predicted branch is essentially free, so doing more work to avoid a well-predicted branch will hinder, not help, performance. The only way to determine whether its worth branching or just to do the work is to profile and measure.
For computations, branches can sometimes be avoided by utilizing masks. A mask is simply a value that gates which bits are used from another value. While this section will mostly focus on integer operations, masks are also very important when writing SIMD code, where branching functionality is severely limited and can drastically hurt parallelism.
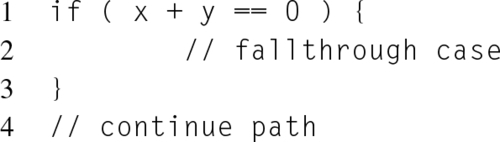
The easiest way to explain this concept is probably with an example. Consider the following function, foo(), where the variable x is only added to the variable y if x is positive.
Assume that foo() is showing up on the CPU cycles profile as a hotspot, and that Top-Down Hierarchical analysis has identified branch prediction for this branch as the primary culprit. Is it possible to remove the branch from foo()?
To begin, consider what is known about this branch. First, it checks the sign of the integer x, so any mask will need to be crafted out of this information. Second, the x variable is a signed integer, and signed integers on x86 encode positive and negative numbers with a sign bit. This sign bit is located in the high order bit, which is also referred to as the most significant or leftmost bit. Therefore, isolating this bit will provide the information needed to generate the mask. The next step is to determine how this bit can be transformed in order to affect the value of x so that it can be added to y unconditionally.
Ideally, for negative values of x, where the sign bit is set, the mask should be zero. This is because a mask of zero, when combined with the value of x with a bitwise and operation, will result in x = 0, allowing for the addition to occur without any effect. For positive values of x, where the sign bit is not set, the mask should be all ones. This is because a mask of all ones, when combined with the value of x with a bitwise and operation, will result in the value of x being unchanged, allowing for the addition to occur as expected.
The key observation needed for converting the sign bit into the mask is that negative integers are encoded using their two’s complement. Therefore, the encoding for negative one, where all bits are set, corresponds to the requirements for the mask when the sign bit is positive. By shifting the sign bit, located in the high order bit, right to the low order bit, also known as the least significant or rightmost bit, the result is a value of either one, in the negative case, and zero, in the positive case. Thus, subtracting one from this result will generate the desired masks. For example, the previous function foo() without the branch:
Notice that on line 3, the variable x is first cast from a signed integer type to an unsigned integer type. This is because the behavior when performing a bitwise shift to the right on a negative integer is implementation-defined by the C standard. On x86, there are two types of shift instructions, arithmetic and logical, used on signed and unsigned integers respectively. Logical shifts to the right, the SHR instruction, always fill the leftmost bits with zeros. Arithmetic shifts to the right, the SAR instruction, always fill the leftmost bits with the sign bit of the shifted value. For example, a 32-bit negative integer arithmetically shifted to the right 31 times would produce a result of 0xFFFFFFFF, since the sign bit would propagate to every other bit position. At the same time, a 32-bit positive integer arithmetically shifted to the right 31 times would produce a result of zero. Therefore, using an arithmetic right shift would create the proper mask, once the mask’s bits had been inverted with a logical not operation, instead of subtracting one from the mask value, as is done on line 4. The cast to the unsigned type, which according to C precedence rules occurs before the bitshifting operator, on line 3 ensures that the code only performs an unsigned bitwise shift to the right, the behavior of which is defined in the C standard as filling the leftmost bits with zeros. Additionally, operating on an unsigned integer instead of a signed integer does not affect creation of the mask, since unsigned underflow is well-defined in the C specification and produces the same result.
The sizeof(int[CHAR_BIT])-1 calculation on line 3 is simply a portable way of determining the number of bits in an integer. The syntax of the size calculation exploits the fact that the sizeof operator multiplies an array type by the number of indices, thereby multiplying CHAR_BIT, which the C standard defines to be the number of bits in a byte, with the number of bytes in an integer. Therefore, the hob variable contains the contents of the high order bit shifted into the low order bit.
Another way to avoid branching in this example is to leverage the conditional move, CMOV, instruction. This instruction only performs the data movement if the condition code is met. Since the instruction pointer is only incremented, this instruction doesn’t classify as a branch. With any decent C compiler, this instruction is typically generated automatically for any ternary operator. For example, another way to remove the branch from the previous example:


13.1.2 Combining and Rearranging Branches
As described in “Flow control” section of Chapter 1, every instruction either sets or clears zero or more arithmetic status flags in the EFLAGS register. While these status flags can be used to control the execution flow, they are not branches. Branches only correspond to instructions that actually modify the instruction pointer. For conditional branches, that means instructions such as JCC, where CC represents a condition code.
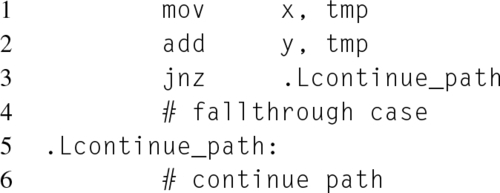
Consider the following simple branching example, implemented in a high-level programming language on the left, and the equivalent, although unoptimized, x86 on the right:
First, notice that although there is only one if statement in the high-level programming language, there are still two x86 branching instructions, on lines 2 and 4. Each of these branching instructions correlates to one of the two checks performed within the if condition. At the same time, it would be fallacious to assume that the number of branch instructions is always the same as the number of checks performed in the high-level language. For example, in this situation the compiler might determine during one of its optimization passes that the variable x is always 0, and therefore completely omit that check, resulting in only a single branch instruction actually occurring. Additionally, the compiler might determine that x can never be 0, and therefore completely omit the entire branch code path. The only way to know for certain is to check the assembly generated by the compiler.
Second, notice that the left-most branch, x == 0, is evaluated before the right-most branch, y == 0. This behavior is guaranteed by the C specification, which specifies that the logical and, &&, and logical or, ||, operators are sequence points between their two operands. A sequence point ensures that all values and side effects produced before the sequence point will be evaluated before code after the sequence point.
As a result of this behavior, if the left-most branch condition evaluates to false, then the right-most branch is completely skipped. This observation can be exploited to reduce the total number of branches executed by arranging branches such that the most influential branches, that is, the branches that are most likely to determine whether the entire code path is taken or not, are executed before less influential branches.
For example, consider the situation where three conditions must be met as a prerequisite for a code path. Assume that using a tool like gcov has revealed the probabilities of these three branches evaluating to true are 80%, 75%, and 10%. According to these measurements, the best order for the branches would start with the condition that is only true 10% of the time, followed by the branch that is true 75% of the time, and then finally the branch that is true 80% of the time.
This concept extends beyond the logical C operators to any sequence point within the C language. For example, considering the following optimal arrangements:
Notice that in the previous listing, the function foo()’s branches were listed in the reverse order to those in function bar(), that is, moving from most likely to least likely as opposed to least likely to most likely. This is because foo()’s branches result in the control flow leaving foo(), and therefore skipping its other branches. The point here is not to always follow a specific ordering, but instead to think about how to reduce the actual number of branches executed.
Third, going back to the examples in Listings 13.3 and 13.4, notice that two nonbranching instructions, on lines 1 and 3, are used to perform the actual comparisons. The CMP instruction performs integer subtraction on the two operands. Unlike the normal integer subtraction instruction, the CMP instruction discards the result and only modifies the relevant arithmetic flags for later use by a conditional instruction. The TEST instruction is similar to the CMP instruction, but performs a bitwise and operation instead of integer subtraction. Therefore, the TEST and CMP instructions each modify a different set of arithmetic flags.


In this case, the CMP instruction subtracts the immediate operand, the integer zero, and the other operand, the variable x or y. When comparing for equality with a conditional instruction, either with the equal, e, or not-equal, ne, condition codes, the arithmetic flag representing a zero result, ZF, is checked. Obviously, this is because the difference of two equivalent numbers is zero. At the same time, the ZF is also set by arithmetic and logical instructions that produce a zero result. This flag can also be checked with the zero, z, or not-zero, nz, condition codes.
This observation can be leveraged to reduce the number of branches performed in this example. For example, if both the x and y variables are zero, then the sum of those variables will also be zero. Therefore, instead of branching on the condition of each variable, it is possible to branch on the sum of these variables, that is, checking whether x + y == 0. Of course, this is only possible if it is guaranteed that x and y won’t offset to 0, e.g., x = −1 and y = 1. Since in this example the result of the summation isn’t saved, this would require either using a temporary variable to avoid modifying the actual contents of x and y. Assuming that both x and y are unsigned, and therefore can’t offset to zero, the previous example could therefore be reduced from two branches to only one branch. For example:
13.2 Improving Prediction
The branch prediction logic in the more modern x86 architectures is very good at detecting patterns in the branch paths taken. As a result, a lot of the traditional advice about optimizing branch prediction is no longer valid. Typically, this advice would focus on improving prediction by providing hints to the processor that would help the branch predictor choose the correct path, or on organizing branch targets to follow static prediction rules. While these techniques will improve branch prediction for older platforms, and they won’t hurt branch prediction for newer platforms, they won’t be producing performance gains on modern platforms.
Instead, since the branch predictor excels at finding patterns, branch optimizations should focus on reorganizing branches, such that they follow some predictable pattern.
Branch hint prefixes have already been mentioned as an ineffective optimization technique for modern x86 architectures. The two prefixes, 0x2E, which hinted that the branch wouldn’t be taken, and 0x3E, which hinted that the branch would be taken, modified the static prediction rules used by the branch predictor. The static prediction rules are no longer used, so neither are the prefixes.
13.2.1 Profile Guided Optimization
Unlike the other techniques in this chapter, profile guided optimization is a technique for optimizing branch prediction that doesn’t involve any changes to the source code. Instead, it comprises of a series of steps that are designed to provide the compiler with feedback about the application’s behavior. This feedback is then used by the compiler to provide further optimizations. While all of the compiler’s optimizations benefit from this additional information, in the author’s personal experience, profile guided optimization is capable of providing impressive performance gains when branch prediction is the limiting bottleneck.
In order to accomplish this, the software must be built not once, but twice. The first build is not designed to be used regularly. Instead, it instruments the code with special functions that monitor and record the software’s behavior at runtime. This instrumented binary will then be run on a workload designed to replicate the typical workloads expected by the software. As the execution of this representative workload finishes, the trace of the application’s behavior is saved to the filesystem, and will be used later by the compiler. It’s worth noting that profile guided optimization can be performed on any binary, that is, both on executable applications and libraries. In the case of a shared library, the binary executable, that links against the shared library in order to exercise it, will also need to be compiled with the instrumenting compiler flags, as will the library itself.
At this point, the software is ready to be built again. At compile time, the compiler parses the traces generated by the first build during execution, and then uses those results to make informed decisions about the optimizations and layout of the code. The resulting binary, with its tailored optimizations, will hopefully result in a performance increase. The key to successful profile guided optimization is the availability of an accurate representative workload.
At the time of this writing, all three of the major compiler toolchains, GCC, LLVM, and the Intel® C and C++ compilers (ICC), all support profile guided optimization, although LLVM requires a newer release, as support wasn’t available until early 2014.
Interestingly, LLVM supports two different methods for profile collection. The first type, which is the same as GCC and ICC, instruments the binary during build to collect results. The second type, which deviates from the typical profile guided optimization flow, eschews instrumentation and instead allows feedback to be submitted to the compiler from the perf(1) infrastructure. For this to work, the binary needs to be built with debugging information, and a special tool must be used to convert the output from perf(1) into something the compiler can parse. In the author’s opinion, this is an excellent feature, designed to obviate the two-build requirement that has prevented profile guided optimization from obtaining wide usage. As such, the author patiently awaits to see how this functionality will evolve and affect the other compilers.
In order to generate the first, instrumented, build, each compiler uses a similar, but unfortunately different, compiler flag. For GCC, the flag is -fprofile-generate, for LLVM, it is -fprofile-instr-generate, and for ICC, it is -prof-gen.
After using this flag, for both building and linking, the resulting binary will generate additional tracing files upon execution. The number, name, and formatting of those tracing files is compiler specific. GCC generates one trace file, ending with a .gcda suffix, per object file. For instance, foo.o would have a corresponding foo.gcda. On the other hand, ICC and LLVM only generate one trace file, representing the entire trace. ICC trace files end with a .dyn suffix, while LLVM traces end with a .profraw suffix.
Once the trace file, or files, has been collected, a different compiler flag is used to inform the compiler to locate, parse, and utilize them. For GCC, this flag is -fprofile-use, for LLVM, the flag is -fprofile-instr-use=filename, and for ICC, the flag is -prof-use. The result from this build is ready for benchmarking.