The objectives of this chapter are to:
Describe reporting in Microsoft Dynamics AX 2009.
Provide an architectural overview of reporting with Microsoft SQL Server Reporting Services.
Describe how to build and customize production reports using the Dynamics AX reporting tools.
Explain how to integrate Reporting Services reports into Dynamics AX applications and Enterprise Portal.
Describe how to use Reporting Services to enable users to build ad hoc reports.
In the context of business intelligence (BI) in Dynamics AX 2009, reporting is the mechanism through which users extract and use data from the Dynamics AX system. Reporting is a critical component for any business because it is a primary way for users to have visibility into their business. This visibility helps users understand how to proceed in their day-to-day work, make more-informed decisions, support critical thinking and analysis, and finally, take action.
This chapter provides a high-level overview of how the reporting components work together in Dynamics AX 2009. It describes how, through Dynamics AX, customers can leverage SQL Server Reporting Services and integrate it into the Dynamics AX enterprise resource planning (ERP) framework. This chapter also highlights the new features in the Dynamics AX 2009 reporting development tools, describes how the ad hoc reporting system works, and gives guidance to developers and administrators about how to configure ad hoc reporting.
Before delving into the details of building Reporting Services reports and creating ad hoc reporting models, you should know the primary reporting concepts in Dynamics AX and have a high-level understanding of how the Dynamics AX Reporting Framework is designed. We discuss these topics in the following subsections.
For the purposes of this chapter, a report is simply data from Dynamics AX that has been rendered into human-readable form. For example, at its simplest, a report could be a list of customers shown on the screen. A report could also be a printed piece of paper containing details about a specific customer. A Web page listing inventory is a report. A Microsoft Office Excel worksheet showing all the statistics of on-time deliveries is also a kind of report. This definition of a report is broad, but it reflects the varied, real-world usage of reporting in Dynamics AX.
You can categorize reporting on two axes: data depth and business activity. As shown in Figure 11-1, the role users play in an organization and the reports they use fall at one point (or perhaps several points) on these axes.

Figure 11-1. Depiction of how users in different business roles work with different kinds of data, requiring different kinds of reports
Here are some details about the reporting needs of the roles shown in Figure 11-1:
A CEO who is interested in monitoring the business periodically uses strategic reports that provide summarized data across time periods.
An analyst examines the business looking for patterns that might lead to changing business plans and priorities and uses reports that allow the data to be interactively sliced by region or time period. This makes it easier to detect trends and patterns, and the results of this analysis feed into the CEO’s decisions.
A shop floor worker is concerned with the day-to-day activities of the business and uses reports that reflect the immediate needs of the shop floor. For example, a shop floor worker would use a simple report that lists all the items in the inventory.
Dynamics AX reports help satisfy the needs of these users so that relative to an individual’s role in the business, he or she has the data necessary to be effective.
Dynamics AX 2009 supports both production reports and ad hoc reports. Production reports, which can range from simple to complex, are designed and created by developers. Ad hoc reports are generally simpler and created directly by users, without help from developers.
Note
In Latin, ad hoc means "for this," and the term indicates something done, often impromptu, for a specific purpose. In the context of Dynamics AX reporting, an ad hoc report is very specific to the needs of the user who created it.
Dynamics AX 2009 reports fall within three general categories:
Production reports that use one of the two reporting platforms—MorphX or Reporting Services—supported by Dynamics AX 2009. Developers create these reports because of their complexity.
Ad hoc reports built on MorphX or Reporting Services. Once developers and administrators have put ad hoc reporting models in place, users can create their own ad hoc reports.
Ad hoc reports that access Dynamics AX data directly.
Table 11-1 lists the different kinds of reports available in Dynamics AX 2009 and some characteristics of each.
Table 11-1. Kinds of Reports Available in Dynamics AX 2009
Production Reporting? | Ad Hoc Reporting? | Reporting Platform | Report Creation Tool | |
|---|---|---|---|---|
MorphX production reports | Yes | No | MorphX | MorphX tools |
Reporting Services production reports | Yes | N/A | Reporting Services | Visual Studio 2008 |
Auto reports | No | Yes | MorphX | Dynamics AX client |
Reporting Services ad hoc reports | N/A | Yes | Reporting Services | SQL Report Builder |
Export list page to Excel | No | Yes | N/A—direct access to Dynamics AX | Dynamics AX client and Excel |
Connect Excel to Dynamics AX cube | No | Yes | N/A—direct access to Dynamics AX | Excel |
Note
For more information about Dynamics AX list pages, see Chapter 5. To learn more about Dynamics AX cubes, read the white paper "Microsoft Dynamics AX 2009 Business Intelligence Cube Reference Guide," available from the Using Microsoft Dynamics AX 2009 Web site at http://microsoft.com/dynamics/ax/using/ax_installorupgrade, or directly from the Microsoft Download Center at http://www.microsoft.com/downloads.
Dynamics AX 2009 integrates with two reporting platforms: MorphX, the Dynamics AX–specific reporting platform, and Reporting Services (SQL Server Reporting Services), which is the Microsoft standard reporting platform.
MorphX has been the traditional Dynamics AX reporting platform since the first version of the product and has been supporting customer needs for a long time. Starting with Dynamics AX 2009, Reporting Services is considered the primary reporting platform for the product.
Microsoft decided to shift to Reporting Services as the standard reporting platform for Dynamics AX rather than standardizing on MorphX, which is a proprietary reporting platform, for several reasons, including these:
Advantages from the availability of a much larger pool of resources, including developers, partners, and training partners who are already familiar with Reporting Services and Visual Studio.
It aligns with the overall direction in Microsoft to standardize on Reporting Services.
Here are some of the features that Reporting Services offers that are unavailable in MorphX:
Charting
Reports using non–Dynamics AX data sources
Reports using OLAP cube data
Interactivity
Ad hoc reporting
Users can view reports in Dynamics AX 2009 from several locations. When working in the Dynamics AX client, users can view reports in the following ways:
Export data from a Dynamics AX list page into an Excel worksheet.
View and print an auto report, which Dynamics AX can automatically build from any list page or form the user sees.
Launch MorphX production reports or Reporting Services production reports from menu items.
Even when users are not working in the Dynamics AX client, they can view reports in these ways:
Go to the Reporting Services Report Manager Web site to locate and launch production reports or ad hoc reports directly.
Start Excel and connect it to a Dynamics AX cube to analyze Dynamics AX OLAP data via Excel pivot tables.
Figure 11-2 is a conceptual depiction of how users can access the different kinds of reports available in Dynamics AX.

In this section, we identify the key components of the Reporting Services reporting framework and describe their functions. We also show how data flows through those components to provide production reports and ad hoc reports, and to allow Excel to access Dynamics AX OLAP data.
Figure 11-3 shows the components of and the data flow in the Reporting Services reporting framework.

Each of the key components shown in Figure 11-3 is described in the following list. Every number in the figure corresponds to an item in the list.
Application Object Server (AOS) The AOS is the core of the Dynamics AX server platform. Dynamics AX production reports retrieve Dynamics AX OLTP data via the AOS. You can read more about the AOS in Chapter 1, and Chapter 14.
Dynamics AX OLTP database This database stores the raw transactional data in the Dynamics AX system. In general, users shouldn’t access this database directly but must instead go through the AOS to maintain security. (Reporting Services ad hoc reports are an exception because security is maintained using SQL views ["secure views"] instead of the AOS.)
Dynamics AX OLAP cube This OLAP cube contains the aggregated and sliced analysis of the OLTP data.
Semantic Model Definition Language (SMDL) SMDL models are published to the Reporting Services server; they enable users to create and use ad hoc reports that retrieve Dynamics AX OLTP data.
Dynamics AX Reporting Services production reports
These reports always communicate via the Dynamics AX Reporting Data Extension on the Reporting Services server.
The Dynamics AX Reporting Data Extension allows the production reports to access Dynamics AX OLTP and OLAP data.
When accessing Dynamics AX OLTP data, the Dynamics AX Reporting Data Extension always goes through the AOS.
Dynamics AX Reporting Data extension
For Dynamics AX Reporting Services production reports, all data access is provided through the Dynamics AX Reporting Data Extension.
Dynamics AX Reporting Services ad hoc reports
Ad hoc reports (7) don’t fetch OLTP data (2) via the AOS (1). Instead, they connect to the OLTP database (2) directly.
When the IT staff initially configures ad hoc reporting, SQL views ("secure views") are created in the OLTP database that maintain Dynamics AX security when the views are accessed directly from a Reporting Services ad hoc report. Again, OLAP data is fetched directly from the OLAP cubes.
Excel
Excel can directly bind to the Dynamics AX OLAP cubes, allowing users to create pivot tables or pivot charts in Excel to interactively analyze Dynamics AX data.
Once Dynamics AX 2009 has been deployed and configured to use Reporting Services, a developer can create a report and have it show data. In the following list, we walk you through the steps for creating a production report in more detail. The numbers in brackets refer to Figure 11-3.
A user clicks a menu item attached to a report in the Dynamics AX client.
Microsoft Internet Explorer is launched with the URL to the report.
Internet Explorer requests the report from the Reporting Services server [9].
The Reporting Services server [9] asks the Dynamics AX Reporting Data Extension [6] for any data the report uses.
Depending on the report, the Dynamics AX Reporting Data Extension can fetch data from the following sources:
The Dynamics AX Reporting Data Extension [6] sends the data back to Reporting Services [9].
Reporting Services [9] renders the report as HTML.
Reporting Services sends the HTML to Internet Explorer.
Internet Explorer displays the report.
The user views the report [5].
Once Dynamics AX 2009 has been deployed and configured to use Reporting Services ad hoc reporting, a users can create a report. The following steps describe how to create an ad hoc report. The numbers in brackets refer to Figure 11-3.
A user downloads and installs SQL Server Report Builder 2.0.
The user creates a new report.
The user can have the report fetch Dynamics AX OLAP or OLTP data.
The user publishes the report to the Reporting Services server.
The user then launches Internet Explorer and goes to the report.
Internet Explorer requests the report from the Reporting Services server [9].
The Reporting Services server fetches Dynamics AX data.
OLTP data comes directly from the Dynamics AX OLTP database [2].
OLAP data comes directly from a Dynamics AX OLAP cube [3].
Reporting Services renders the report as HTML.
Reporting Services returns the HTML to Internet Explorer.
Internet Explorer displays the report.
The user views the report [7].
Developers can use the Visual Studio integrated development environment (IDE) to create Dynamics AX Reporting Services reports. In this section, we cover the tools and processes that developers and administrators can use to develop Reporting Services production reports.
Dynamics AX 2009 includes development tools that enable developers to create Dynamics AX Reporting Services production reports in Visual Studio 2008. The new development tools have been created from the ground up to be fully integrated with Dynamics AX. These tools provide report designers the benefit of working within the familiar Visual Studio 2008 IDE and the ability to leverage rich reporting features from Reporting Services.
The Dynamics AX reporting development tools comprise a modeling tool that allows report designers to visualize the report elements as they are developing a report. The report is fully customizable within Visual Studio. The reports created are in the Report Definition Language (RDL) format specified by Reporting Services. By utilizing this widely adopted format, report designers can leverage the many features (e.g., charting, interactivity, and access to multiple data sources, as mentioned earlier) that make Reporting Services a popular choice for production reports. These reports can then be deployed, stored, managed, and processed on the report server using the Reporting Services technology.
The Dynamics AX reporting tools include a new Visual Studio project type called "Dynamics AX Reporting Project." This project type allows developers to create Reporting Services reports that bind to data in Dynamics AX.
A Dynamics AX Reporting Project has the following features:
Allows a report to retrieve from AOS via .NET Business Connector
Defines report parameters
Uses localized strings for report elements
Edits and saves reports in the AOT
Deploys reports to the report server
Figure 11-4 is a high-level view of the report development process.

Figure 11-4 illustrates the primary tasks performed during the two major stages of the report life cycle. At design time, the report developer designs the report with the Dynamics AX reporting tools in Visual Studio 2008, performs the desired customization, and previews the report design. When the report is ready, the developer deploys the report by using the built-in report deployment feature in Visual Studio or the Dynamics AX 2009 Reports Deployment tool. After the reports are deployed, they are ready to be viewed in the Dynamics AX client and Enterprise Portal. Administrators can configure menu items, and Web parts open the deployed reports.
To learn how to create a report for Dynamics AX in Visual Studio 2008, refer to the useful step-by-step guide on MSDN. These pages have comprehensive descriptions for all the major scenarios report developers would encounter: http://msdn.microsoft.com/en-us/library/cc653472.aspx.
In the following sections, we introduce several important model elements of reporting tools. If you understand these model elements and the way they work, you can develop reports quickly and easily. Figure 11-5 shows a typical Report Model Editor as it appears when you first create a report project.

A few collection objects, such Reports and Report Style Templates, are at the root level. Each collection object has zero or more child objects.
Each Dynamics AX Reporting Project contains one or more report models. Each model has exactly one root Reports element. This element contains all the reports in the current model.
Every model corresponds to a .moxl file displayed in Solution Explorer. Figure 11-6 shows a report project in Visual Studio 2008 Solution Explorer.
A report design is a particular layout for a report. A single report can have multiple designs that form the basic blueprints for the rendered reports. Report developers have the option of creating auto designs or precision designs.
Auto designs. An auto design is automatically generated based on the information specified in the report model. You create auto designs in Model Editor. The auto design functionality provides an efficient way to create the most common types of reports, such as a customer list or a list of inventory items.
Precision designs. Precision designs are typically used when a report requires a precise layout, such as invoices or bank checks. When creating a precision design, you can manually drag fields onto a report, placing them exactly where you want them.
An auto design follows a particular layout. It has a header, a body containing one or more data regions, and a footer, as shown in Figure 11-7.

You can control the content that is displayed in each area within an auto design. For example, you can include a report title and the date in the header and display the page number in the footer, or you can leave the header and footer blank.
The data regions that display in an auto design depend on the data sets you create when you define the data for the report in Model Editor. When you define a data set, you can specify the type of data region that is used to render the data whenever that data set is used in an auto design. Data can be displayed in table, list, matrix, or chart format. One way to create an auto design is simply to drag a data set onto the Designs node for the auto design in the model.
Figure 11-8 shows the hierarchical relationship among project, model, reports, and designs.

Report projects are Microsoft Visual C# or Microsoft Visual Basic container projects in which one or more report models can be stored as .moxl files. Each report model, visualized in Model Editor, can include multiple reports, and each report can contain multiple designs, regardless of whether they are auto designs or precision designs.
Data sources are crucial to the development of useful production reports. The very purpose of a production report is to retrieve data from its source and to display the data in a fashion that is easy for users to consume. A major benefit of the Dynamics AX Visual Studio reporting tools is the ability to connect to a variety of different types of report data sources. Even better, a report can display data from multiple data sources. Table 11-2 lists the data source types supported by the Dynamics AX Visual Studio reporting tools.
Table 11-2. Data Source Types Supported by Visual Studio Reporting Tools
Data Source Type | Data Content |
|---|---|
Dynamics AX | Queries that are defined in the AOT Data methods that are defined within a reporting project in Visual Studio 2008 |
SQL | T-SQL query Stored procedure |
OLAP | MDX query |
Dynamics AX is a predefined data source that allows you to connect to OLTP data stored in Dynamics AX. It supports both SQL Server and Oracle databases. It also allows you to bind data sets to data methods that contain your custom business logic that returns a DataTable.
The report developer needs to define the SQL or OLAP data source type. You need to create a new data source under the Report DataSources node, specify the Connection String property, and select the desired data provider type (SQL or OLAP). By doing so, you give your reports the ability to connect directly to the data source instead of having to go through the AOS, which is the process with the Dynamics AX data source type.
You use a data method to write the code for your report’s business logic. You can add a data method by creating a new subnode under Data Methods in the Report Model. After you have done so, you can bring up the code editing window by double-clicking the new data method node. What you see is the standard C# or Visual Basic code editing environment that every .NET developer should be familiar with.
You can find all the Visual Studio features you’re familiar with, such as IntelliSense and syntax highlighting. You can also reference any of the .NET libraries to increase your productivity and get creative with your business logic. By adding references in the project, you also have access to a wider variety of helper classes and libraries that you’ve created.
Reporting Services ad hoc reporting, the second major category of Dynamics AX reports, enables users to create and view Dynamics AX reports without needing assistance from developers or IT staff. Users can simply use SQL Server Report Builder to create their own ad hoc reports.
Before users can create and view ad hoc reports, developers and administrators must configure the ad hoc reporting functionality in Dynamics AX by deploying ad hoc reporting models to the Reporting Services server. Once these models are deployed and secured, users can start creating ad hoc reports without further assistance from developers or IT staff.
Developers build the ad hoc models from Dynamics AX perspectives, which is nothing but a collection of references to tables in Dynamics AX. Developers create the Dynamics AX perspectives, and the IT staff deploys the ad hoc models in the Reporting Services server. These models are stored as SMDL files, which Reporting Services understands.
The section "Creating Ad Hoc Reports" later in this chapter provides an overview of the process involved in enabling and creating an ad hoc report. You can also find more details about the ad hoc reporting process in the Microsoft Dynamics AX 2009 software development kit (SDK) on MSDN.
The performance of ad hoc reports doesn’t match the performance of production reports. Ad hoc reports work best for simple, small reports that don’t involve large data sets. If the performance of an ad hoc report is insufficient, you should consider whether creating a production report instead is worth the time and effort.
Ad hoc reports are implemented in SMDL. Because SMDL is a concept specific to SQL Server, ad hoc reports work only with SQL Server. Dynamics AX 2009 doesn’t support ad hoc reporting with Oracle databases.
Unlike production reporting, which depends on the AOS to implement security, the ad hoc reporting framework is based on secure views. A secure view is a normal SQL database view that enforces security on tables when they are accessed from outside Dynamics AX. When the IT staff generates or updates a report model, the Dynamics AX application creates secure views in the OLTP database for every table referenced in a report model. When a user accesses report data using Report Builder, security is automatically enforced via these secure views, so users see only the data they are supposed to see (according to their user group membership).
You can also generate secure views using the Create All Secure Views form in Dynamics AX, which is at AdministrationPeriodicBusiness Analysis.
To create an ad hoc report, go through the following steps in order. The steps shown here are meant to give you an overview of the end-to-end scenario involved in deploying SMDL models and creating ad hoc reports. Dynamics AX has published detailed procedures for each of these steps in the Microsoft Dynamics AX 2009 SDK.
Configure the Reporting Server in Dynamics AX for report models. (Find the Reporting Servers form, shown in Figure 11-9, at ToolsBusiness Intelligence ToolsReporting Servers.) Enter the Server Name, Description, Report Manager, and Web Service URLs.
Define perspectives in the AOT.
Configure BI properties on the tables and fields that are included in the perspectives. Make sure to set the Usage property to ad hoc reporting for the perspective in question. Figure 11-10 shows the AOT Perspectives form.
Configure the model generation options in the Model Generation Options form (shown in Figure 11-11), found at ToolsBusiness Intelligence ToolsReport Model Generation Options. Choose the languages that are needed, and set the corresponding report servers.
Set the default report server to be used for report models in the Default Report Servers form, found at ToolsBusiness Intelligence ToolsDefault Report Servers.
Publish the SMDL models on the report server by clicking the Update A Report Model button in the Model Generation Options form.
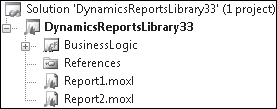
Launch the Report Builder Options form (shown in Figure 11-12) from ToolsBusiness Intelligence ToolsReport Builder Options. In this form, you can specify the report model you want to use and the required language. Choose the report data (Perspective label) and the language, and click OK.
Launch the Report Builder from ToolsBusiness Intelligence ToolsReport Builder, and design the report by dragging the required fields from the left side onto the report design.
Generate the report.


This section contains some of the most common ad hoc reporting framework issues and possible solutions that testers identified during the Dynamics AX 2009 release cycle. You can find related information posted on the following closely monitored online community: https://community.dynamics.com/forums/33.aspx.
Click the Create button in the Reporting Servers form, found at ToolsBusiness Intelligence ToolsReporting Servers, and make sure that a report folder and data source have been created on the report server. Click the Validate button.
Configure the firewall settings appropriately on the report server box.
Make sure the report manager and report server URLs are correct.
Make sure the Dynamics AX user has permissions on the report server box.
Make sure the report server account configured in the report data source on the report server has read permissions on the Dynamics AX SQL database.
Configure the firewall settings on the database box appropriately.
Check that the user name and password provided for the report server account in the data source on the report server are correct.