Appendix 6
Experimental Efficiency of Software Data Preloading and Prefetching for Embedded VLIW
For our experimentation, we used a cycle-accurate simulator provided by STmicroelectronics. The astiss simulator offers the possibility of considering a nonblocking cache. We fixed the number of misinformation status hold registers (MSHR) (the pending loads queue) at 8. We made the choice of eight MSHR, because during experimentation, we observed that the instruction-level parallelism (ILP) and register pressure reach a limit when MSHR is set to eight; a larger MSHR does not yield more performance. We use a simulator for our experiments for many reasons:
Concerning the compilation phase, we use the -O3 compilation option for all tested benchmarks with the st200cc compiler. The data preloading technique has been implemented (by STmicroelectronics) inside this compiler to set the load latencies at different granularity levels: loops, functions, application. The compiler does not insert prefetch instructions, so we insert them manually inside the assembly code following our methodology explained in section 6.2.
Figure A6.1. Execution time repartition for Spec benchmarks

We make experiments on SPEC2000 and MEDIABENCH. Furthermore, we use the vendor benchmark called FFMPEG used for their internal research. The first time, we made a precise performance characterization of all these benchmarks. For each executed application, we decomposed its execution times using the following formula: T = Calc + DC + IC + InterS + Br, where T is the total execution time in processor clock cycles, Calc is the effective computation time in cycles, DC is the number of stall cycles due to Dcache misses, IC is the number of stall cycles due to instruction cache misses, InterS is the number of stall cycles due to the interlock mechanism and finally Br is the number of branch penalties. Figure A6.1 plots the performance characterization of the used benchmarks. As can be seen for MEDIABENCH applications, only small fraction of the execution time is lost due to Dcache penalties, except in the case of jped. So, most of the MEDIABENCH applications will do not take advantage from Dcache optimization techniques on ST231. The best candidates for our low-level cache optimization method are the benchmarks, which contain large Dcache penalty fractions. As shown in Figure A6.1, Mcf and Gzip seem to be the best candidates for Dcache improvement. Indeed, Mcf has more than 76% of Dcache penalty, and Gzip has more than 56% of Dcache penalty. Other benchmarks have smaller fractions of Dcache penalties, between 10% and 20% depending on the benchmark. However, these benchmarks have enough Dcache misses to expect some positive results. The benchmarks that have negligible fraction due to Dcache stalls are ignored for our optimization strategy.
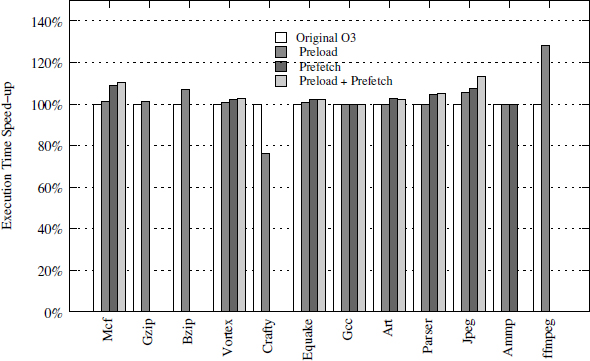
For each optimized benchmark, we made a precise trace analysis to determine the regularity of the delinquent loads. We apply the prefetching and preloading techniques described previously and we compare the results to the performance of the generated code with the -03 compiler optimization level. Figure A6.2 illustrates our experimental results (performance gain). As shown, the prefetch technique allows us to have positive overall performance gain up to 9.12% (mcf). Due to prefetching, some cache misses are eliminated. However, prefetching requires regular data streams to be applied efficiently. If the data stream is not regular (non-constant strides), the preloading technique is more efficient. While it requires a compilation trade-off between register pressure and load latencies, the produced performance gain is satisfactory in practice: we can obtain up to 6.83% overall performance gain for bzip. The preloading technique gives good results except in the crafty benchmark. After a deep study of crafty, we observed that specifying larger latencies for load instructions has a negative impact on a critical loop. This loop causes a slowdown due to the instructions’ cache penalty because the memory layout of the codes changed, creating conflict misses. Note that we can obtain higher speedup when we combine the two techniques conjointly. As shown in Figure A6.2, jpeg gains more than 14% of the execution time.
Figure A6.2. Efficiency of data prefetching and preloading. Note that prefetching is not applicable to all applications
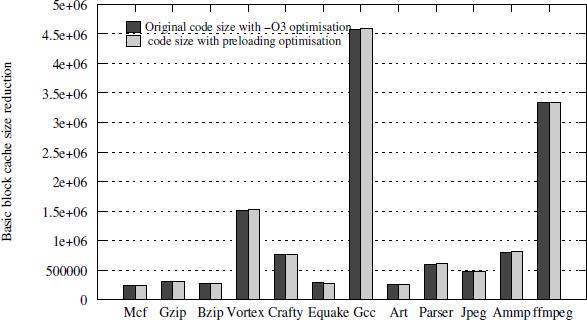
Regarding code size, our prefetching technique does not introduce any extra code in practice; we succeed in scheduling all prefetch instructions inside free VLIW slots. However, the preloading technique may induce some negligible code size growth (3.9% in extreme case of mcf) (see Figure A6.3).
Figure A6.3. Initial and modified codes sizes