
CARD SORTING
WHEN SHOULD YOU CONDUCT A CARD SORT?
THINGS TO BE AWARE OF WHEN CONDUCTING A CARD SORT
GROUP OR INDIVIDUAL CARD SORT?
PREPARING TO CONDUCT A CARD SORT
DATA ANALYSIS AND INTERPRETATION
Analysis with a Card Sorting Program
Analysis with a Statistics Package
Analysis with a Spreadsheet Package
CASE STUDY: HOW CARD SORTING CHANGED A WEBSITE TEAM’S VIEW OF HOW THE SITE SHOULD BE ORGANIZED
Introduction
Creating a product that has a logical information architecture is critical to the success of your product. Information architecture refers to the organization of a product’s structure and content, the labeling and categorizing of information, and the design of navigation and search systems. A good architecture helps users find information and accomplish their tasks with ease. Card sorting is one method that can help you understand how users think the information and navigation should be within your product.
This method involves writing objects that are in – or proposed to be in – your product (e.g., hotel reservation, rental car agreement) on cards and asking users to sort the cards into meaningful groups. The objects are pieces of information or tasks that are – or will be – in your product. You want to understand how the users think those objects should be organized. You then strive to replicate these groupings in your product. By doing so, users will be able to easily find what they are looking for when using your product.
In this chapter, we discuss uses for card sorting, how to prepare for and conduct a card sort, and how to analyze and present the information. Several modifications are presented at the end to help you customize the method to your particular needs. Finally, a case study by Redish & Associates, Inc. is offered so that you may see how an industry icon has used card sorting with success.
When Should You Conduct a Card Sort?
Card sorting is excellent for situations where you want the users’ mental model to drive the information architecture of the product. You should use it anytime you need feedback about the content, terminology, and organization of your product.
Unfortunately, many developers design products to conform to their own mental model of a domain. They may base their decisions about the information architecture or product’s layout on the underlying technology (e.g., the database). In the case of designing a website, some companies mirror their organizational or departmental hierarchy. Users are rarely aware of the developer’s point of view, the underlying technology, or the company’s departmental organization. As a result, they will have difficulty using a product designed based on those considerations. There have been cases where it has taken us a month of working with the development team to get a list of objects within the product and definitions that everyone can agree upon. This happens when the product is not well defined or each person on the team has a different understanding of the product. The exercise of identifying objects and defining them can be eye-opening for the development team and demonstrate the need for a card sort as well as other usability activities.
You can do a card sort for entire sets of information (e.g., a website’s entire information architecture) or for subsets of information (e.g., the information within a specific web page). In a large product, different sections have different users. In this case, you will likely want to conduct a card sort on each section by users most likely to use it. Additionally, you can compare novice versus expert mental models.
There are several types of information that you can obtain with a card sort:
Things To Be Aware of When Conducting a Card Sort
Users may not always have optimal mental models (Nielsen & Sano 1994). Designing a system based on flawed user mental models can clearly hamper user performance. For this reason, you should avoid including users in your card sort with no or little experience in the domain of concern. Obviously, if a user does not understand a domain well and have experience in it, that person’s mental model will not be as efficient or even correct as that of others who do.
Group or Individual Card Sort?
You need to decide whether to conduct your card sort with several participants at once or one at a time. We conduct these sessions with several participants simultaneously because this allows us to collect large samples of data in a short period. You can conduct a card sort with as many people at a time as you physically have room for. Even though we have a group of participants in the same room at the same time, they are not working together – they are each working individually.
The disadvantage with running several participants simultaneously is that you cannot collect think-aloud data, so you do not know why the users grouped the data the way they did. (Refer to Chapter 6, During Your User Requirements Activity, “Introducing Your Think-aloud Protocol” section, page 218.) Although think-aloud data are helpful, participants typically provide enough information in their description of each group so that the need to collect data quickly and from large samples outweighs the benefit of having think-aloud data.
Some people dislike running a group card sort because they feel that the participants turn it into a race. In our experience this has not been a problem. We encourage people to take their time because we will be there for as long as they need to sort the cards.
If you have the time, a hybrid approach works quite well: After collecting data from a group of participants, run one or two individual card sorts to collect think-aloud data. This additional data can help you better understand the groupings.
Preparing to Conduct a Card Sort
Before you begin any user requirements activity there are a number of things that you must be familiar with. Because these elements are common to all user requirements activities, they have been covered in the earlier chapters – but now is a good time to double-check the list. If you are not familiar with one of the items you can refer to the earlier chapter to brush up or familiarize yourself with that element.
Chapter 1 : Introduction to User Requirements
![]() Get stakeholder buy-in for your activity (see page 14)
Get stakeholder buy-in for your activity (see page 14)
Chapter 2 : Before You Choose an Activity
Chapter 3 : Ethical and Legal Considerations
Chapter 4 : Setting up Facilities for Your User Requirements Activity
![]() Create or acquire a facility for your activity (see page 106)
Create or acquire a facility for your activity (see page 106)
Chapter 5 : Preparing for Your User Requirements Activity
![]() Develop an activity proposal (see page 146)
Develop an activity proposal (see page 146)
![]() Determine the time of day and duration of your session (see page 155)
Determine the time of day and duration of your session (see page 155)
![]() Recruit participants (see page 156)
Recruit participants (see page 156)
![]() Develop an activity protocol (see page 191)
Develop an activity protocol (see page 191)
![]() Pilot your activity (see page 193)
Pilot your activity (see page 193)
Chapter 6 : During Your User Requirements Activity
Now that we have presented when and why to conduct a card sort, we will discuss how to prepare for one.
Preparation Timeline
The timeline in Table 10.1 covers in detail the sequence and timing of events to prepare for a card sort. These are approximate times based on our personal experience and should be used only as a guide. It could take longer or less time for each step depending on a variety of factors, such as responsiveness of the development team, access to users, and resources available. It can take as long as a month or as little as two days to identify the objects for the sort and develop clear definitions. The time it takes to create the cards depends on the number of cards and participants needed; but on average it can take about three and a half hours to create enough cards for 60 objects and ten participants.

Identify Objects and Definitions for Sorting
There are several ways to obtain your objects (i.e., pieces of information or tasks) and definitions for sorting. The first and most frequent method is to work with the development team to identify the objects and then develop clear definitions. The creation of definitions can be surprisingly time-consuming since the development team may define things in terms of the way the back-end or technical components of the product works. It is your job to make sure the definitions are clear and easy for participants to understand. Without those definitions, you cannot be sure that you and the participants are on the same page, speaking the same language.
In cases when your product is still in the conceptual stage, you may not have a determined list of content or tasks for the product. While still working with the development team, you may need to supplement your knowledge with input from the marketing department or a competitive analysis (refer to Chapter 2, Before You Choose an Activity, “Learn About Your Product” section, page 29). You may find it beneficial to do a wants and needs (W&N) analysis (see Chapter 9, page 370) to learn about the information or tasks you would like to have in your product. You will need to ensure that, during the brainstorming portion of the W&N analysis, you clearly understand what each idea means so that you can write complete definitions for your card sort.
If a version of the product already exists and your goal is to re-architect the product, you and the team can together identify the possible areas to re-architect. Once you have done this, you can make a list of all the objects contained within these areas. If there are objects that will be omitted in the next release, you should omit these from the card sort. Conversely, if there are new objects that the product team intends to add to the product, you should certainly include these.
Finally, you can also obtain objects for a card sort by asking participants to free-list all the items associated with a given domain (i.e., participants write down every phrase or word associated with a particular topic, domain, etc.). This is a brainstorming activity similar to a W&N analysis and can be done either individually or as a group. The difference is that, in free-listing, you are asking participants to name every “item” they can think of that is associated with a domain – not just the ones they want for a given product or system. Using our travel example from other chapters, we might want to ask participants to name every piece of information they can think of that is associated with making travel reservations. Some responses might be: plane ticket, car rental, hotel room, confirmation number, and frequent-flyer miles.
How many participants are needed for this kind of free-listing activity? The answer is: “It depends.” The best way to determine the appropriate number is to conduct the activity with five or six participants, tally the results to see the number of participants identifying each object, and then see how those results change by adding one or two new participants. If the results are stable, no further participants are needed.
The benefit of both the W&N analysis and free-listing is that you obtain information about the users’ terminology because they are offering their ideas in their own language.
We have found that it is best to limit the number of objects to be sorted at 90 or less, because participants cannot keep more than that in their mind at one time. However, there are studies where more cards have been used. One study was found to use 500 cards (Tullis 1985)! We would not recommend this. Keep in mind that the more cards there are to sort, the longer it will take for the participants to sort and the more you will fatigue and overwhelm them. In addition, sorts with large numbers of cards will take considerably longer to analyze.
Although it may seem unnecessary to run a pilot session for a card sort, it helps to have several individuals review the objects and definitions on the cards. A fresh set of eyes can find typos or identify confusing definitions and terms. In addition, a pilot can help you get a sense of how long it will take for participants to complete the sort, and determine whether you missed any objects.
Activity Materials
You will need the following materials for a card sort:
![]() 3 in × 5 in index cards (different colored cards is optional)
3 in × 5 in index cards (different colored cards is optional)
![]() Plenty of workspace for a participant to spread out the cards.
Plenty of workspace for a participant to spread out the cards.
To create the cards, type the name of the object, a blank space, and the definition of the object on a sticky printer label (see Figure 10.1). You can also add an example of the object, if you feel it will help users understand the object. Make sure that you use at least a 12-point font. It is easy to create a file of the objects and then print out several sheets. You can then quickly stick labels on the cards. Alternatively, you could buy sheets of punch-out index cards and print directly onto the sheets; however, we have found them only in white.

The number of index cards needed (C) can be computed by multiplying the number of objects in the sort (O) by the number of participants you intend to recruit (P):
So if you have 50 objects and ten participants, you will need 500 index cards. We recommend providing about 20 blank cards per participant for labeling their groups.
Additional Data Collected in a Card Sort
Of course, the main type of data you will collect in a card sort relates to the information architecture, but you can collect additional information. There are five types of changes participants can make to the cards you provide:
Any of the changes that participants make to the cards must be analyzed manually (covered later – see page 438). Often, the additional information that you obtain by allowing participants to make these changes justifies the additional work. However, it is a decision for you to make.
Delete an object
If a participant does not think an object belongs in the domain, he or she can remove it. For example, if you have the object “School bus” in a card sort for your travel website, a participant may want to remove it because in that person’s experience, school buses are never provided as an option on travel websites. Additionally, you may allow participants to delete a card if they do not use the object in real life.
Allowing participants to remove cards reveals whether you are providing users with content or tasks that are unnecessary – which represent “noise” for the user to deal with. It can also reveal whether you (or the development team) have an incorrect perception of the domain (e.g., providing school buses on a travel website). However, you may have a product where all of your features must be included for business reasons. If this is the case you would not want to allow participants to create a “discard” pile.
Add a new object
As participants read through the cards, they begin to understand the depth and breadth of information or tasks your product supports. They may realize that certain information or tasks are missing from the sort, and therefore from your product. Using our travel example, a participant may notice that “Airport code” is missing from the sort and adds it in. Perhaps this was left out because the development team thought that the full name of the airport was more helpful and the airport code is unnecessary. Allowing participants to add cards points out information or tasks that users expect to have in your product. You should also ask users to define any objects they add and state why they are adding them.
Rename objects
As we mentioned at the beginning of the chapter, you can collect information about terminology in a card sort. You might present participants with an object they are familiar with, but in their opinion the name of the object and definition do not match up. Sometimes differences exist between companies or different parts of the country, or there is an industry standard term that you were not aware of. Technical jargon or abbreviations that we are not aware of are sometimes used in the workplace, or users may simply have another term for the object in their workplace. By allowing participants to change the names of your objects, you collect information about terminology that you may not have had before.
Change a definition
Providing a definition for each term ensures that everyone is on the same page. This is critical when asking participants to organize information. If everyone has a different understanding of the objects they are sorting, there will be no consensus in the organization of the cards. Sometimes, the definitions provided are incomplete or not quite right, so allow participants to make additions, deletions, or word changes to the definitions. For example, you may have defined a certain object as “standard” or “best practice” but the participants point out that the object is just one of many practices and not necessarily the best practice or even the standard. This is important for you to know.
Place an object in multiple groups
Sometimes participants tell you that a single object belongs in multiple locations. In order to do this, a participant would need to create a duplicate card. This adds some complexity to the data analysis but you may want to collect this information (see “Data Analysis and Interpretation,” page 432). You want to understand where an object best fits, so ask participants to place the card provided in the best group. Then, ask them to create as many duplicate cards as necessary and place them in the additional locations.
Players in Your Activity
Of course you will need end users to take part, but you will also require other people to help conduct the activity. In this section, we discuss the details of all the players involved in a card sort session.
The participants
A study recently conducted with 168 participants found that a card sort with only 20–30 participants can yield an average correlation coefficient of well over 0.9 (Tullis & Wood 2004). Beyond 30 participants, you get diminishing returns. We typically run one or two group sessions with 10–12 participants of the same user type. If you are short on time and resources, however, run six or eight participants and analyze the data. Add an additional couple of participants and see whether the addition of each new user changes the groupings (this is a good time to collect think-aloud data). If the results are stable and the major groups do not change, there is no need to run additional participants.
All participants should meet the same user profile (refer to Chapter 2, Before You Choose an Activity, “Learn About Your Users” section, page 41). If you wish to compare user types (e.g., novice versus expert), we recommend using the analysis technique above (i.e., run six or eight of each type, analyze the data, add a couple more, see how the groups change, determine whether more participants are needed). It is not advisable to mix user types. If different user types sort information differently, you may need to create a different interface for each user type. Mixing the user types in the same sort washes out those differences and could result in an interface that no one can use. Refer to Chapter 5, Preparing for Your User Requirements Activity, “Recruiting Participants” section, page 156 for more information.
The facilitator
Only one facilitator is needed for the activity, whether it is conducted as a group or individually. If you run a group, it helps to have a co-worker as an extra pair of hands but that is optional. The job of the facilitator is to provide initial instructions, distribute the materials, answer any questions along the way, and then collect the materials. If run as a group, the majority of the session is spent sitting quietly, answering any questions, and making sure people are not comparing their sorts. If run individually, the facilitator must be familiar with the think-aloud protocol and how to instruct participants in it (refer to Chapter 6, During Your User Requirements Activity, “Introducing Your Think-aloud Protocol” section, page 218). The facilitator will also need to take notes of what a participant is thinking, and it is advisable to record the session in case you miss something.
The videographer
If you are conducting the card sort as a group, there is no discussion to videotape, but if conducting the sort individually, it is beneficial to record so that you can capture the think-aloud data. You will find a detailed discussion of videotaping tips and the benefits of videotape in Chapter 6, During Your User Requirements Activity, “Recording and Note-taking” section, page 226. If you plan to record, make sure that someone takes responsibility for this task. It is ideal if you can have someone to monitor the video equipment during the session in case something goes wrong; but if that is not possible, set up the shot, hit “Record,” and hope that nothing goes wrong.
Inviting Observers
If you are conducting the card sort as a group, there is nothing for an observer to see except a room full of people silently grouping cards. If the session is conducted individually, stakeholders will find it interesting to hear why people group objects the way they do. Refer to Chapter 6, During Your User Requirements Activity, “Inviting Observers” section (page 216) for more information.
Conducting a Card Sort
You have prepared for the card sort and now you need to actually conduct the session (see Figure 10.2). Whether conducted with a group or individually, the steps are the same. Some minor differences in instructions are noted below.

Activity Timeline
The timeline in Table 10.2 shows the sequence and timing of events to conduct a card sort. These are approximate times based on our personal experience and should be used only as a guide. The overall length of the session will obviously depend on the number of cards to be sorted. As we mentioned earlier, participants can typically sort 50–70 cards in a one-hour session.
Table 10.2
Timeline for conducting a card sort
| Approximate duration | Procedure |
| 3 minutes | Welcome participants (introductions, forms) |
| 5 minutes | Conduct a card sort practice |
| 3 minutes | Instructions |
| 30–100 minutes | Card sorting |
| 5 minutes | Wrap-up (distribute incentives, thank participants, escort them out) |
Welcome the Participants
This is the time during which you greet your participants, allow them to eat some snacks, ask them to fill out paperwork, and get them warmed-up. The details of these stages are described in Chapter 6, During Your User Requirements Activity, “Welcoming Your Participants” section, page 209.
Practice
Upon their arrival, explain to the participant(s) that the purpose of the activity is to gain an understanding of how people group a set of concepts. We then begin with a practice exercise so that they understand exactly what we will be doing. We typically write about 12–15 types of zoo animals on a flip chart or whiteboard (e.g., grizzly bear, ape, polar bear, monkey). We then ask participants to call out animals that they think belong in the same group (e.g., polar bear and grizzly bear). We circle the items and then ask them to name that group (e.g., bears). See Figure 10.3 for an example.

Card Review and Sorting
Once everyone is comfortable with the concept, distribute the cards and provide some instructions. You can use the following sample script:
“We are currently designing <insert product description> and we need to understand how to best organize th, <information or tasks> in the product. This will help users of the product find what they are looking for more easily.
“On each of the cards we have written a <piece of information or task> in our proposed product, along with a description of it. Please read through all of the cards and make sure both the terms and definitions make sense. If the terms or definitions do not make sense, please make corrections directly on the cards. Use the blank line to rename the object to something that makes more sense to you. In addition, please let me know what changes you are making so I can be sure that I understand what you are writing.
“Once you have reviewed all the cards, you may begin sorting them into groups that belong together. There are no right or wrong answers. Although there may be multiple ways you can group these concepts, please provide us with the groupings that you feel make the most sense. When you are sorting, you may place any cards that do not belong (or that you do not use, do not understand, etc.) in a discard pile, and you may use the blank cards to add any objects that are missing. If you feel that a particular card belongs in more than one location, please place the card provided in th best location you believe it fits. Use the blank cards to create as many duplicate cards as necessary and place those in the secondary groups.
If this is a group card sort, add: “Please do not work with your neighbor on this. We want to understand how you think these cards should be grouped. We do not want a group effort – so please don’t look at your neighbors’ cards.” If this is an individual sort, state: “I would like for you to think-aloud as you work. Tell me what you are thinking as you are grouping the cards. If you go quiet, I will prompt you for feedback.” (Refer to Chapter 6, During Your User Requirements Activity, “Introducing Your Think-aloud Protocol” section, page 218, for more information.)
Whenever participants make a change to a card, we strongly encourage them to tell us about it. It helps us to understand why they are making the change. In a group session, it offers us the opportunity to discuss the change with the group. We typically ask questions like
“John just made a good point. He refers to a ‘travel reservation’ as a ‘travel booking.’ Does anyone else call it that?”
“Jane noticed that ‘couples-only resorts’ is missing. Does anyone else book ‘couples-only resorts?’ ”
If anyone nods in agreement, we ask him/her to discuss the issue. We then ask all the participants who agree to make the same change to their card(s). Participants may not think to make a change until it is brought to their attention, otherwise they may believe they are the only ones who feel a certain way and do not want to be “different.” Encouraging the discussion helps us decide whether an issue is pervasive or limited to only one individual.
Participants typically make terminology and definition changes while they are reviewing the cards. They may also notice objects that do not belong and remove them during the review process. Most often, adding missing cards and deleting cards that do not belong are not done until the sorting stage – as participants begin to organize the information.
Labeling Groups
Once the sorting is complete, the participants need to name each of the groups. Give the following instructions:
“Now I would like for you to name each of your groups. How would you describe the cards in each of these piles? You can use a single word, phrase, or sentence. Please write the name of each group on one of the blank cards and place it on top of the group. Once you have finished, please staple each group together, or if it is too large to staple, use a rubber band. Finally, place all of your bound groups in the envelope provided.”
Data Analysis and Interpretation
There are several ways to analyze the plethora of data you will collect in a card sort exercise. We describe here how to analyze the data via programs designed specifically for card sort analysis as well as with statistical packages (e.g., SPPS, SAS, Statistica™) and spreadsheets. We also show how to analyze data that computer programs cannot handle. Finally, we walk you through an example to demonstrate how to interpret the results of your study.
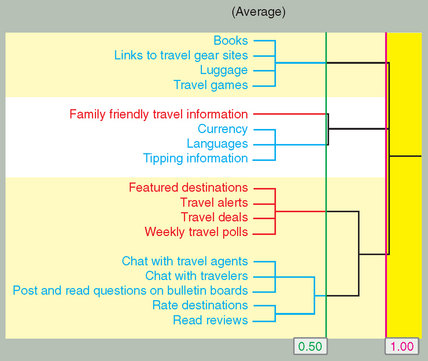
When testing a small number of participants (four or less) and a limited number of cards, some evaluators simply “eyeball” the card groupings. This is not precise and can quickly become unmanageable when the number of participants increases. Cluster analysis allows you to quantify the data by calculating the strength of the perceived relationships between pairs of cards, based on the frequency with which members of each possible pair appear together. In other words, how frequently did participants pair two cards together in the same group? The results are usually presented in a tree diagram or dendrogram (see Figures 10.4 and 10.5 for two examples). This presents the distance between pairs of objects, with 0.00 being closest and 1.00 being the maximum distance. A distance of 1.00 means that none of the participants paired the two particular cards together; whereas 0.00 means that every participant paired those two cards together.

Brief Description of How Programs Cluster Items
Cluster analysis can be complex, but we can describe it only briefly here. To learn more about it, refer to Aldenderfer & Blashfield (1984), Lewis (1991), or Romesburg (1984).
The actual math behind cluster analysis can vary a bit, but the technique used in most computer programs is called the “amalgamation” method. Clustering begins with every item being its own single-item cluster. Let’s continue with our travel example. Below are eight items from a card sort:

Participants sort the items into groups. Then every item’s difference score with every other item is computed (i.e., considered pair-by-pair). Those with the closest (smallest) difference scores are then joined. The more participants who paired two items together, the shorter the distance. However, not all the items are necessarily paired at this step. It is entirely possible (and in fact most probable) that some or many items will not be joined with anything until a later “round” or more than two items may be joined. So after “round 1,” you may have:
![]() Hotel reservation and Frequent-guest credit
Hotel reservation and Frequent-guest credit
![]() Airplane ticket and Frequent-flyer miles
Airplane ticket and Frequent-flyer miles
Now that you have several groups comprised of items, the question is: “How do you continue to join clusters?” There are several different amalgamation (or linkage) rules available to decide how groups should next be clustered, and some programs allow you to choose the rule used. Below is a description of three common rules.
If any members of the groups are very similar (i.e., small distance score because many participants have sorted them together), the groups will be joined. So if “Frequent-guest credit” and “Frequent-flyer miles” are extremely similar, it does not matter how different “Hotel reservation” is from “Airplane ticket” (see “round 1” groupings above); they will be grouped in “round 2.”
This method is commonly called the “nearest neighbor” method, because it takes only two near neighbors to join both groups. Single linkage is useful for producing long strings of loosely related clusters. It focuses on the similarities among groups.
This is effectively the opposite of single linkage. Complete linkage considers the most dissimilar pair of items when determining whether to join
groups. Therefore, it doesn’t matter how extremely similar “Frequent-guest credit” and “Frequent-flyer miles” are; if “Hotel reservation” and “Airplane ticket” are extremely dissimilar (because few participants sorted them together), they will not be joined into the same cluster at this stage (see “round 1” groupings above).
Not surprisingly, this method is commonly called the “furthest neighbor” method, because the joining rule considers the difference score of the most dissimilar (i.e., largest difference) pairs. Complete linkage is useful for producing very tightly related groups.
This method attempts to balance the two methods above by taking the average of the difference scores for all the pairs when deciding whether groups should be joined. So the difference score between “Frequent-guest credit” and “Frequent-flyer miles” may be low (very similar), and the difference score of “Hotel reservation” and “Airplane ticket” may be high but, when averaged, the overall difference score will be somewhere in the middle (see “round 1” groupings above). Now the program will look at the averaged score to decide whether “Hotel reservation” and “Frequent-guest credit” should be joined with “Airplane ticket” and “Frequent-flyer miles,” or whether the first group is closer to the third group, “Rental auto” and “Rental pick-up point.”
You can analyze the data from a card sort with a software program specifically designed for card sorting or with any standard statistics package. We will describe each of the programs available and why you would use it.
Analysis with a Card Sorting Program
At the time of publication, there are at least four programs available on the web that are designed specifically for analyzing card sort data:
![]() WebSort (www.websort.net/) which uses EZCalc to analyze the data
WebSort (www.websort.net/) which uses EZCalc to analyze the data
![]() CardZort/CardCluster (http://condor.depaul.edu/∼jtoro/cardzort/cardzort.htm)
CardZort/CardCluster (http://condor.depaul.edu/∼jtoro/cardzort/cardzort.htm)
Data analysis using these tools has been found to be quicker and easier than using manual methods (Zavod, Rickert, & Brown 2002).
Analysis with a Statistics Package
Statistical packages like SAS, SPSS, and Statistica are not as easy to use as specialized card sort programs when analyzing card sort data; but when you have over 100 cards in a sort, USort/EZCalc and WebCAT cannot be used. A program like SPSS is necessary, but any package that has cluster analysis capabilities will do.
Analysis with a Spreadsheet Package
Most card sort programs have a maximum number of cards that they can support. If you have a very large set of cards, a spreadsheet (e.g., Microsoft Excel, Lotus™ Notes) can be used for analysis The discussion of how to accomplish this is complex and beyond the scope of this book. You can find an excellent, step-by-step description of analyzing the data with a spreadsheet tool at www.boxesandarrows.com/archives/analyzing_card_sort_results_with_a_spreadsheet_template.php.
Data that Computer Programs Cannot Handle
Computer programs can be great, but they often do not do all of the analysis for you. Below are some of the issues that we have encountered when using different electronic programs. Although the data analysis for these elements is a little awkward, we think the value that the data bring makes them worth collecting.
Adding or renaming objects
One of the basic requirements of cluster analysis is that all participants must have the exact same set of cards in terms of name and number. If participants renamed any of the objects or if they added any cards, you will not be able to add this information into the program. You will need to record this information for each participant on a sheet of paper and analyze it separately. The number of cards added or changed tends to be very small but it is an extra step to take. Returning to our earlier example, you notice that participant 1 added the object “airport code.” Write this down and then tally the number of other participants who did the same thing. At the end, you will likely have a small list of added and renamed objects, along with the number of participants who made those changes. Based on the number of participants who added it, you can assess its importance.
Group names
The group names that participants provide are not presented in the analysis. You will need to record the pile names that participants suggested and do your best to match them to the results. We typically write down the names of each group for each participant and look for similarities at the end. How many participants created an “Airline Travel” group? How many created a “Hotel” group? When examining the dendrogram, you will notice clusters of objects. See if there is a match between those clusters and the names of the groups that participants created.
Duplicate objects
As we discussed earlier, sometimes participants ask to place an item in multiple locations. Because the computer programs available do not allow you to enter the same card more than once and you must have the same number of cards for each participant, include the original card in the group the participant placed it. The duplicate cards placed in the secondary groups will have to be examined and noted manually.
Deleted objects
EZCalc is the only program we are aware of that can handle discards automatically. Many computer programs cannot deal with deleted cards. For these programs, if you have allowed participants to create a discard or miscellaneous pile of cards that they do not believe belong in the sort, there is a workaround you need to do. You cannot enter this collection of discarded cards as a group into a computer program since the cluster analysis would treat these cards as a group of objects that participants believe are related. In reality, these cards are not related to any of the other cards. Place each rejected card in a group by itself to demonstrate that it is not related to any other card in the cluster analysis. For example, if participants placed “Frequent Flyer Miles,” “Companions,” and “Meal Requests” in the discard pile, you should enter “Frequent Flyer Miles” in one group, “Companions” in a second group, and “Meal Requests” in a third group.
Interpreting the Results
You now have a collection of rich data. The dendrogram displays groups of objects that the majority of participants believe belong together.
Changes that participants make to cards can make interpretation of the results tricky. When a deleted object is repeatedly placed in a group by itself (or left out, in the case of EZCalc), you may see it on a branch by itself or loosely attached to a group that it really doesn’t belong with. Additionally, if participants place an object in multiple groups, they may not have agreed on the “best” location to place it. Consequently, you may find the object is living on a branch by itself or loosely attached to a group that it really doesn’t belong with. You must use your knowledge of the domain or product to make adjustments when ambiguity exists. Use the additional data you collected like new objects, group names, changed terminology, and think-aloud data to help interpret the data.
Let’s walk through our travel example and interpret the results of our dendrogram shown earlier in Figure 10.4. Using our domain knowledge and the group labels participants provided in the card sort, we have named each of the clusters in the dendrogram (see Figure 10.6). We appear to have four clear groups: “Products,” “Resources,” “News,” and “Opinions.”

It is important to note that the card sort methodology will not provide you with information about type of architecture you should use (e.g., tabs, menus). This decision must be made by a design professional. Instead, the tree diagram demonstrates how participants expect to find information grouped. In the case of a web-based application with tabs, the tree may present the recommended name of the tab and the elements that should be contained within that particular tab.
Now you should examine the list of changes that participants made (e.g., renamed cards, additional cards) to discover whether there is high agreement among participants.
![]() What objects did participants feel you were missing?
What objects did participants feel you were missing?
![]() What objects did participants feel did not belong?
What objects did participants feel did not belong?
![]() What are all of the terminology changes participants made?
What are all of the terminology changes participants made?
Use this information to determine whether your product needs to add or remove information or tasks in order to be useful to participants. You may recommend to the team that they conduct a competitive analysis (if they haven’t already) to discover whether other products support such functionality. Similarly, use the information about deleted objects to recommend that the team examine whether specific information or tasks are unnecessary.
Terminology can be specific to a company, area of the country, or individual. With each terminology change, you will need to investigate whether it is a “standard” – and therefore needs to be incorporated – or whether there are several different possible terms. When several terms exist, you will want to use the most common term but allow your product to be customized so that it is clear to all your users.
Finally, examine the definition changes. Were the changes minor – simply an issue of clarification? If so, there isn’t anything to change in your product. If, however, there were many changes, you have an issue. This may mean that the product development team does not have a good grasp of the domain, or that there is disagreement within the team about what certain features of the product do.
Communicate the Findings
Preparing To Communicate Your Findings
The specific data that you communicate to product teams can vary depending upon the activity you conducted, but some elements of how you communicate the results are the same regardless of the method. Because these strategies are common to all user requirements activities, they are discussed in detail in Chapter 14, Concluding Your Activity, page 636. We recommend that you read that chapter prior to relaying your results to your stakeholders. Topics discussed include:
When we present the results of a card sort analysis to executives or teams, we present the actual dendrogram generated by the application (as in Figure 10.6) and a simple table to review (see Figure 10.7). We also present a table of changes that participants made to the cards (added objects, deleted objects, terminology changes, and definition changes) and any sketches the designers may have produced to illustrate the recommendations. (Refer to Chapter 14, Concluding Your Activity, “Reporting Your Findings” section, page 652, to learn more about reporting usability results.)

As with all of the other user requirements methodologies, the card sort is a valuable addition to your software requirements documentation. These results can be incorporated into documentation such as the Detailed Design Document. Ideally, additional user requirements techniques should be used along the way to capture new requirements and verify your current requirements.
Modifications
Below are a few modifications on the card sorting technique we have presented. You can limit the number of groups users can create, use computerized tools for the sort instead of physical cards, provide the groups for users to place the cards in, ask users to describe the items they would find in a particular category, or physically place groups that are related closer to each other.
Limit the Number of Groups
You may need to limit the number of groups a participant can create. For example, if you are designing a website and your company has a standard of no more than seven tabs, you can ask participants to create seven or fewer groups. Alternatively, you can initially allow participants to group the cards as they see fit; then, if they create more than seven groups, ask them to regroup their cards into higher-level groups. In the second case, you should staple all the lower-level groups together and then bind the higher-level groups together with a rubber band. This will allow you to see and analyze both levels of groupings.
Electronic Card Sorting
There are tools available that allow you to have the users sort the cards electronically rather than using physical cards (i.e., USort, WebCAT, Classified, WebSort, Socratic CardSort, CardZort). Electronic card sorting can save you time during the data analysis phase because the sorts are automatically saved in the computer. Another advantage is that, depending on the number of cards, users can see all of the cards available for sorting at the same time. Unless you have a very large work surface for users to spread their physical cards on, this is not possible for manual card sorts. Electronic sorting has the disadvantage that, if you run a group session, you will need a separate computer for each participant. This means money and potential technical issues. In addition, you need to provide a brief training session to explain how to use the software. Even with training, the user interface may be difficult for users to get the hang of.
Some tools support remote testing which allows you to gather data from users anywhere. However, users may have a more difficult time without a facilitator in the room to answer questions.
Unfortunately, none of the computer-based programs provides a definition with the objects. Also, they do not allow users to add, delete, or rename the objects. In our opinion, this is a serious shortcoming of the tools and the reason why we do not use them.
Pre-name the Groups
You may already know the buckets that the objects being sorted must fit into. Going back to our website example, if you cannot completely redesign your site, you may want to provide participants with the names of each tab, section, or page of your site. Provide participants with a “placemat” for each group. The placemat should state the name of the group and provide a clear description of it. Participants would then be tasked with determining what objects fit into the predetermined groups.
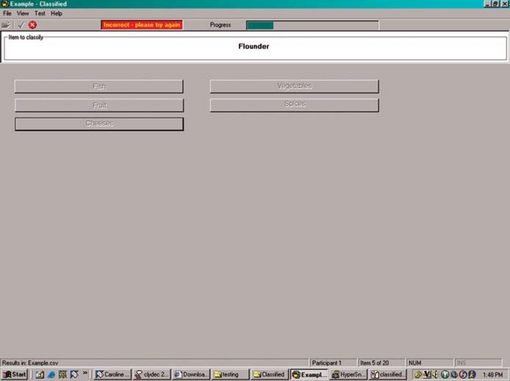
To go one step further, you may have the structure for your entire application already laid out and simply want to find out whether you are correct. Applications like Classified® by Information and Design and UCDesign (www.infodesign.com.au/usabilityresources/classified/default.asp) and Socratic Technologies’ Socratic Card-Sort (www.sotech.com/main/eval.asp?pID=123) can help you assess this (see Figures 10.8 and 10.9). These applications present users with the category names you pick and ask them to drop the predefined objects into the most appropriate category. Because the program appears to scold users when they do not place objects in the groups the product team chose (“Incorrect – please try again”) and because it eventually trains users to think like the product team, we do not use Classified.

Figure 10.8a Screens from Classified. If the participant selects the same category you placed the item in, a green box with the word “Correct” is shown

Lessons Learned
The first time we used EZSort (IBM’s predecessor to USort/EZCalc), we did not know that the program would choke if given over 90 cards. We prepared the material, ran the study, and then entered the data for 12 participants and 92 cards. When we hit the button to compute the results, it blew up. There was no warning and nothing to prevent us from making the mistake. It took extensive investigation to determine the cause of the problem, including contacting the creators of EZSort. By that point, there wasn’t much we could do. We were forced to divide the data, enter it in chunks, and compute it. This had to be done several times so that the data overlapped. This was a painful lesson to learn. Rest assured that we never use a free program now without thoroughly reviewing the “Release Notes” and website from where we downloaded the program. We also look for other documents such as “Known Bugs.”
Pulling It All Together
In this chapter, we have discussed what a card sort is, when you should conduct one, and things to be aware of. We also discussed how to prepare for and conduct a card sort, along with several modifications. Finally, we have demonstrated various ways to analyze the data and used our travel example to show you how to interpret and present the results.
Below, Ginny Redish presents a case study to share with readers how she recently employed a card sort to build the information architecture for a government website.
How Card Sorting Changed a Website Team’s View of How the Site Should Be Organized
Janice (Ginny) Redish, Redish & Associates, Inc.
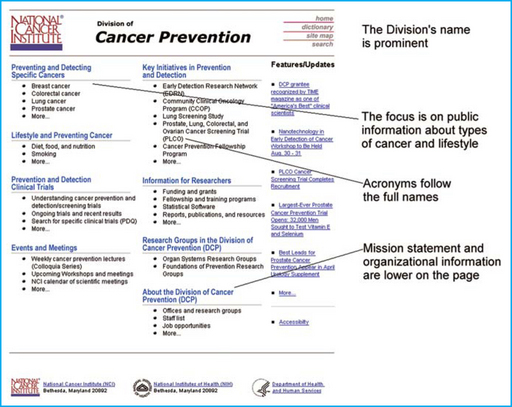
This case study is about the website of the US National Cancer Institute’s Division of Cancer Prevention. When the study began, the division’s website focused on its mission and internal organization (see Figure 10.10).

Our Approach
I was brought in as a consultant to help the division’s web project team revise the site. They knew it needed to change, and the division’s new Communications Manager, Kara Smigel-Croker, understood that it did not have the public focus that it needed.
We began by having me facilitate a two-hour meeting of the division’s web project team at which we discussed and listed the purposes of the site and the many user groups the site must serve.
Although the site, at that time, reflected the organization of the division and the research that it funds, the project team agreed that the mission of the website was to be the primary place that people come to for information on preventing cancer.
When we listed audiences, we found many potential users – from the public to medical professionals to researchers to students – and, of course, realized that there would be a wide range of knowledge and experience within each of these audiences.
In addition to listing purposes and audiences, the third activity in our initial meeting was to understand the scenarios that users would bring to the site. I handed out index cards, and each member of the project team wrote a sample scenario. The most interesting and exciting result was that after just our brief discussions of purposes and audiences, 17 of 18 members of the project team wrote a scenario about a member of the public coming for information about preventing cancer, even though, at that time, there was almost no information on the site for the general public! (The 18th scenario was about a graduate student seeking a post-doctoral fellowship – a very legitimate scenario for the website.)
The stage was now set for card sorting. The project team agreed that card sorting was the way to find out how members of the public and medical professionals would look for information on the site.
Planning and Preparing for the Card Sorting
Members of the project team wrote cards for topics. In addition to the topics from each research group and from the office that handles fellowships, we added cards for types of cancer and for articles that existed elsewhere in the many, many National Cancer Institute websites to which we could link.
How Many Cards?
We ended up with 300 cards – many more than we could expect users to sort in an hour. How did we winnow them down? We used examples rather than having a card for every possible instance of a type of topic or type of document.
For example, although there are many types of cancer, we limited the cards to about ten types. For each type of cancer, you might have information about prevention, screening, clinical trials, etc. Instead of having a card for each of these for each type of cancer, we had these cards for only two types of cancer – and our card sorters quickly got the point that the final website would have comparable entries for each type of cancer. Instead of having a card for every research study, we had examples of research studies.
Even with the winnowing, we had about 100 cards – and that was still a lot for some of our users. An ideal card sorting set seems to be about 40 to 60 cards.
What Did the Cards Look Like?
Figure 10.11 shows examples of the cards. Each topic went on a separate 3 in × 5 in white index card. We typed the topics in the template of a page of stick-on labels, printed the topics on label paper, and stuck them onto the cards – one topic per card. We created two “decks” of cards so that we could have back-to-back sessions.

We also numbered the topics, putting the appropriate number on the back of each card. Numbering is for ease of analysis and for being able to have back-to-back sessions. Here’s how it worked. In hour 1, participant 1 sorted deck 1. In hour 2, participant 2 sorted deck 2 while someone copied down what participant 1 did, using the numbers on the back of the cards to quickly write down what topics participant 1 put into the same pile. Deck 1 was then reshuffled for use in hour 3 by participant 3, and so on.
With stick-on labels and numbers for the topics, you can make several decks of the cards and have sessions going simultaneously as well as consecutively.
Recruiting Users for the Card Sorting
![]() Eight people from outside who came one at a time for an hour each
Eight people from outside who came one at a time for an hour each
![]() About 12 people from inside – from the project team – who came either singly or in pairs for an hour each; pairs worked together, sorting one set of cards while discussing what they were doing – like co-discovery in usability testing.
About 12 people from inside – from the project team – who came either singly or in pairs for an hour each; pairs worked together, sorting one set of cards while discussing what they were doing – like co-discovery in usability testing.
The National Cancer Institute worked with a recruiting firm to bring in cancer patients/survivors, family members of cancer patients/survivors, members of the public interested in cancer, doctors, and other health professionals. Our eight external users included people from each of these categories. The external people were paid for their time.
Conducting the Card Sorting Sessions
The only real logistic need for card sorting is a large table so that the participant can spread out the cards. We held sessions in an empty office with a large desk, in a conference room, and on a round conference table in another office. The conference room table worked best; one participant especially liked the chair on wheels so he could roll up and down next to the table looking at his groupings. Other participants sorted the cards standing up so they could reach along the table to work with the cards they had already put out.
In addition to the deck of cards with topics on them, we also had:
![]() Extra white cards for adding topics
Extra white cards for adding topics
![]() Sticky notes for indicating cross-links (when participants wanted a topic to be in two places, we asked them to put it in the primary place and write a sticky note to indicate what other group should have a link to it)
Sticky notes for indicating cross-links (when participants wanted a topic to be in two places, we asked them to put it in the primary place and write a sticky note to indicate what other group should have a link to it)
![]() Cards in a color for putting names on the groups at the end
Cards in a color for putting names on the groups at the end
![]() Rubber bands for keeping each group of cards together at the end
Rubber bands for keeping each group of cards together at the end
The instructions for card sorting are very simple. You put the first card on the table. You then look at the second card and decide whether it goes into the same group as the first or not. If yes, you put the two cards together. If no, you start a second pile. And so on. Participants had no difficulty understanding what to do.
We also explained that we were building the home page and navigation for a website. This gave participants a sense of about how many piles (groups) it would make sense to end up with.
Participants were also told that they could:
![]() Rearrange the cards and groups as they went – that’s why the topics are on separate cards
Rearrange the cards and groups as they went – that’s why the topics are on separate cards
![]() Reject a card – put it aside or throw it on the floor – if they did not know what it meant or if they did not think that it belonged on the site
Reject a card – put it aside or throw it on the floor – if they did not know what it meant or if they did not think that it belonged on the site
![]() Write a card if they thought a topic was missing
Write a card if they thought a topic was missing
![]() Write a sticky note if they would put the card in one group but also have a link to it from another group.
Write a sticky note if they would put the card in one group but also have a link to it from another group.
We encouraged the participants to think aloud, and we took notes. However, we found that the notes we have from think-aloud in card sorting are not nearly as rich as those we have from usability testing, and that the card sorts themselves hold the rich data. We have since done card sorting studies for other projects in which we have run simultaneous sessions without a note-taker in each – and thus without anyone listening to a think-aloud. (We did not tape these sessions.) In these other projects, several sorters worked at the same time, but each worked independently, in different rooms, with the facilitator just checking in with each card sorter from time to time and doing a debrief interview as each person finished.
When the participants had sorted all the cards, we gave them the colored cards and asked them to name each of their groups. We also asked them to place the groups on the table in the approximate configuration that they would expect to find the groups on the home page of a website.
The Analysis
In this study, we found that we did not need to do a formal analysis of the data to meet our goals of understanding at a high level what categories people wanted on the home page, where on the home page they would put each category, and the general type of information (topics) that they would expect in each category. We did not do a formal analysis with complex cluster analysis software for at least four reasons:
![]() This was a very small study – eight users.
This was a very small study – eight users.
![]() We were looking only at the top level of an information architecture. Our interest was the home-page categories with names and placement on the page for those categories and a general sense for the types of information that would go in each category. We were not doing an entire information architecture or putting every underlying piece of content into a category.
We were looking only at the top level of an information architecture. Our interest was the home-page categories with names and placement on the page for those categories and a general sense for the types of information that would go in each category. We were not doing an entire information architecture or putting every underlying piece of content into a category.
![]() This was just one step in an iterative process. Our goal was to get input for a prototype that we would take to usability testing. The project continued through several rounds of prototypes and usability testing.
This was just one step in an iterative process. Our goal was to get input for a prototype that we would take to usability testing. The project continued through several rounds of prototypes and usability testing.
![]() It was obvious as soon as the sessions were over that there was incredibly high agreement among the users on the categories, names, and placements.
It was obvious as soon as the sessions were over that there was incredibly high agreement among the users on the categories, names, and placements.
If any of these four had not been the case, a formal analysis with one of the available software tools would have been imperative.
We put each person’s results on a separate piece of paper – with the group (category) names in the place they would put it (see Figure 10.12).

We spread these pages out on a conference room table and looked them over for similarities and differences. The similarities were very striking, so we took that as input to a first prototype of a new website, which we then refined during iterative usability testing.
Main Findings
Card sorting can produce a high degree of consensus about what a home page should look like. In this case, looking just at the eight external card sorters’ topics for the home page:
![]() Seven had types of cancer or some variant – and they put it in the upper left corner of the page.
Seven had types of cancer or some variant – and they put it in the upper left corner of the page.
![]() Six had prevention or lifestyle or some variant. This category included topics such as exercise, tobacco cessation, nutrition, eating habits, as well as general information about preventing cancer.
Six had prevention or lifestyle or some variant. This category included topics such as exercise, tobacco cessation, nutrition, eating habits, as well as general information about preventing cancer.
![]() Five had clinical trials or some variant. They wanted a main entry to all the clinical trials as well as a link to each from the relevant type of cancer.
Five had clinical trials or some variant. They wanted a main entry to all the clinical trials as well as a link to each from the relevant type of cancer.
![]() Six had About NCI DCP or Administration. This category included the mission statement, organization chart, directory, etc. Although two of eight also wanted a very brief mission statement with a link in the upper left corner of the home page, all six put the About… category in the lower right of the page.
Six had About NCI DCP or Administration. This category included the mission statement, organization chart, directory, etc. Although two of eight also wanted a very brief mission statement with a link in the upper left corner of the home page, all six put the About… category in the lower right of the page.
Opening Internal Users’ Eyes
The technique itself can open the eyes of internal users to the problems with the way the site is currently designed.
The participants from the web project team (the internal users) all started by sorting cards into their organizational groups, creating once again the old website. However, after 5–10 minutes (and sometimes with a bit of prodding to “think about the users and scenarios you wrote in the meeting”), they made comments like this: “How would someone from the public know that you have to look under [this specific research group] to find out about that?”; “The public would want to look up a specific type of cancer”; “The public would want to look up information about diet or nutrition.”
In the end, each of the internal users came to very similar groupings as the public. They also realized on their own that information about the organization would not be the most important reason people came to the site. Like the public users, they put the About… category in the lower right of the page.
If you think of internal users as “developers,” you may wonder whether it was wise to let them do the card sorting. Of course, you do not want to have the developers (or internal users) be the only card sorters. The primary audience for the site must be the primary participants in any card sorting study.
In this case, however, the internal users were very curious about the technique. They wanted to try it, too. If we could have set up the card sorting sessions with the project team as observers (as we typically do for a usability test), that might have satisfied their curiosity. However, we did not have the facilities for observation for this particular study, so we decided to let them try the card sorting for themselves.
The danger, of course, was that they would remain in their own frame and not get beyond creating once again the site they knew. Just a little prodding to “think about the users,” however, made these internal project team members realize for themselves both that they could put themselves into the users’ frame and that, once in that frame, they could see how the users would want the site to be organized. Letting the internal people also do the card sorting might not always be wise; but in this case, for many of them, it was a “light bulb moment” that made them empathize even more with the external users.
Discovering Gaps in Understanding
With card sorting, you can find out about words that users do not know. All of the external card sorters ended up with some cards in a pile of “I can’t sort this because I don’t know what it means.”
The most common cards in that pile were ones with acronyms like ALTS, STAR, SELECT. Others were words like “biomarkers” and “chemoprevention.” This was a huge surprise to many of the NCI researchers. It was a critical learning for them; the acronyms refer to clinical trials that the division is funding. Information about these clinical trials is one of the great values of the site, but people will not find the information if it is hidden under an acronym that they do not recognize.
Getting a Better Understanding of Card Sorting
Card sorting is like usability testing in that you have to be concerned about recruiting representative users, but it is logistically easier than usability testing. You need only a conference table, cards, someone to get the user going and – if you are running consecutive sessions – someone to record what each participant has done and reshuffle the cards for another participant. The difficult part of card sorting is deciding on the topics to include and limiting the number of cards by choosing good exemplars of lower-level content rather than including every single article that might be on the site.
What Happened to the Website?
Figure 10.13 is the “after” version that was launched in the summer of 2001. (The current site at www.cancer.gov/prevention is a later update following NCI’s adoption of new look and feel standards.)
Acknowledgments. My time as a consultant to the NCI Division of Cancer Prevention (DCP) came through my work with the NCI Communication Technologies Branch (CTB) in the NCI Office of Communication. NCI is part of the US National Institutes of Health, Department of Health and Human Services. I thank Kara Smigel-Croker (DCP Communications Manager) for leading this project, and Madhu Joshi (who was a CTB Technology Transfer Fellow at the time) for handling all logistics and support.